. 2019 Oct 7;216(10):2412-2426.
doi: 10.1084/jem.20190414. Epub 2019 Jul 23.

Resident memory CD8 T cells persist for years in human small intestine

Affiliations

Resident memory CD8 T cells persist for years in human small intestine

Raquel Bartolomé-Casado et al. J Exp Med. .

Abstract

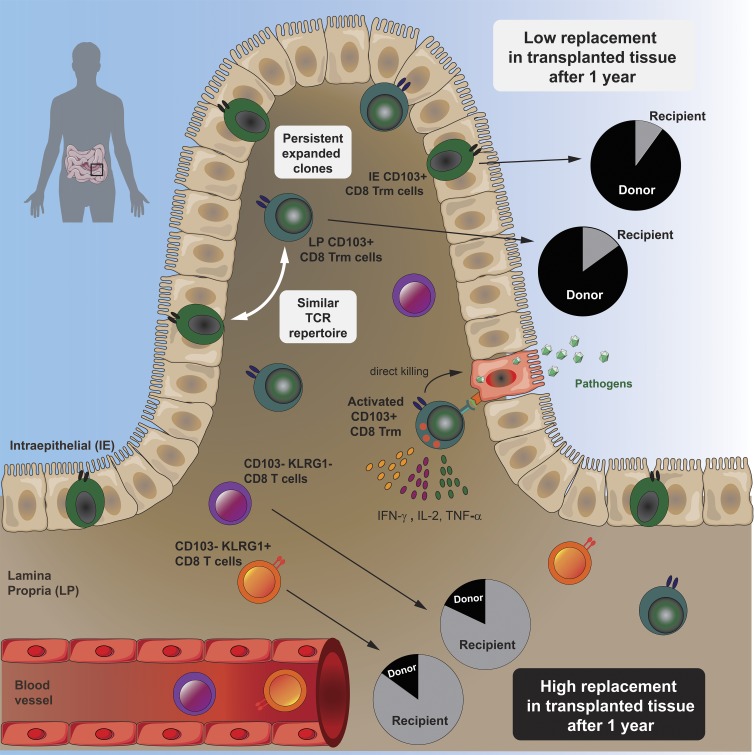
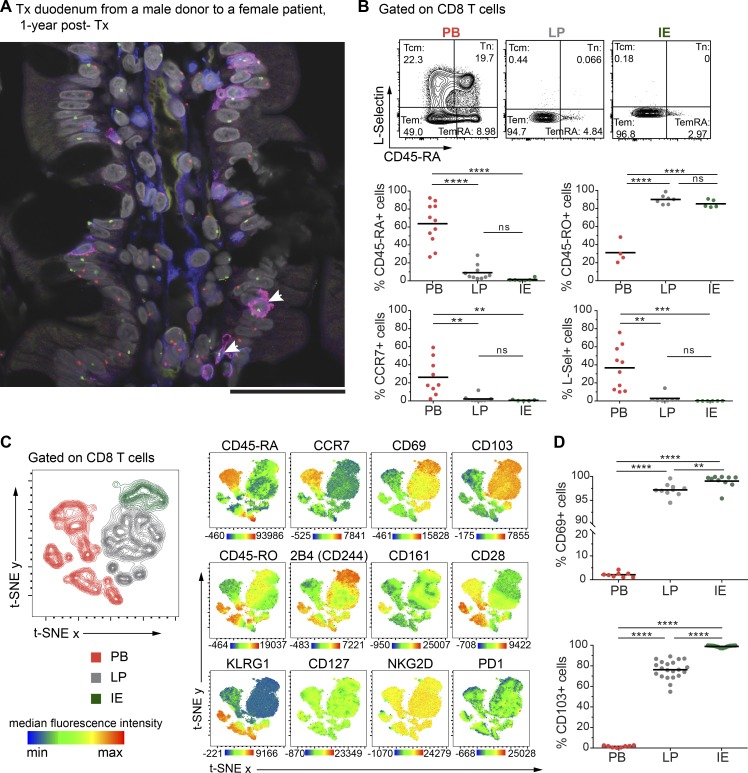
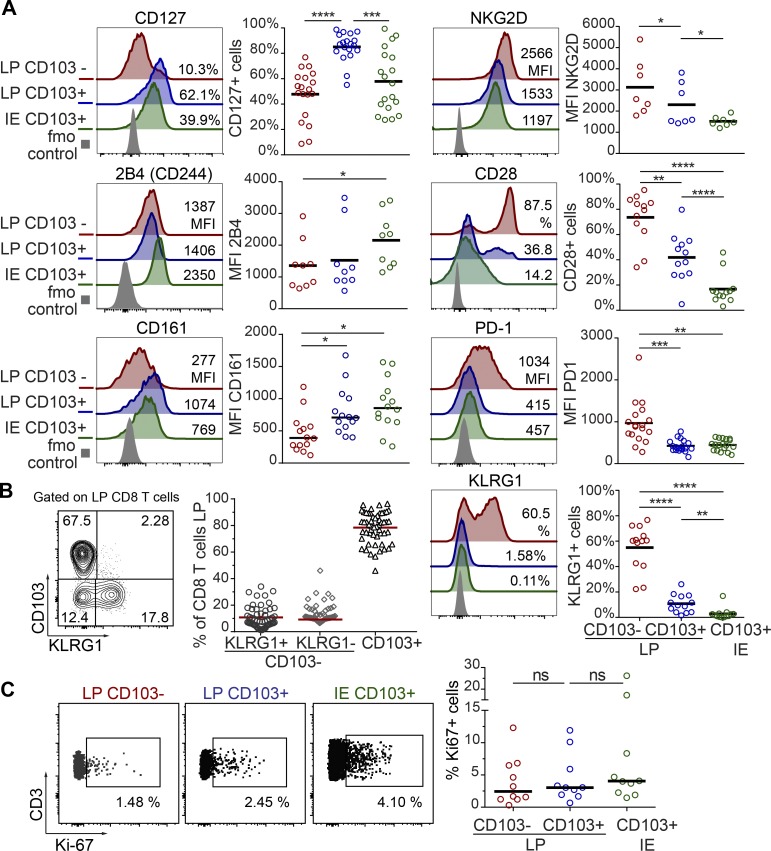
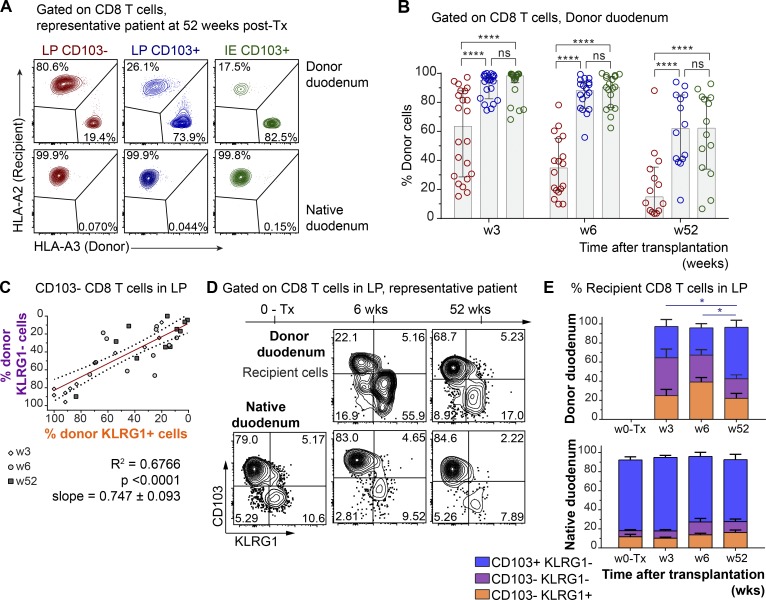
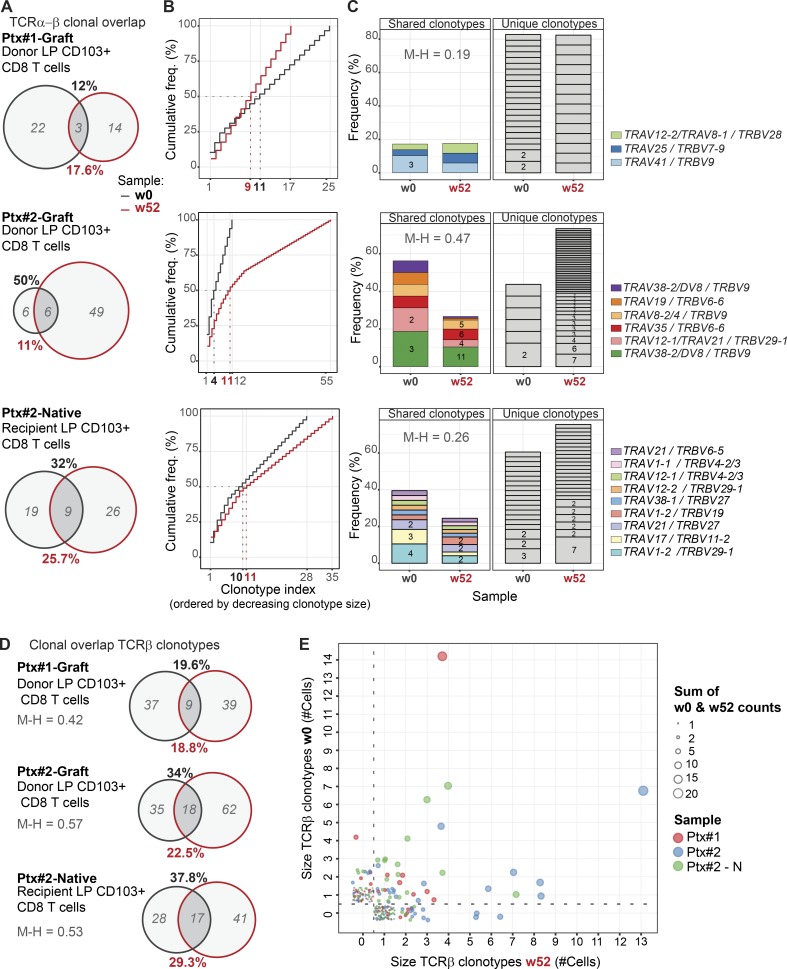
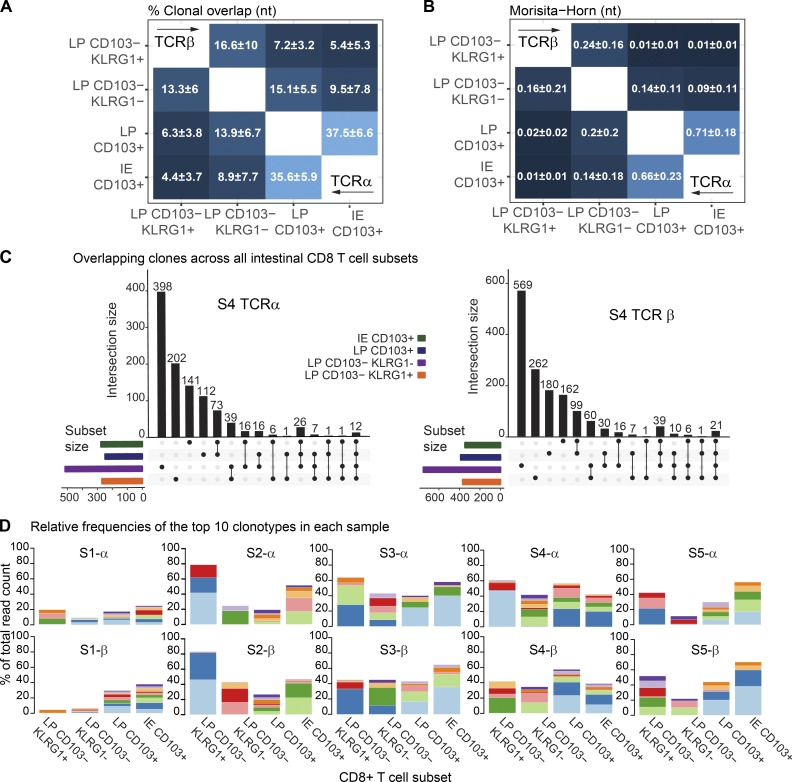
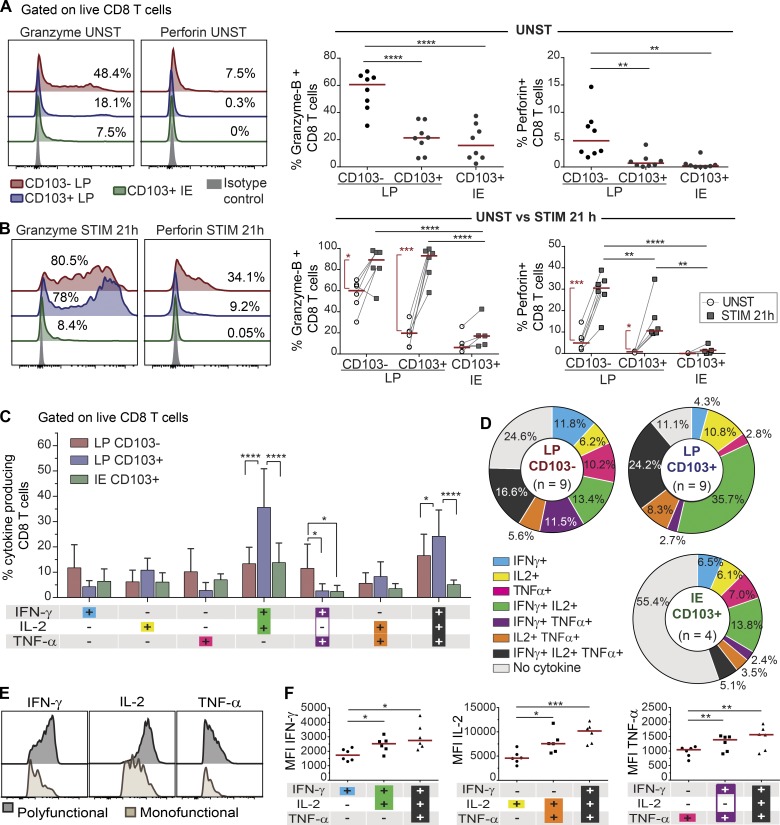
Resident memory CD8 T (Trm) cells have been shown to provide effective protective responses in the small intestine (SI) in mice. A better understanding of the generation and persistence of SI CD8 Trm cells in humans may have implications for intestinal immune-mediated diseases and vaccine development. Analyzing normal and transplanted human SI, we demonstrated that the majority of SI CD8 T cells were bona fide CD8 Trm cells that survived for >1 yr in the graft. Intraepithelial and lamina propria CD8 Trm cells showed a high clonal overlap and a repertoire dominated by expanded clones, conserved both spatially in the intestine and over time. Functionally, lamina propria CD8 Trm cells were potent cytokine producers, exhibiting a polyfunctional (IFN-γ+ IL-2+ TNF-α+) profile, and efficiently expressed cytotoxic mediators after stimulation. These results suggest that SI CD8 Trm cells could be relevant targets for future oral vaccines and therapeutic strategies for gut disorders.


Figures

None
Graphical abstract
Figure 1.
Figure 1.
Human SI mucosa harbors a substantial population of CD8 T cells with a Trm phenotype. (A) Representative confocal image of a tissue section from a male donor duodenum 1 yr after Tx into a female patient stained with X/Y chromosome fluorescent in situ hybridization probes (Y, green; X, red) and antibodies against CD8 (red) and CD3 (blue). Hoechst (gray) stains individual nuclei, and white arrows indicate donor (male) CD8 T cells (n = 8). Scale bar, 50 µm. (B) Expression of classic lymph node homing and memory markers on PB, LP, and IE CD8 T cells. Representative contour plots and compiled data for each marker are given. Tcm, central memory CD8 T cell; Tem, effector memory CD8 T cell; Tn, naive CD8 T cell. (C) t-SNE map showing the distribution of PB (red), LP (gray), and IE (green) CD8 T cell clusters (left). Overlay of the t-SNE map with expression levels for each marker, color-coded based on the median fluorescence intensity values, representative of three samples. See Fig. S2 A for details on preprocessing of flow data for t-SNE analysis. (D) Compiled data for the expression of CD69 and CD103 on PB, LP, and IE CD8 T cells. Black bars in B and D indicate mean values. Statistical analysis was performed using one-way ANOVA with Tukey’s multiple comparisons test. ns, not significant; **, P ≤ 0.01; ***, P ≤ 0.001; ****, P ≤ 0.0001.
Figure 2.
Figure 2.
LP and IE CD103+ CD8 T cells are phenotypically distinct from LP CD103 CD8 T cells in normal human SI. (A) Percentage of positive cells or median fluorescence intensity (MFI) values for various markers on LP CD103, LP CD103+, and IE CD103+ CD8 T cells in histologically normal SI. Representative histograms for all markers are given with color codes (left): LP CD103 (red), LP CD103+ (blue), IE CD103+ (green) CD8 T cells, and fluorescence minus one (fmo) control (gray). Black bars indicate mean values. (B) Representative contour plot (left) and fraction of LP CD103+ and CD103 CD8 T cells expressing KLRG1 (right, n = 54). Red bars indicate mean values. (C) Representative dot plot (left) and percentage of LP CD103+, LP CD103, and IE CD103+ CD8 T cells expressing Ki67 (right graph, n = 10). Black bars indicate median values. Statistical analysis was performed using one-way ANOVA for repeated measures with Tukey’s multiple comparisons test. ns, not significant; *, P ≤ 0.05; **, P ≤ 0.01; ***, P ≤ 0.001; ****, P ≤ 0.0001.
Figure 3.
Figure 3.
CD103+ CD8 T cells persist for ≥1 yr, while CD103 CD8 T cells are dynamically exchanged in transplanted SI. (A) Representative contour plots showing the percentage of donor and recipient LP CD103+, LP CD103, and IE CD103+ CD8 T cells in donor duodenum 52 wk after Tx (n = 14). (B) Percentage of donor cells in the LP CD103 (left, red), LP CD103+ (center, blue), and IE CD103+ (right, green) CD8 T cell subsets at 3 (n = 21), 6 (n = 18), and 52 wk after Tx (n = 14) as determined by HLA class I expression (as in A). Gray columns indicate median values. w, week. (C) Pearson correlation of percentages of donor-derived cells in KLRG1+ and KLRG1 CD103 CD8 T cell subsets in LP after Tx. Statistics performed using two-tailed P value (95% confidence interval, n = 33). (D) Distribution of recipient-derived CD8 T cells in the LP in different subsets according to the expression of KLRG1 and CD103, in donor (top) and native duodenum (bottom), before (0-Tx) and 3, 6, and 52 wk after Tx. One representative patient sample is shown (n = 33). (E) Compiled data for recipient CD8 T cell subset representation in native and donor duodenum before (w0-Tx) and after (w3-52) Tx. Mean with SD is shown. Statistical analysis was performed using two-way ANOVA with repeated measures across subsets and Tukey’s multiple comparisons test of CD103+ KLRG1 subset with time. ns, not significant; *, P ≤ 0.05; ****, P ≤ 0.0001.
Figure 4.
Figure 4.
Persisting clonotypes of CD103+ CD8 Trm cells are detected in SI samples 1 yr after Tx. (A) Clonotype overlap analysis by single-cell TCR-seq of donor CD103+ CD8 Trm cells derived from donor duodenum (Ptx#1- and Ptx#2-Donor) at baseline (w0, black) and 52 wk after Tx (w52, red) and of native CD103+ CD8 Trms from native duodenum (Ptx#2-Native). In italics (gray), number of unique clonotypes. Clonotype overlap was calculated as follows: % overlap(X,Y) = [(|XY|)/(|X| or |Y|)] × 100, where X represents the total clonotypes at week 0 (% in black), and Y represents the total clonotypes at week 52 (% in red). w, week. (B) Frequency (freq.) distribution of LP CD103+ CD8 Trm clonotypes at baseline (w0, black line) and 1 yr after Tx (w52, red line). Clonotype index is ordered by decreasing clonotype size. (C) Clonal dominance and preferential TRAV/TRBV pairing. Each slice of the column represents a different TRAV/TRBV pair, and the number of cells expressing them is shown (for more than one cell). Unique and overlapping TRAV/TRBV clones are shown separately. (D) Clonotype overlap analysis of total TCRβ clonotypes in the same samples as described in A. (E) Correlation of the TCRβ clonotypes found at baseline (w0) and 1 yr after Tx (w52). The samples are color-coded, and clonal size is represented by circle size. M-H, Morisita–Horn index.
Figure 5.
Figure 5.
High clonal overlap between IE and LP CD103+ CD8 T cells. (A and B) Mean percentage of clonal overlap (A) and Morisita–Horn similarity indexes (B) applied to all the pairwise combinations of CD8 T cell subsets for TCRα (right corner) and TCRβ clonotypes (left corner) derived from normal SI (n = 5). The Morisita–Horn index ranges from 0 (no similarity) to 1 (identical). (C) Overlapping clones among the different intestinal CD8 T cell subsets for TCRα and TCRβ in one representative sample (n = 5). Intersections are represented below the x axis (black circles), the number of overlapping clonotypes is represented on the histogram, and the total amounts of clonotypes per subset are represented as color-coded horizontal bars. (D) Size of the read counts for the 10 most expanded clonotypes relative to the total reads in each subset. Shared clones are represented with the same color within the same sample (S) and TCR chain.
Figure 6.
Figure 6.
SI CD8 T cell subsets produce different levels of cytokines and cytotoxic molecules in response to activation. (A and B) Representative flow-cytometric histogram (left) and compiled data (right, n = 8) for the intracellular expression of granzyme-B and perforin in CD8 T cell subsets without (A; UNST) and after (B; STIM) stimulation with anti-CD3/CD28 beads for 21 h (n = 6). Red lines indicate median values. (C) Flow-cytometric analysis of PMA/ionomycin-induced cytokine production by LP CD103, LP CD103+, and IE CD103+ CD8 T cells. The mean percentages of cytokine-producing cells with SD are given by bars. (D) Relative representation of specific cytokine production profiles for LP CD103 (n = 9), LP CD103+ (n = 9), and IE CD103+ (n = 4) CD8 T cells are represented on pie charts with color codes (C). Mean values of indicated experiments. (E and F) Representative histograms (E) and compiled median fluorescence intensity (MFI; F) values for single, dual, and triple cytokine-producing CD8 T cells (n = 6). Red lines indicate median values. Statistical analysis was performed using one-way (A and F) and two-way (B and C) repeated-measures ANOVA with Tukey’s multiple comparisons test. For CD3/CD28 stimulation in B, Student’s t test was applied to compare unstimulated and stimulated cells (red vertical lines and asterisks). *, P ≤ 0.05; **, P ≤ 0.01; ***, P ≤ 0.001; ****, P ≤ 0.0001. Red horizontal lines on graphs represent median values.

References

    1. Abadie V., Discepolo V., and Jabri B.. 2012. Intraepithelial lymphocytes in celiac disease immunopathology. Semin. Immunopathol. 34:551–566. 10.1007/s00281-012-0316-x - DOI - PubMed
    1. Alamyar E., Duroux P., Lefranc M.P., and Giudicelli V.. 2012. IMGT(®) tools for the nucleotide analysis of immunoglobulin (IG) and T cell receptor (TR) V-(D)-J repertoires, polymorphisms, and IG mutations: IMGT/V-QUEST and IMGT/HighV-QUEST for NGS. Methods Mol. Biol. 882:569–604. 10.1007/978-1-61779-842-9_32 - DOI - PubMed
    1. Ariotti S., Hogenbirk M.A., Dijkgraaf F.E., Visser L.L., Hoekstra M.E., Song J.Y., Jacobs H., Haanen J.B., and Schumacher T.N.. 2014. T cell memory. Skin-resident memory CD8+ T cells trigger a state of tissue-wide pathogen alert. Science. 346:101–105. 10.1126/science.1254803 - DOI - PubMed
    1. Bankhead P., Loughrey M.B., Fernández J.A., Dombrowski Y., McArt D.G., Dunne P.D., McQuaid S., Gray R.T., Murray L.J., Coleman H.G., et al. . 2017. QuPath: Open source software for digital pathology image analysis. Sci. Rep. 7:16878 10.1038/s41598-017-17204-5 - DOI - PMC - PubMed
    1. Bergsbaken T., and Bevan M.J.. 2015. Proinflammatory microenvironments within the intestine regulate the differentiation of tissue-resident CD8+ T cells responding to infection. Nat. Immunol. 16:406–414. 10.1038/ni.3108 - DOI - PMC - PubMed

Publication types

MeSH terms