. 2019 Jul 23;10(1):3069.
doi: 10.1038/s41467-019-10933-3.

Estimating the success of re-identifications in incomplete datasets using generative models

Affiliations

Estimating the success of re-identifications in incomplete datasets using generative models

Luc Rocher et al. Nat Commun. .

Abstract

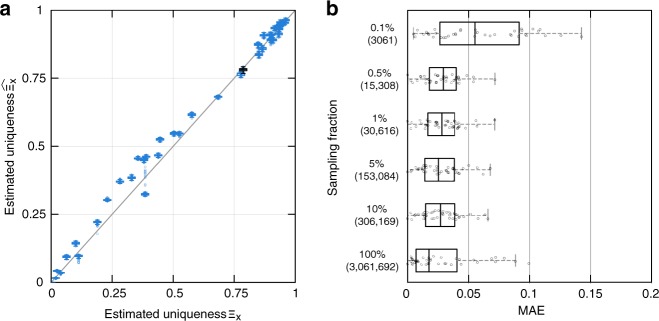
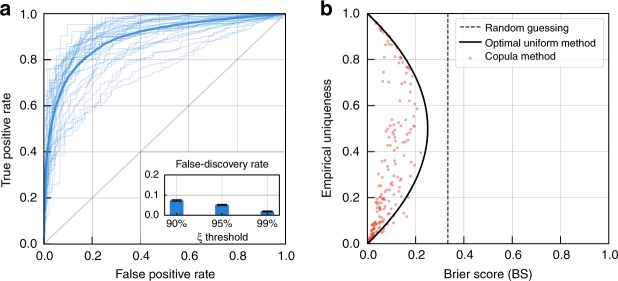
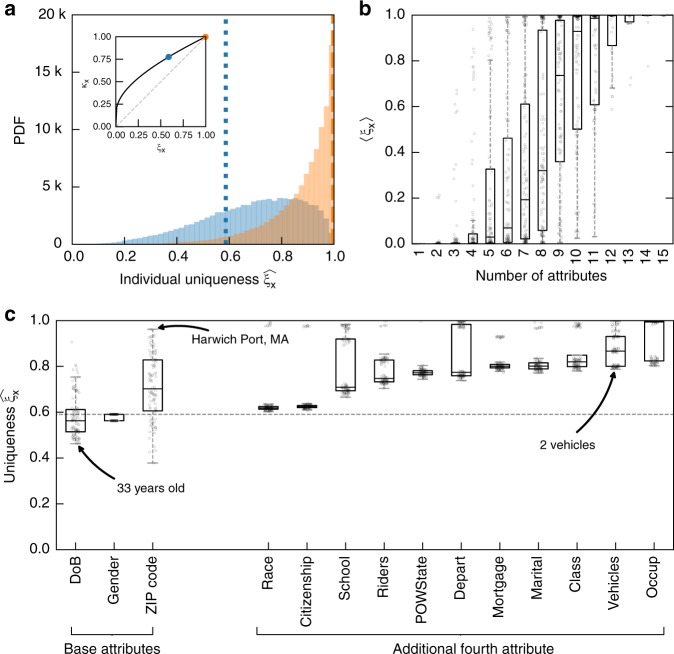
While rich medical, behavioral, and socio-demographic data are key to modern data-driven research, their collection and use raise legitimate privacy concerns. Anonymizing datasets through de-identification and sampling before sharing them has been the main tool used to address those concerns. We here propose a generative copula-based method that can accurately estimate the likelihood of a specific person to be correctly re-identified, even in a heavily incomplete dataset. On 210 populations, our method obtains AUC scores for predicting individual uniqueness ranging from 0.84 to 0.97, with low false-discovery rate. Using our model, we find that 99.98% of Americans would be correctly re-identified in any dataset using 15 demographic attributes. Our results suggest that even heavily sampled anonymized datasets are unlikely to satisfy the modern standards for anonymization set forth by GDPR and seriously challenge the technical and legal adequacy of the de-identification release-and-forget model.


Conflict of interest statement

The authors declare no competing interests.

Figures

Fig. 1
Fig. 1
Estimating the population uniqueness of the USA corpus. a We compare, for each population, empirical and estimated population uniqueness (boxplot with median, 25th and 75th percentiles, maximum 1.5 interquartile range (IQR) for each population, with 100 independent trials per population). For example, date of birth, location (PUMA code), marital status, and gender uniquely identify 78.7% of the 3 million people in this population (empirical uniqueness) that our model estimates to be 78.2 ± 0.5% (boxplot in black). b Absolute error when estimating USA’s population uniqueness when the disclosed dataset is randomly sampled from 10% to 0.1%. The boxplots (25, 50, and 75th percentiles, 1.5 IQR) show the distribution of mean absolute error (MAE) for population uniqueness, at one subsampling fraction across all USA populations (100 trials per population and sampling fraction). The y axis shows both p, the sampling fraction, and nS=p×n, the sample size. Our model estimates population uniqueness very well for all sampling fractions with the MAE slightly increasing when only a very small number of records are available (p = 0.1% or 3061 records)
Fig. 2
Fig. 2
The model predicts correct re-identifications with high confidence. a Receiver operating characteristic (ROC) curves for USA populations (light ROC curve for each population and a solid line for the average ROC curve). Our method accurately predicts the (binary) individual uniqueness. (Inset) False-discovery rate (FDR) for individual records classified with ξ > 0.9, ξ > 0.95, and ξ > 0.99. For re-identifications that the model predicts are likely to be correct (ξx ^>0.95), only 5.26% of them are incorrect (FDR). b Our model outperforms by 39% the best theoretically achievable prediction using population uniqueness across every corpus. A red point shows the Brier Score obtained by our model, when trained on a 1% sample. The solid line represents the lowest Brier Score achievable when using the exact population uniqueness while the dashed line represents the Brier Score of a random guess prediction (BS = 1/3)
Fig. 3
Fig. 3
Average individual uniqueness increases fast with the number of collected demographic attributes. a Distribution of predicted individual uniqueness knowing ZIP code, date of birth, and gender (resp. ZIP code, date of birth, gender, and number of children) in blue (resp. orange). The dotted blue line at ξx ^=0.580 (resp. dashed orange line at ξx ^=0.997) illustrates the predicted individual uniqueness of Gov. Weld knowing the same combination of attributes. (Inset) The correctness κx is solely determined by uniqueness ξx and population size n (here for Massachusetts). We show individual uniqueness and correctness for William Weld with three (in blue) and four (in orange) attributes. b The boxplots (25, 50, and 75th percentiles, 1.5 IQR) show the average uniqueness 〈ξx〉 knowing k demographic attributes, grouped by number of attributes. The individual uniqueness scores ξx are estimated on the complete population in Massachusetts, based on the 5% Public Use Microdata Sample files. While few attributes might not be sufficient for a re-identification to be correct, collecting a few more attributes will quickly render the re-identification very likely to be successful. For instance, 15 demographic attributes would render 99.98% of people in Massachusetts unique. c Uniqueness varies with the specific value of attributes. For instance, a 33-year-old is less unique than a 58-year-old person. We here either (i) randomly replace the value of one baseline attribute (ZIP code, date of birth, or gender) or (ii) add one extra attribute, both by sampling from its marginal distribution, to the uniqueness of a 58-year-old male from Cambridge, MA. The dashed baseline shows his original uniqueness ξx ^=0.580 and the boxplots the distribution of individual uniqueness obtained after randomly replacing or adding one attribute. A complete description of the attributes and method is available in Supplementary Methods

Comment in

References

    1. Poushter, J. Smartphone ownership and internet usage continues to climb in emerging economies (Pew Research Center, Washington, DC, 2016). http://www.pewglobal.org/2016/02/22/smartphone-ownership-and-internet-us....
    1. Yang, N. & Hing, E. National electronic health records survey. https://cdc.gov/nchs/data/ahcd/nehrs/2015_nehrs_ehr_by_specialty.pdf (2015).
    1. Murdoch TB, Detsky AS. The inevitable application of big data to health care. JAMA. 2013;309:1351–1352. doi: 10.1001/jama.2013.393. - DOI - PubMed
    1. Wyber R, et al. Big data in global health: improving health in low- and middle-income countries. Bull. World Health Organ. 2015;93:203–208. doi: 10.2471/BLT.14.139022. - DOI - PMC - PubMed
    1. Lazer D, et al. Life in the network: the coming age of computational social science. Science. 2009;323:721. doi: 10.1126/science.1167742. - DOI - PMC - PubMed

Publication types