. 2019 Jul 11:47:42.
doi: 10.1186/s41182-019-0171-8. eCollection 2019.

Evaluation of the inhibitory effect of ivermectin on the growth of Babesia and Theileria parasites in vitro and in vivo

Affiliations

Evaluation of the inhibitory effect of ivermectin on the growth of Babesia and Theileria parasites in vitro and in vivo

Gaber El-Saber Batiha et al. Trop Med Health. .

Abstract

Background: Treatment is the principle way to control and eliminate piroplasmosis. The search for new chemotherapy against Babesia and Theileria has become increasingly urgent due to parasite resistance to current drugs. Ivermectin (IVM) was the world's first endectocide, capable of killing a wide variety of parasites and vectors, both inside and outside the body. It is currently authorized to treat onchocerciasis, lymphatic filariasis, strongyloidiasis, and scabies. The current study documented the efficacy of IVM on the growth of Babesia and Theileria in vitro and in vivo.

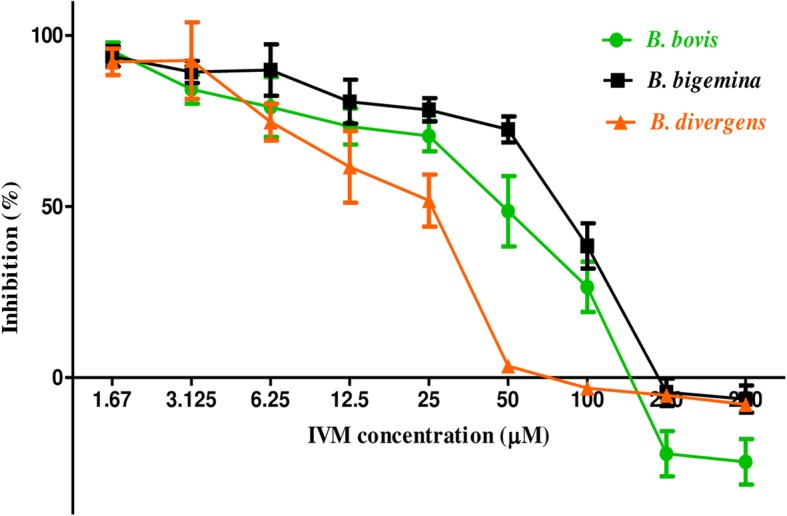
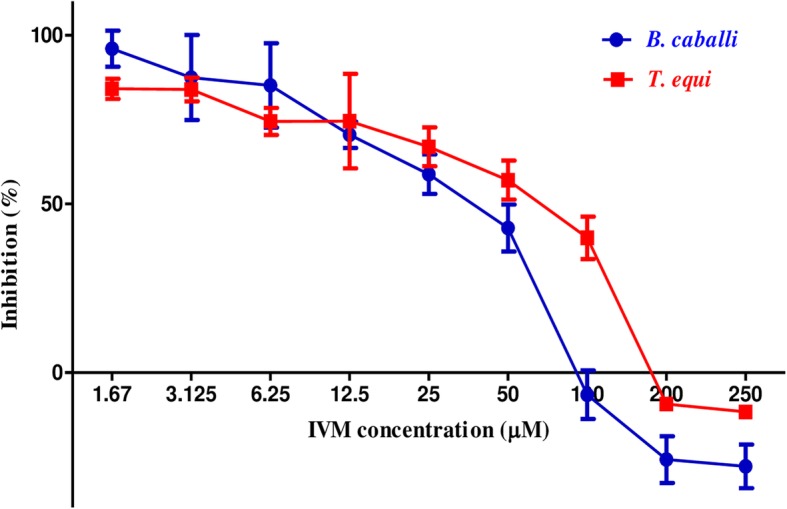
Methods: The fluorescence-based assay was used for evaluating the inhibitory effect of IVM on four Babesia species, including B. bovis, B. bigemina, B. divergens, B. caballi, and Theileria equi, the combination with diminazene aceturate (DA), clofazimine (CF), and atovaquone (AQ) on in vitro cultures, and on the multiplication of a B. microti-infected mouse model. The cytotoxicity of compounds was tested on Madin-Darby bovine kidney (MDBK), mouse embryonic fibroblast (NIH/3 T3), and human foreskin fibroblast (HFF) cell lines.

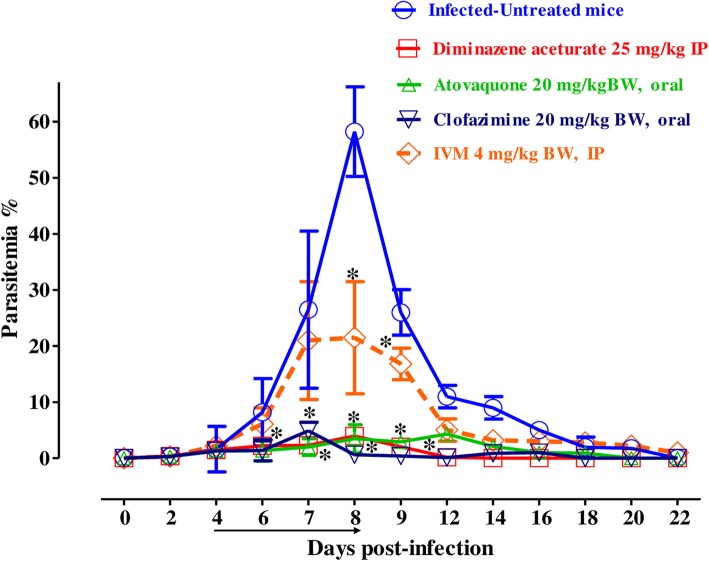
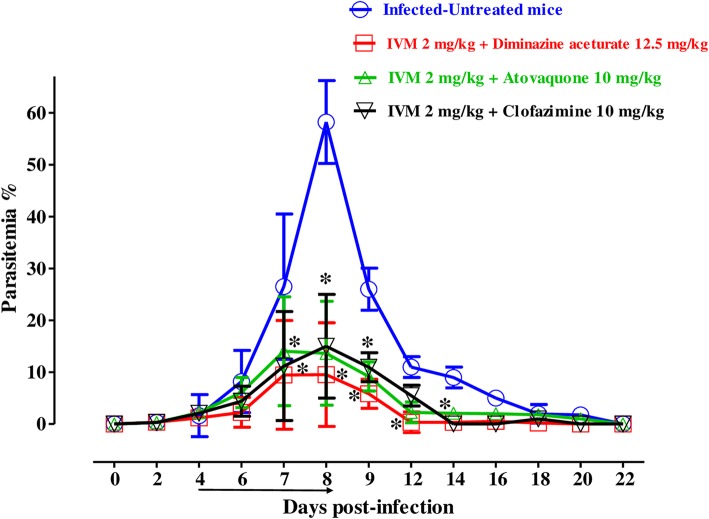
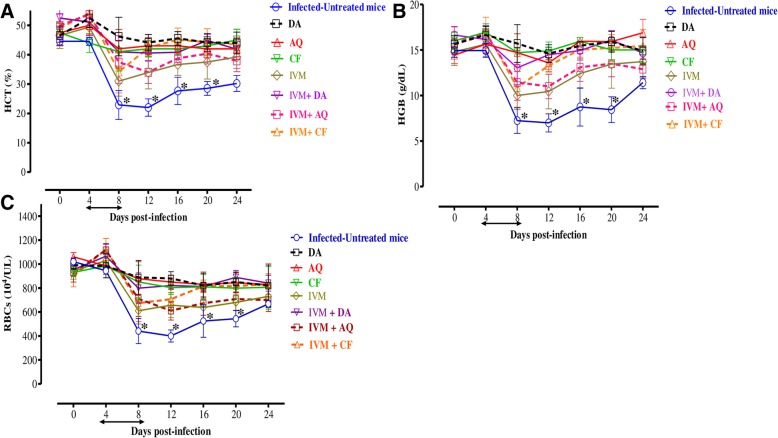
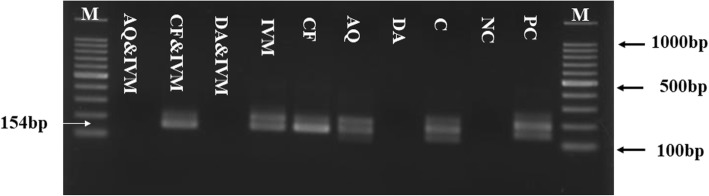
Results: The half-maximal inhibitory concentration (IC50) values determined for IVM against B. bovis, B. bigemina, B. divergens, B. caballi, and T. equi were 53.3 ± 4.8, 98.6 ± 5.7, 30.1 ± 2.2, 43.7 ± 3.7, and 90.1 ± 8.1 μM, respectively. Toxicity assays on MDBK, NIH/3 T3, and HFF cell lines showed that IVM affected the viability of cells with a half-maximal effective concentration (EC50) of 138.9 ± 4.9, 283.8 ± 3.6, and 287.5 ± 7.6 μM, respectively. In the in vivo experiment, IVM, when administered intraperitoneally at 4 mg/kg, significantly (p < 0.05) inhibited the growth of B. microti in mice by 63%. Furthermore, combination therapies of IVM-DA, IVM-AQ, and IVM-CF at a half dose reduced the peak parasitemia of B. microti by 83.7%, 76.5%, and 74.4%, respectively. Moreover, this study confirmed the absence of B. microti DNA in groups treated with combination chemotherapy of IVM + DA and IVM + AQ 49 days after infection.

Conclusions: These findings suggest that IVM has the potential to be an alternative remedy for treating piroplasmosis.

Keywords: Babesia; In vitro; In vivo; Ivermectin; Theileria.


Conflict of interest statement

Competing interestsThe authors declare that they have no competing interests.

Figures

Fig. 1
Fig. 1
The dose-response curves of ivermectin against bovine Babesia parasites in vitro. The curve shows the correlation between relative fluorescence units (RFUs) and the log concentrations of IVM (μM) in B. bovis, B. bigemina, and B. divergens treated with various concentrations of IVM. The result was determined by fluorescence assay after 96 h of incubation. The values obtained from three separate trials were used to determine the IC50s using nonlinear regression (curve fitting analysis) in GraphPadPrism software
Fig. 2
Fig. 2
The dose-response curves of ivermectin against equine piroplasm parasites in vitro. The curve shows the correlation between relative fluorescence units (RFUs) and the log concentrations of IVM (μM) in B. caballi and T. equi treated with various concentrations of IVM. The result was determined by fluorescence assay after 96 h of incubation. The values obtained from three separate trials were used to determine the IC50s using nonlinear regression (curve fitting analysis) in GraphPadPrism software
Fig. 3
Fig. 3
The growth inhibition of IVM on B. microti in vivo. Graph showing the inhibitory effects of DA-IP, AQ-oral, CF-oral, IVM-IP treatment as compared to the untreated group. The values plotted indicate the mean ± standard deviation for two separate experiments. Asterisks (*) indicate statistical significance (p < 0.05) based on one-way ANOVA Tukey’s test using GraphPad Prism version 5.0 for Windows (GraphPad Software Inc., San Diego, CA, USA). The arrow indicates five consecutive days of treatment. Parasitemia was calculated by counting infected RBCs among 2000 RBCs using Giemsa-stained thin blood smears
Fig. 4
Fig. 4
The growth inhibition of IVM combinations on B. microti in vivo. The graph shows the inhibitory effects of DA, AQ, and CF combined with IVM treatments as compared with the untreated group. The values plotted indicate the mean ± standard deviation for two separate experiments. The asterisks (*) indicate statistical significance (p < 0.05) based on one-way ANOVA Tukey’s test using GraphPad Prism version 5.0 for Windows (GraphPad Software Inc., San Diego, CA, USA). The arrow indicates five consecutive days of treatment. Parasitemia was calculated by counting infected RBCs among 2000 RBCs using Giemsa-stained thin blood smears
Fig. 5
Fig. 5
Changes in the hematocrit count (a), hemoglobin percentage (b), and red blood cell count (c) in IVM-treated mice in vivo. The graphs show changes in the hematocrit count (a), hemoglobin percentage (b), and red blood cell count (c) of mice treated as compared with untreated mice. The different groups used were DA-IP, AQ-oral, CF-oral, IVM-IP, IVM-DA, IVM-AQ, IVM-CF, and untreated mice. The values plotted are the mean ± standard deviation for two separate trials. Each group contained five mice. Asterisks (*) indicate statistical significance (p < 0.05) based on one-way ANOVA Tukey’s test using GraphPad Prism version 5.0 for Windows (GraphPad Software Inc., San Diego, CA, USA). The arrow indicates five consecutive days of treatment
Fig. 6
Fig. 6
Molecular detection of parasite DNA in the treated groups. The image shows the molecular detection of parasites in the blood of treated groups on day 49. M is for the marker, NC is for the untreated-uninfected group that was used as a negative control, PC is for the untreated-infected group which used as the positive control, and C is for B. microti DNA control. The arrow shows the expected band length of 154 bp for positive cases of B. microti. The double bands observed with some of the positive controls represent amplicons of the first and second PCR. While a single band was observed in other groups due to the lower parasite DNA concentration

References

    1. Hamoda AF, Radwan M, Rashed R, Amin A. Toxic effect of babesiosis in cattle and chemotherapiotic treatment in Egypt. Am J Infect Dis Microbiol. 2014;2:91–96.
    1. Zintl A, Mulcahy G, Skerrett HE, Taylor SM, Gray JS. Babesia divergens, a bovine blood parasite of veterinary and zoonotic importance. Clin Microbiol Rev. 2003;16:622–636. doi: 10.1128/CMR.16.4.622-636.2003. - DOI - PMC - PubMed
    1. Wise LN, Pelzel-McCluskey AM, Mealey RH, Knowles DP. Equine piroplasmosis. Vet Clin North Am Equine Pract. 2014;30:677–693. doi: 10.1016/j.cveq.2014.08.008. - DOI - PubMed
    1. Krause PJ, McKay K, Gadbaw J, Christianson D, Closter L, Lepore T, et al. Increasing health burden of human babesiosis in endemic sites. Am J Trop Med Hyg. 2003;68:431–436. doi: 10.4269/ajtmh.2003.68.431. - DOI - PubMed
    1. VOS ALBERTUS J., BOCK RUSSELL E. Vaccination against Bovine Babesiosis. Annals of the New York Academy of Sciences. 2006;916(1):540–545. doi: 10.1111/j.1749-6632.2000.tb05333.x. - DOI - PubMed

LinkOut - more resources