. 2019 Jun 2;15(7):1472-1487.
doi: 10.7150/ijbs.33817. eCollection 2019.

Hypericin maintians PDX1 expression via the Erk pathway and protects islet β-cells against glucotoxicity and lipotoxicity

Affiliations

Hypericin maintians PDX1 expression via the Erk pathway and protects islet β-cells against glucotoxicity and lipotoxicity

Chen Liang et al. Int J Biol Sci. .

Abstract

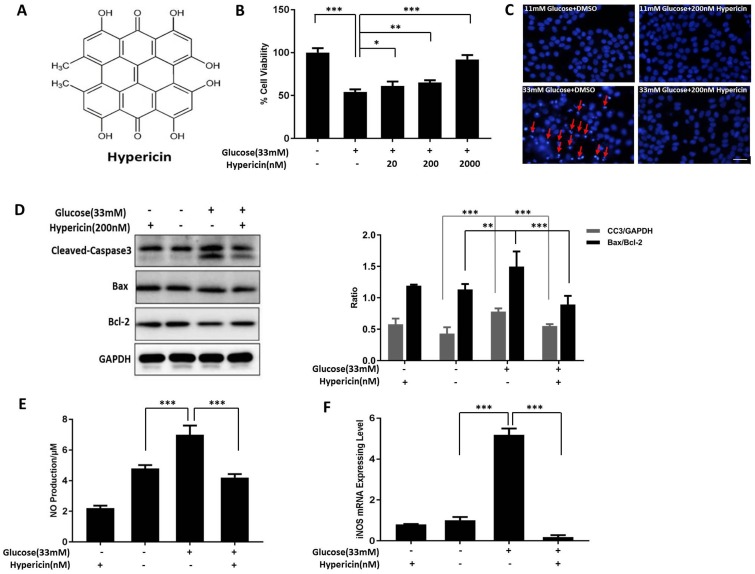
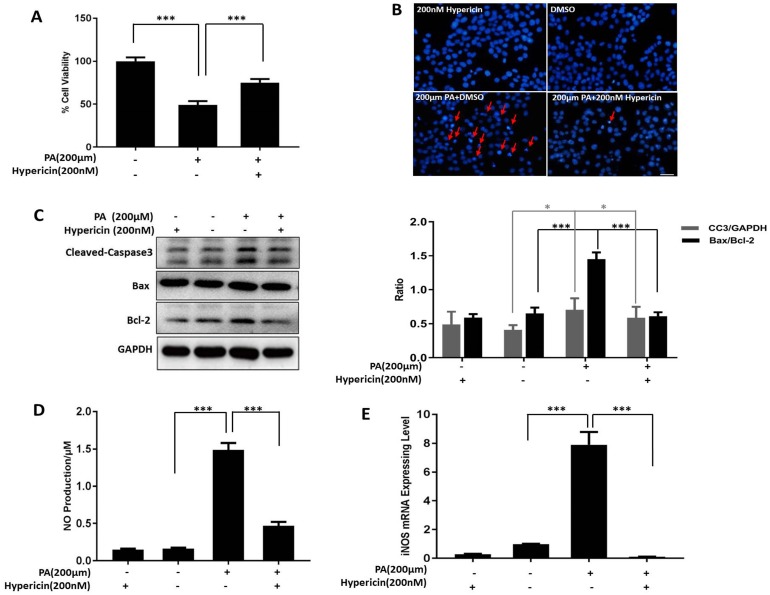
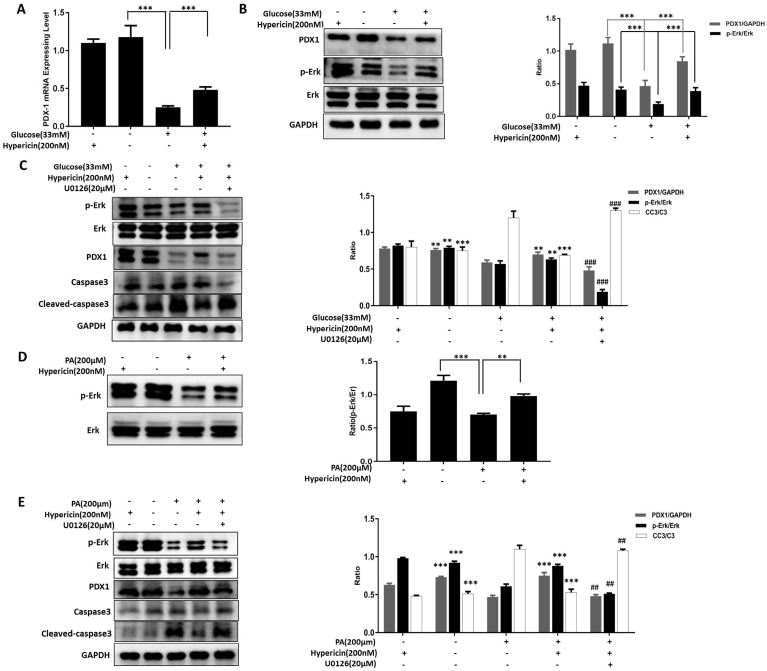
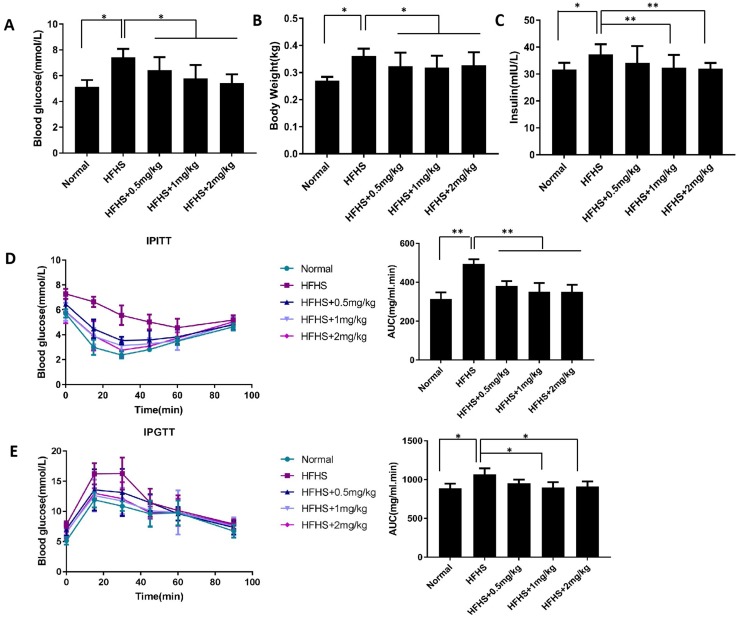
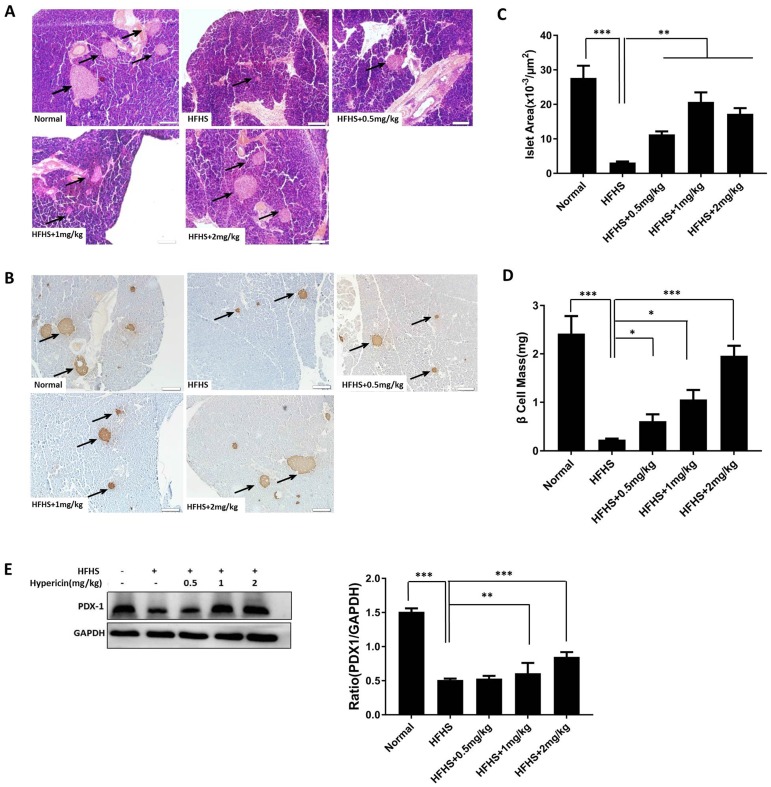
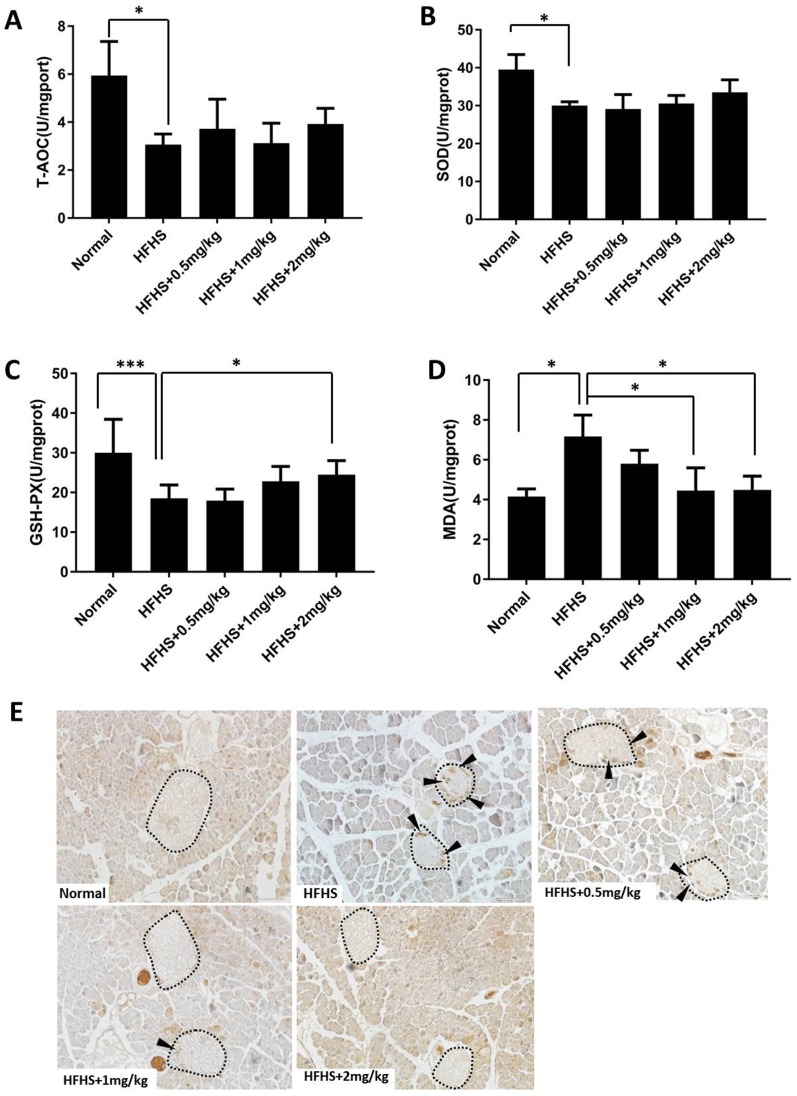
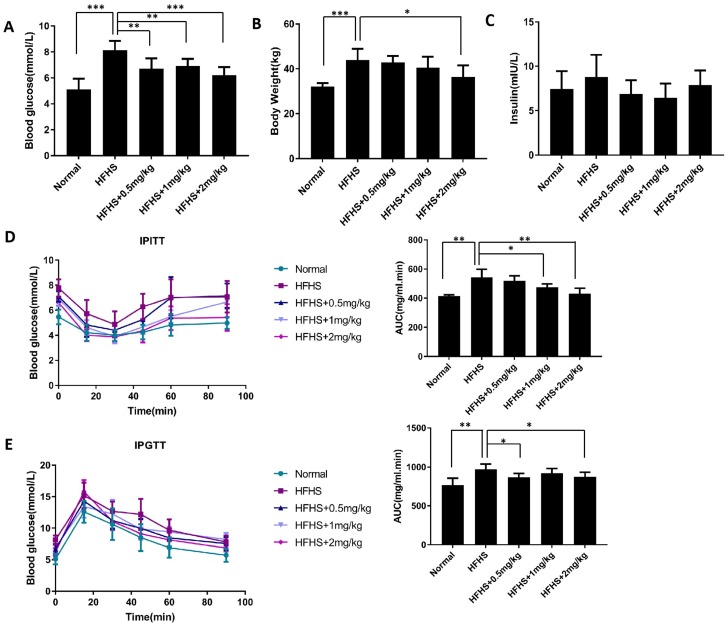
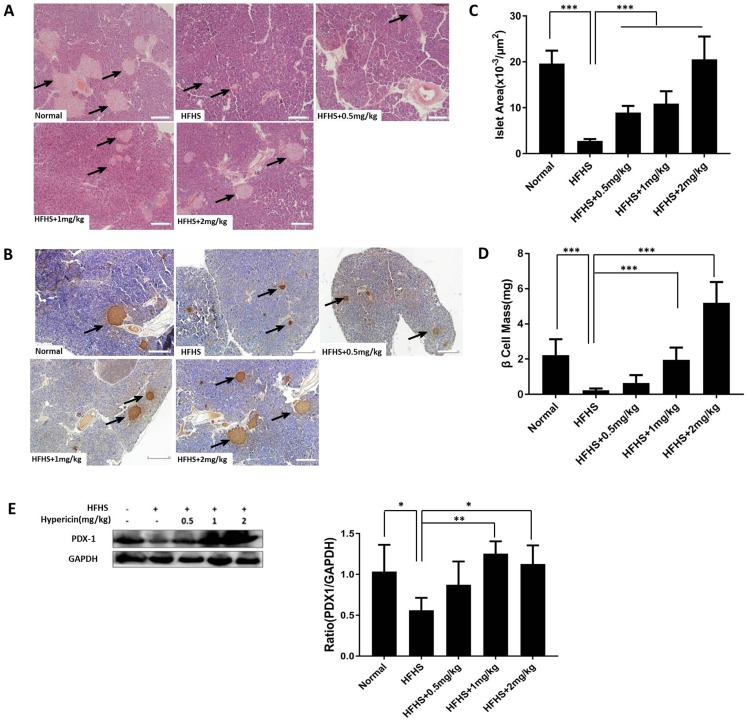
A decrease in islet β-cell mass is closely associated with the development and progression of diabetes. Therefore, protection against β-cell loss is an essential measure to prevent and treat diabetes. In this study, we investigated the protective effects of non-photoactivated hypericin, a natural compound, on β-cells both in vitro and in vivo. In vitro, hypericin greatly improved INS-1 cell viability under high-glucose and high-fatty-acid conditions by inhibiting glucotoxicity- and lipotoxicity-induced apoptosis and nitric oxide (NO) production. Then, we further demonstrated that hypericin elicited its protective effects against glucotoxicity and lipotoxicity in INS-1 cells by attenuating the reduction in pancreatic duodenal homeobox-1 (PDX1) expression and Erk activity. In vivo, prophylactic or therapeutic use of hypericin inhibited islet β-cell apoptosis and enhanced the anti-oxidative ability of pancreatic tissue in high-fat/high-sucrose (HFHS)-fed mice, thus alleviating β-cell loss and maintaining or improving β-cell mass and islet size. More importantly, hypericin treatment decreased fasting blood glucose, improved glucose intolerance and insulin intolerance, and alleviated hyperinsulinaemia in HFHS-fed mice. Therefore, hypericin showed preventive and therapeutic effects against HFHS-induced onset of type II diabetes in mice. Hypericin possesses great potential for development as an anti-diabetes drug in the future.

Keywords: Hypericin; apoptosis; diabetes; β-cell protection.


Conflict of interest statement

Competing Interests: The authors have declared that no competing interest exists.

Figures

Figure 1
Figure 1
Hypericin inhibits apoptosis and NO production in INS-1 cells under high-glucose toxicity. (A) Chemical structure of hypericin. (B) Measurement of cell viability by an MTT assay. INS-1 cells were treated with 33 mM glucose in the absence or presence of hypericin (20, 200, and 2000 nM) for 72 h and then subjected to the MTT assay. INS-1 cells treated with 11 mM glucose were used as the control. Data are presented as the mean ± S.D. (n = 3). (C) Detection of apoptotic bodies by DAPI staining. INS-1 cells were treated with 33 mM glucose, 200 nM hypericin or a combination of the two for 72 h. The cells were then stained with DAPI and observed under a fluorescence microscope. Arrows indicate the apoptotic bodies. Scale bar 50 μm. The results are representative of three independent experiments. (D) Detection of apoptosis-related proteins by Western blot. INS-1 cells were treated as in (C). Then, the protein levels of cleaved-caspase-3, Bax and Bcl-2 were determined by Western blot; GAPDH was used as a loading control. Density ratios of CC3 to GAPDH or Bax to Bcl-2 as measured with ImageJ are shown in the two right-hand panels. The experiment was repeated three times. (E) Detection of NO production. INS-1 cells were treated as in (C). Production of NO was detected by the Griess reaction in culture medium. Data are presented as the mean ± S.D. (n = 3). (F) Detection of iNOS mRNA levels by RT-qPCR. INS-1 cells were treated as in (E), after which total RNA was extracted and iNOS mRNA was amplified by conventional SYBR Green real-time PCR analysis. Data are presented as the mean ± S.D. (n = 3). NO, nitric oxide; iNOS, inducible nitric oxide synthase; MTT, 3-(4,5-dimethylthiazol-2-yl)-2,5-diphenyltetrazolium bromide; DAPI, 4',6-diamidino-2-phenylindole; Bax, Bcl-2-Associated X protein; Bcl-2, B-cell lymphoma-2. Experiments were repeated three times. * p<0.05; ** p<0.01; *** p<0.001 versus the high-glucose group.
Figure 2
Figure 2
Hypericin inhibits apoptosis and NO production in INS-1 cells under high-lipid toxicity. (A) INS-1 cells were treated with 200 μM PA, 200 nM hypericin or a combination of the two for 24 h. Then, cell viability (B), apoptotic bodies (C), apoptosis-related proteins (D), NO production (E) and iNOS mRNA (F) were detected or analysed as in Fig. 1. *p<0.05, ***p < 0.001 versus the PA-treated group. PA, palmitic acid.
Figure 3
Figure 3
Hypericin protects INS-1 cells from glucotoxicity and lipotoxicity via Erk signaling and maintianing PDX1 expression. (A) Effects of hypericin on the PDX1 mRNA level in INS-1 cells under glucotoxicity. INS-1 cells were treated with high (33 mM) glucose, 200 nM hypericin or a combination of the two for 72 h. Total RNA was extracted, and PDX1 mRNA was amplified by conventional SYBR Green real-time PCR analysis. Data are presented as the mean ± S.D. (n = 3). (B) Effects of hypericin on the protein levels of PDX1, Erk1/2 and p-Erk in INS-1 cells under glucotoxicity. INS-1 cells were treated as in (A). Cell lysates were prepared and subjected to Western blots using the indicated antibodies. GAPDH was used as a loading control. The density ratios of PDX1 to GAPDH or p-Erk to Erk were measured by ImageJ as shown in the right panel. The experiment was repeated three times. *** p<0.001 versus the 33 mM glucose-treated group. (C) Blockade of hypericin-mediated effects by U0126 in INS-1 cells under glucotoxicity. INS-1 cells were treated with different combinations of high (33 mM) glucose, 200 nM hypericin and U0126 as indicated for 72 h. Then, target proteins were detected by Western blot using the indicated antibodies. GAPDH was used as a loading control. The density ratios of PDX1 to GAPDH, p-Erk to Erk or CC3 to GAPDH were measured by ImageJ as shown in the right-hand panel. The experiment was repeated three times. **p<0.01, ***p<0.001 versus the 33 mM glucose-treated group; ##p<0.01, ###p<0.001 versus the 33 mM glucose+200 nM hypericin-treated group. (D) Effects of hypericin on the Erk pathway in INS-1 cells under lipotoxicity. INS-1 cells were treated with 200 μM PA, 200 nM hypericin or a combination of the two for 24 h. Cell lysates were prepared and subjected to Western blots using anti-Erk and anti-p-Erk antibodies. GAPDH was used as a loading control. The density ratios of p-Erk to Erk were measured by ImageJ as shown in the right panel. The experiment was repeated three times. **p<0.01, *** p<0.001 versus the 200 μM PA-treated group. (E) Blockade of hypericin-mediated effects by U0126 in INS-1 cells under lipotoxicity. INS-1 cells were treated with different combinations of 200 μM PA, 200 nM hypericin and U0126 as indicated for 24 h. Then, target proteins were detected and analysed as in (c). *** p<0.001 versus the 200 μM PA-treated group; ## p<0.01 versus the 200 μM PA+200 nM hypericin-treated group.
Figure 4
Figure 4
Prophylactic use of hypericin ameliorates diabetic phenotypes in HFHS-fed mice. (A) Fasting blood glucose levels of mice. After 1 month on an HFHS diet, mice were injected i.p. with hypericin or 0.9% NaCl (HFHS control) every other day for nearly three months. After 8 h of fasting, blood samples collected from the tip of the tail were used to measure blood glucose levels. Mice that were fed a normal diet and injected with 0.9% NaCl were used as the normal control. Data are presented as the mean ± S.D. (n = 8). (B) Body weight of mice. Before sacrifice of the mice in (A), their body weights were recorded. Data are presented as the mean ± S.D. (n = 8). (C) Blood insulin levels of mice. Insulin levels were determined by ELISA in venous blood from the mice in (A). Data are presented as the mean ± S.D. (n = 6). (D) IPITT. After 8 h of fasting, mice in (A) received an i.p. administration of 0.5 IU/kg insulin in 0.9% NaCl, and their blood glucose was measured as in (a) before (0 min) and 15, 30, 45, 60 and 90 min after the treatment. The AUC was calculated and is shown in the right-hand panel. Data are presented as the mean ± S.D. (n = 6). (E) IPGTT. The experiment was conducted as in (C), but 2 g/kg glucose instead of insulin was injected intraperitoneally; *p<0.05, **p<0.01 versus the HFHS group. HFHS, high-fat/high-sucrose; IPGTT, intraperitoneal glucose tolerance test; IPITT, intraperitoneal insulin tolerance test; AUC, area under the glucose excursion curve.
Figure 5
Figure 5
Prophylactic use of hypericin decreases β-cell loss and maintains islet mass in HFHS-fed mice. (A) Histological sections of mouse pancreatic tissue. After sacrifice, the mouse pancreases were removed and weighed. Portions of the mouse pancreases from (A) were fixed and subjected to HE staining. The scale bar represents 100 μm. Arrows indicate pancreatic islets. (B) IHC analysis of the mouse pancreas using anti-C-peptide antibodies. Portions of the mouse pancreases from (A) were fixed and subjected to IHC analysis. The scale bar represents 100 μm. Arrows indicate positively stained cells. (C) Measurement of islet area in the mouse pancreas. Pancreatic sections subjected to IHC staining with an anti-C-peptide antibody in (B) were used to measure the islet area of the pancreas. Data are presented as the mean ± S.D. (n = 8). (D) Calculation of β-cell mass of the pancreas. Pancreatic sections that were IHC stained with an anti-C-peptide antibody in (B) were used to calculate the β-cell mass of the pancreas. Data are presented as the mean ± S.D. (n = 8). (E) PDX1 protein levels in the mouse pancreas. Portions of the mouse pancreases from (A) were homogenized, and total cellular lysates were prepared and subjected to Western blots using anti-PDX1 antibodies. GAPDH was used as a loading control. The density ratios of PDX1 to GAPDH were measured by ImageJ, and the fold change relative to the normal group is shown in the right-hand panel. Data are presented as the mean ± S.D. (n = 6). * p< 0.05, **p<0.01, ***p<0.001 versus the HFHS group.
Figure 6
Figure 6
Prophylactic use of hypericin enhances the anti-oxidative ability of the pancreas and blocks islet β-cell apoptosis in HFHS-fed mice. (A-D) Assessment of anti-oxidative function in the mouse pancreas. Portions of the mouse pancreases from Fig. 5A were homogenized, and the homogenate supernatant was collected to measure T-AOC (A), SOD (B) and GSH-PX activity (C), and MDA content (D). Data are presented as the mean ± S.D. (n=6). *p<0.05, ***p<0.001 versus the HFHS group. (E) IHC staining of the mouse pancreas with the anti-CC3 antibody. Portions of the mouse pancreases from Fig. 5A were fixed and subjected to IHC analysis. The scale bar represents 50 μm. Islets are circled with dashed lines. Cells positive for CC3 are indicated by arrowheads.
Figure 7
Figure 7
Therapeutic use of hypericin improves the diabetic phenotype of HFHS-fed mice. (A-E) After 4 months on an HFHS, mice were injected intraperitoneally with hypericin or 0.9% NaCl (HFHS control) every other day for nearly one month. The fasting blood glucose levels (A), body weight (B), blood insulin levels C), IPITT results (D) and IPGTT results (E) of the mice were then detected or analysed as in Fig. 4. *p<0.05, **p<0.01 versus the HFHS group.
Figure 8
Figure 8
Therapeutic use of hypericin decreases β-cell loss and maintains islet mass in mice with HFHS-induced diabetes. (A) Histological sections of mouse pancreatic tissue. The mice in Fig. 7 were sacrificed, and the pancreases were removed and weighed. Portions of the mouse pancreases were fixed and subjected to HE staining as in Fig. 5A. Scale bar represents 100 μm. Arrows indicate pancreatic islets. (B-D) Fixed pancreas tissue from A was subjected to IHC analysis using anti-C-peptide antibodies (B) as shown in Fig. 5B, after which IHC-stained pancreatic sections were used to calculate the islet area (C) and β-cell mass (D) of the pancreas. The scale bar represents 100 μm. Arrows indicate positively stained cells. Data are presented as the mean ± S.D. (n = 8). (E) PDX1 protein levels in the mouse pancreas. Portions of the mouse pancreases from (A) were homogenized. PDX1 levels in the homogenate were detected by Western blot, and the density ratios of PDX1 to GAPDH were measured as in Fig. 5E. Fold change relative to the normal group is shown in the right-hand panel. Data are presented as the mean ± S.D. (n = 6). *p<0.05, **p<0.01 ***p<0.001, versus the HFHS group.

References

    1. Xiong X, Wang X, Li B. et al. Pancreatic islet-specific overexpression of Reg3β protein induced the expression of pro-islet genes and protected the mice against streptozotocin-induced diabetes mellitus. Am J Physiol Endocrinol Metab. 2011;300:E669–80. - PubMed
    1. Ganugula R, Arora M, Jaisamut P. et al. Nano-curcumin safely prevents streptozotocin-induced inflammation and apoptosis in pancreatic beta cells for effective management of Type 1 diabetes mellitus. Br. J. Pharmacol. 2017;174:2074–2084. - PMC - PubMed
    1. Pagliuca FW, Melton DA. How to make a functional-cell. Development. 2013;140:2472–2483. - PMC - PubMed
    1. Butler AE, Janson J, Bonner-Weir S. et al. βeta-Cell deficit and increased β-cell apoptosis in humans with type 2 diabetes. Diabetes. 2003;52:102–110. - PubMed
    1. Cernea S, Dobreanu M. Diabetes and beta cell function: from mechanisms to evaluation and clinical implications. Biochem Med. 2013;23:266–280. - PMC - PubMed

Publication types

MeSH terms