. 2019 Jul 9:13:587.
doi: 10.3389/fnins.2019.00587. eCollection 2019.

Determining the Temporal Profile of Intracranial Pressure Changes Following Transient Stroke in an Ovine Model

Affiliations

Determining the Temporal Profile of Intracranial Pressure Changes Following Transient Stroke in an Ovine Model

Annabel J Sorby-Adams et al. Front Neurosci. .

Abstract

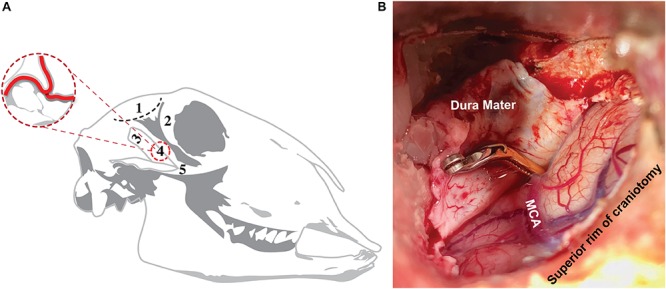
Background and purpose: Cerebral edema and elevated intracranial pressure (ICP) are the leading cause of death in the first week following stroke. Despite this, current treatments are limited and fail to address the underlying mechanisms of swelling, highlighting the need for targeted treatments. When screening promising novel agents, it is essential to use clinically relevant large animal models to increase the likelihood of successful clinical translation. As such, we sought to develop a survival model of transient middle cerebral artery occlusion (tMCAO) in the sheep and subsequently characterize the temporal profile of cerebral edema and elevated ICP following stroke in this novel, clinically relevant model.

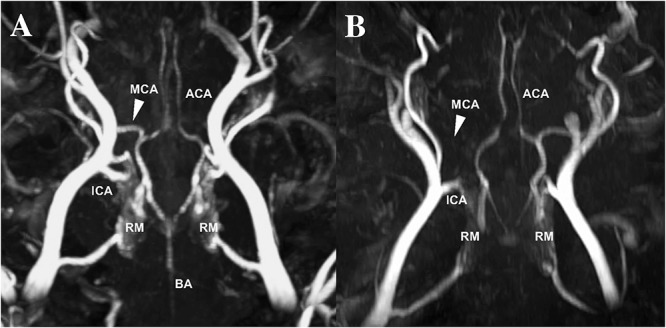
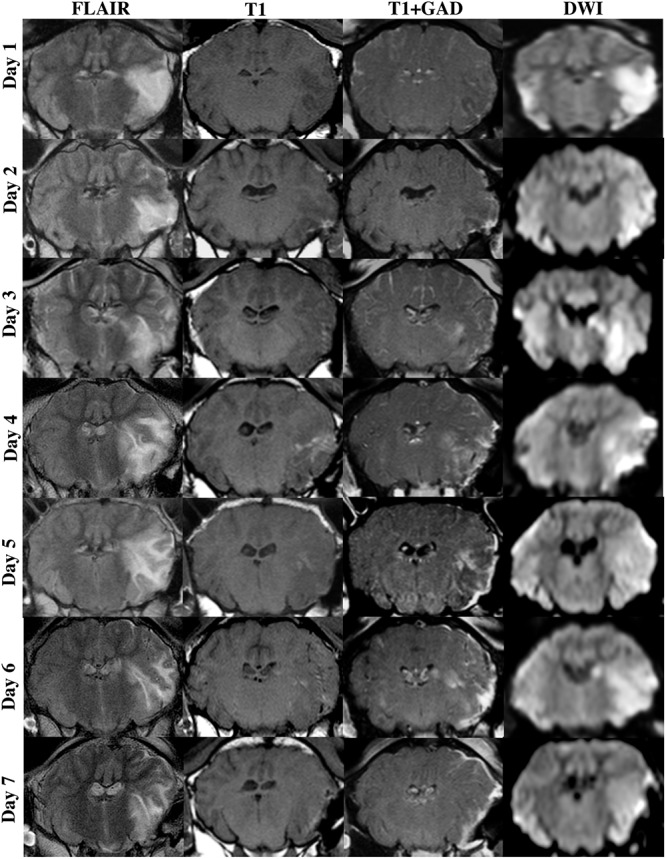
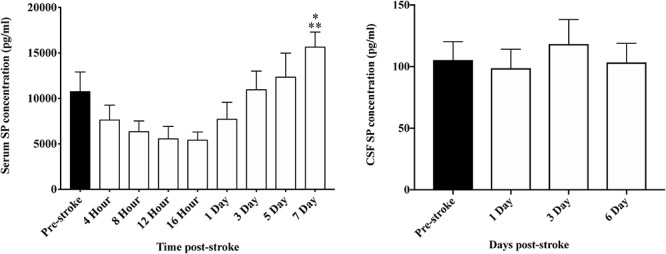
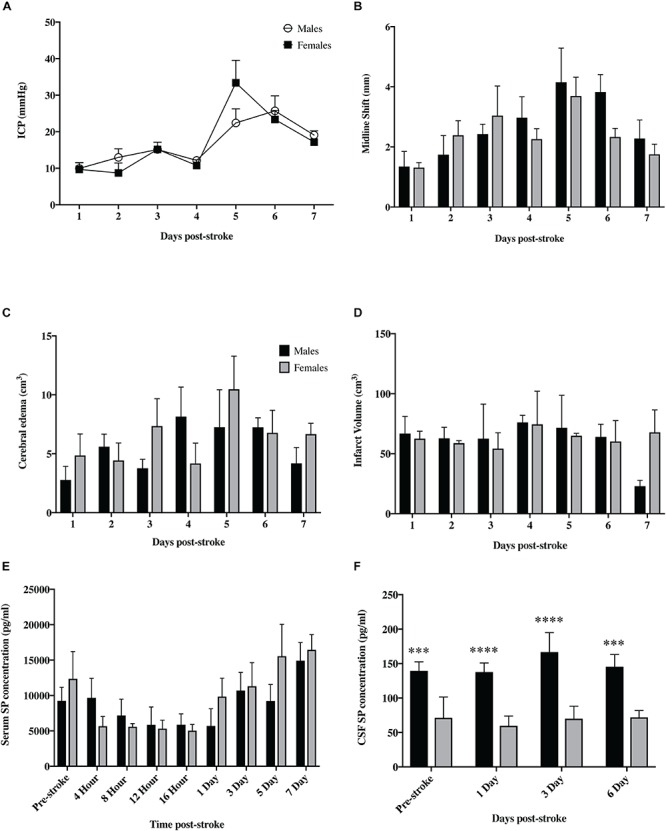
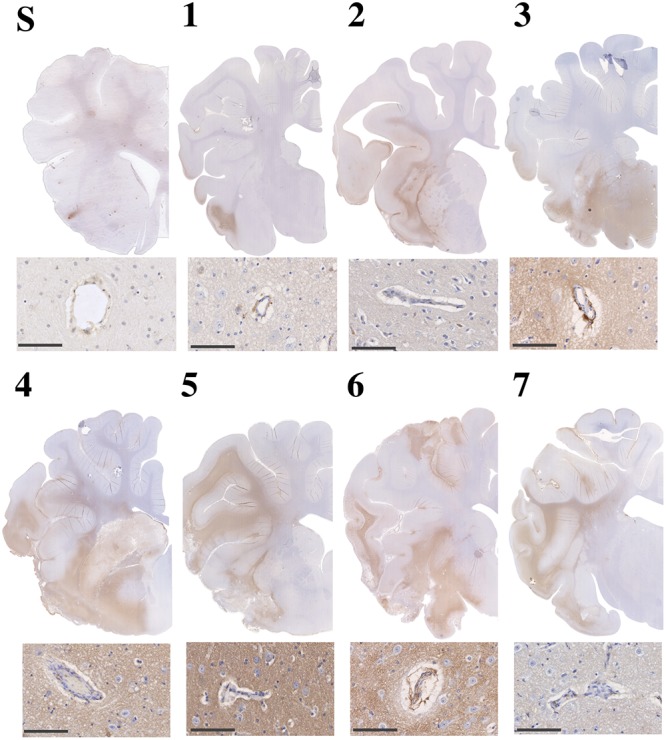
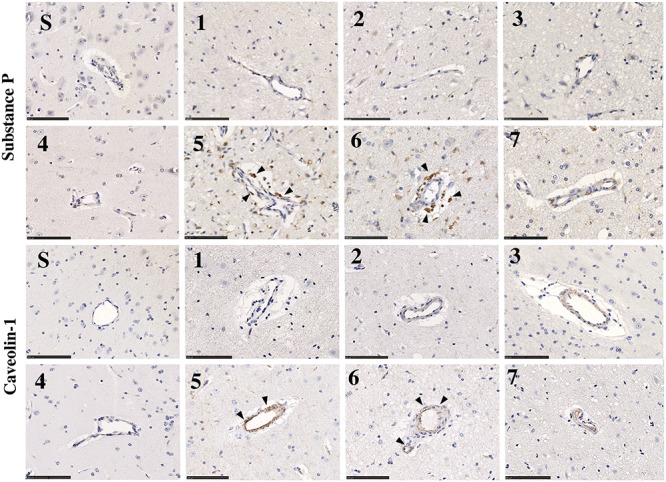
Methods: Merino-sheep (27M;31F) were anesthetized and subject to 2 h tMCAO with reperfusion or sham surgery. Following surgery, animals were allowed to recover and returned to their home pens. At preselected times points ranging from 1 to 7 days post-stroke, animals were re-anesthetized, ICP measured for 4 h, followed by imaging with MRI to determine cerebral edema, midline shift and infarct volume (FLAIR, T2 and DWI). Animals were subsequently euthanized and their brain removed for immunohistochemical analysis. Serum and cerebrospinal fluid samples were also collected and analyzed for substance P (SP) using ELISA.

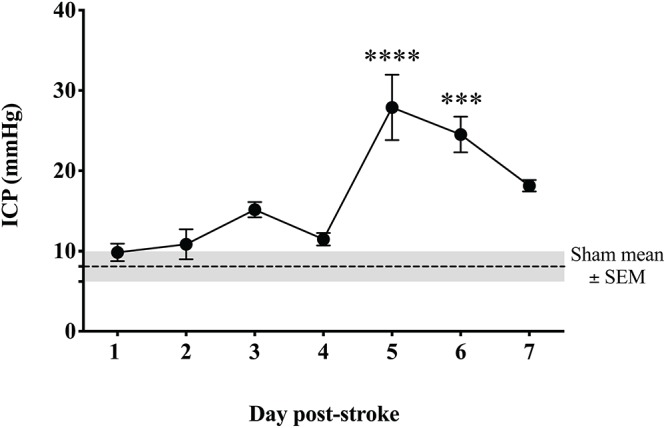
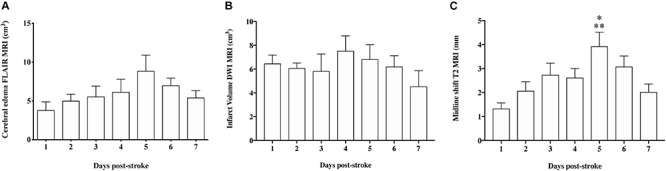
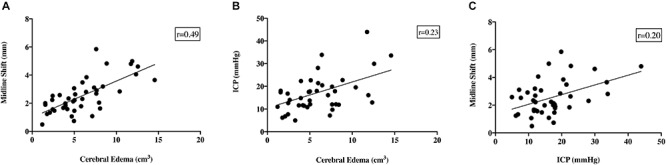
Results: Intracranial pressure and MRI scans were normal in sham animals. Following stroke, ICP rose gradually over time and by 5 days was significantly (p < 0.0001) elevated above sham levels. Profound cerebral edema was observed as early as 2 days post-stroke and continued to evolve out to 6 days, resulting in significant midline shift which was most prominent at 5 days post-stroke (p < 0.01), in keeping with increasing ICP. Serum SP levels were significantly elevated (p < 0.01) by 7 days post-tMCAO.

Conclusion: We have successfully developed a survival model of ovine tMCAO and characterized the temporal profile of ICP. Peak ICP elevation, cerebral edema and midline shift occurred at days 5-6 following stroke, accompanied by an elevation in serum SP. Our findings suggest that novel therapeutic agents screened in this model targeting cerebral edema and elevated ICP would most likely be effective when administered prior to 5 days, or as early as possible following stroke onset.

Keywords: blood-brain barrier; cerebral edema; intracranial pressure; large animal model; stroke.


Figures

FIGURE 1
FIGURE 1
Surgical approach to ovine transient MCAO. Surgical approach (A), showing site of incision (1; black dashed line) posterior to the orbital rim (2) and superior to the coronoid process (3). This approach enabled the skull base to be accessed without disrupting the coronoid process or zygomatic arch (5), allowing for craniotomy (4) and direct access to the MCA, whilst ensuring post-operative recovery of the animal and the ability to masticate following the procedure. Superior view of craniotomy site (B) showing the aneurysm clip applied to the proximal MCA.
FIGURE 2
FIGURE 2
MCA reperfusion following transient MCAO (A) compared to permanent MCAO (B) on time-of-flight MRA. Evidence of vessel patency, indicated by the white arrow, following clip removal in transient MCAO animals compared to permanent MCAO animals, where the vessel cannot be visualized MRA (data not reported). MCA, middle cerebral artery; ACA, anterior cerebral artery; ICA, internal carotid artery; BA, basilar artery; RM, rete mirabile.
FIGURE 3
FIGURE 3
Temporal profile of ICP following transient MCAO. ICP was significantly elevated at 5 days (p < 0.001) and 6 days (p < 0.05) post-stroke when compared to sham. By 7 days, ICP began to resolve though remained elevated compared to sham (p < 0.05). ∗∗∗∗p < 0.0001; and ∗∗∗p < 0.001 compared to sham. n = 6/time-point, n = 4 sham.
FIGURE 4
FIGURE 4
MRI findings following transient MCAO. Cerebral edema, as shown in coronal FLAIR MRI images, evolved from 1–6 days following stroke, beginning to resolve by 7 days. This evolution in cerebral edema was associated with enhanced extravasation of GAD across the BBB as seen on T1 weighted post-contrast series (T1+GAD) when compared to pre-contrast T1 series. Lesion volume, as shown in DWI MRI images, was comparable across time-points following stroke.
FIGURE 5
FIGURE 5
Quantification of infarct volume, cerebral edema, and midline shift on MRI. (A) There was no significant difference (p > 0.05) in infarct volume at any of the time-points following stroke. (B) The evolution of cerebral edema showed a similar pattern to ICP, however, changes were not significant (p > 0.05). (C) Midline shift was significantly greater at 5 days when compared to 1 (<0.01) and 7 (p < 0.05) days post-stroke. Data shown as mean ± SEM. *p < 0.05 compared to 7 days, ∗∗p < 0.01 compared to 1 day. n = 6/time-point.
FIGURE 6
FIGURE 6
Relationship between ICP, cerebral edema, midline shift and infarct volume. There was a moderate positive correlation seen between cerebral edema and midline shift (r = 0.49, A). Despite this, there was no correlation seen between ICP and cerebral edema (r = 0.23, B), or ICP and midline shift (r = 0.20, C). NB data from all time points was used for comparison between variables.
FIGURE 7
FIGURE 7
Temporal profile of serum and CSF SP levels following stroke. At 7 days post-stroke, SP in the serum was significantly elevated compared with levels seen at 4 h (p < 0.05), 8, 12, and 16 h (p < 0.01), and 1 day (p < 0.05) following stroke. Furthermore, despite a qualitative increase, SP concentration pre-stroke was comparable to day 7 post-stroke. In the CSF, there was no significant difference seen in SP levels at days 1, 3, and 6 post-stroke (p > 0.05). Data shown as mean ± SEM. *p < 0.05 compared to 4 h and 1 day; ∗∗p < 0.01 compared to 8, 12, and 16 h. n = 12/time-point serum; n = 8/time-point CSF.
FIGURE 8
FIGURE 8
Sex differences following tMCAO. There was no significant difference in ICP (A) seen between sexes at any of the post-stroke time points (p > 0.05). Furthermore, there was no significant difference seen between males and females in infarct volume (B), cerebral edema (C), or midline shift (D) (p > 0.05). SP levels in the serum (E) were not significantly different between sexes (p > 0.05) but were significantly elevated in the CSF (F) of female animals compared to males at both pre and post-stroke time points (p < 0.01). Data shown as mean ± SEM. ∗∗∗p < 0.01 and ****p < 0.0001 females compared to males. n = 3/time-point ICP infarct volume, midline shift and edema; n = 6/time-point for serum; n = 4/time-point CSF.
FIGURE 9
FIGURE 9
Albumin immunoreactivity in sham (S) and post-stroke animals at 1 (1), 2 (2), 3 (3), 4 (4), 5 (5), 6 (6) and 7 days (7) post-stoke. Enhanced albumin extravasation evolved over time following stroke and was most prominent at 4–6 days following tMCAO. This pattern of albumin staining was consistent with perivascular staining seen microscopically. Microscopic images scale bar 100 μm, 40× magnification.
FIGURE 10
FIGURE 10
SP and caveolin-1 immunoreactivity in sham (S) and post-stroke animals at 1 (1), 2 (2), 3 (3), 4 (4), 5 (5), 6 (6), and 7 days (7) post-stoke. There was no identifiable immunoreactivity of SP or caveolin-1 in sham animals (S). Low levels of SP immunoreactivity were seen perivascularly at 1–4 days post-stroke. At 5 and 6 days following transient MCAO, there was an increase in SP seen in the perivascular tissue of the ischemic penumbra in the affected hemisphere. This increase in SP was concordant with an increase in caveolin-1 immunoreactivity perivascularly, which was most evident at 5–6 days. Arrows indicate increased immunoreactivity of SP and cav-1 seen surrounding vessels. Scale bar 100 μm, 40× magnification.

Similar articles

Cited by

References

    1. Abbott N. J., Ronnback L., Hansson E. (2006). Astrocyte-endothelial interactions at the blood-brain barrier. Nat. Rev. Neurosci. 7 41–53.10.1038/nrn1824 - DOI - PubMed
    1. Anderson R. W., Sandoz B., Dutschke J. K., Finnie J. W., Turner R. J., Blumbergs P. C., et al. (2014). Biomechanical studies in an ovine model of non-accidental head injury. J. Biomech. 47 2578–2583. 10.1016/j.jbiomech.2014.06.002 - DOI - PubMed
    1. Ayata C., Ropper A. H. (2002). Ischaemic brain oedema. J. Clin. Neurosci. 9 113–124. 10.1054/jocn.2001.1031 - DOI - PubMed
    1. Battey T. W. K., Karki M., Singhal A. B., Wu O., Sadaghiani S., Campbell B. C. V., et al. (2014). Brain edema predicts outcome after nonlacunar ischemic stroke. Stroke 45:3643. 10.1161/STROKEAHA.114.006884 - DOI - PMC - PubMed
    1. Beard D. J., Mcleod D. D., Logan C. L., Murtha L. A., Imtiaz M. S., Van Helden D. F., et al. (2015). Intracranial pressure elevation reduces flow through collateral vessels and the penetrating arterioles they supply. a possible explanation for ‘collateral failure’ and infarct expansion after ischemic stroke. J. Cereb. Blood Flow Metab. 35 861–872. 10.1038/jcbfm.2015.2 - DOI - PMC - PubMed