

New Term to Quantify the Effect of Temperature on p H min -Values Used in Cardinal Parameter Growth Models for Listeria monocytogenes
- PMID: 31338078
- PMCID: PMC6628878
- DOI: 10.3389/fmicb.2019.01510
New Term to Quantify the Effect of Temperature on p H min -Values Used in Cardinal Parameter Growth Models for Listeria monocytogenes
Abstract
The aim of this study was to quantify the influence of temperature on pH min -values of Listeria monocytogenes as used in cardinal parameter growth models and thereby improve the prediction of growth for this pathogen in food with low pH. Experimental data for L. monocytogenes growth in broth at different pH-values and at different constant temperatures were generated and used to determined pH min -values. Additionally, pH min -values for L. monocytogenes available from literature were collected. A new pH min -function was developed to describe the effect of temperatures on pH min -values obtained experimentally and from literature data. A growth and growth boundary model was developed by substituting the constant pH min -value present in the Mejlholm and Dalgaard (2009) model (J. Food. Prot. 72, 2132-2143) by the new pH min -function. To obtain data for low pH food, challenge tests were performed with L. monocytogenes in commercial and laboratory-produced chemically acidified cheese including glucono-delta-lactone (GDL) and in commercial cream cheese. Furthermore, literature data for growth of L. monocytogenes in products with or without GDL were collected. Evaluation of the new and expanded model by comparison of observed and predicted μ max -values resulted in a bias factor of 1.01 and an accuracy factor of 1.48 for a total of 1,129 growth responses from challenge tests and literature data. Growth and no-growth responses of L. monocytogenes in seafood, meat, non-fermented dairy products, and fermented cream cheese were 90.3% correctly predicted with incorrect predictions being 5.3% fail-safe and 4.4% fail-dangerous. The new pH min -function markedly extended the range of applicability of the Mejlholm and Dalgaard (2009) model from pH 5.4 to pH 4.6 and therefore the model can now support product development, reformulation or risk assessment of food with low pH including chemically acidified cheese and cream cheese.
Keywords: food safety; mathematical modeling; model validation; predictive microbiology; product development; risk assessment.
Figures
 )] and individual strains [ISO570 (
 ), 99714 (
 ), SLU 2493 (
 ), SLU 2265 (
 )].
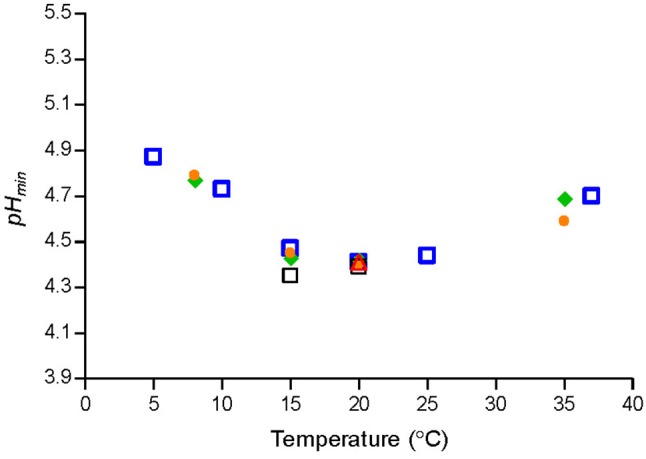
)].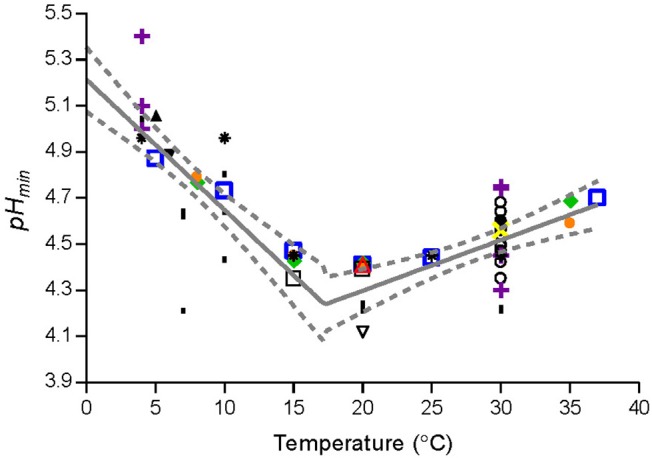 )] and individual strains [ISO570 (), 99714 (), SLU 2493 (), SLU 2265 ()] from the present study. Data from Aryani et al. (2015) (○), Brocklehurst et al. (1995) (
 ), Duffy et al. (1994) (▴), Farber et al. (1989) (
 ), George et al. (1988) (l), Koutsoumanis et al. (2004a) (
 ), Petran and Zottola (1989) (
 ), and Ryser and Marth (1988) (▾). Solid line (—) and dashed line (−−−) represent, respectively, the fitted model and confidence interval (95%).
Similar articles
-
Modeling and predicting the growth of lactic acid bacteria in lightly preserved seafood and their inhibiting effect on Listeria monocytogenes.J Food Prot. 2007 Nov;70(11):2485-97. doi: 10.4315/0362-028x-70.11.2485. J Food Prot. 2007. PMID: 18044425
-
Antimicrobial effect of nisin in processed cheese - Quantification of residual nisin by LC-MS/MS and development of new growth and growth boundary model for Listeria monocytogenes.Int J Food Microbiol. 2021 Jan 2;338:108952. doi: 10.1016/j.ijfoodmicro.2020.108952. Epub 2020 Nov 4. Int J Food Microbiol. 2021. PMID: 33229046
-
Modelling the effect of lactic acid bacteria from starter- and aroma culture on growth of Listeria monocytogenes in cottage cheese.Int J Food Microbiol. 2014 Oct 1;188:15-25. doi: 10.1016/j.ijfoodmicro.2014.07.012. Epub 2014 Jul 21. Int J Food Microbiol. 2014. PMID: 25086348
-
Growth and growth boundary model with terms for melting salts to predict growth responses of Listeria monocytogenes in spreadable processed cheese.Food Microbiol. 2019 Dec;84:103255. doi: 10.1016/j.fm.2019.103255. Epub 2019 Jun 29. Food Microbiol. 2019. PMID: 31421751
-
Prevalence and challenge tests of Listeria monocytogenes in Belgian produced and retailed mayonnaise-based deli-salads, cooked meat products and smoked fish between 2005 and 2007.Int J Food Microbiol. 2009 Jul 31;133(1-2):94-104. doi: 10.1016/j.ijfoodmicro.2009.05.002. Epub 2009 May 9. Int J Food Microbiol. 2009. PMID: 19515447 Review.
Cited by
-
Inhibitory Effect of Lactiplantibacillusplantarum and Lactococcus lactis Autochtonous Strains against Listeria monocytogenes in a Laboratory Cheese Model.Foods. 2022 Feb 28;11(5):715. doi: 10.3390/foods11050715. Foods. 2022. PMID: 35267348 Free PMC article.
-
Understanding How Microorganisms Respond to Acid pH Is Central to Their Control and Successful Exploitation.Front Microbiol. 2020 Sep 24;11:556140. doi: 10.3389/fmicb.2020.556140. eCollection 2020. Front Microbiol. 2020. PMID: 33117305 Free PMC article.
-
Predictive Model for Listeria monocytogenes in RTE Meats Using Exclusive Food Matrix Data.Foods. 2024 Dec 6;13(23):3948. doi: 10.3390/foods13233948. Foods. 2024. PMID: 39683019 Free PMC article.
-
Development of extensive growth and growth boundary models for mesophilic and psychrotolerant Bacillus cereus in dairy products (Part 1).Front Microbiol. 2025 Mar 21;16:1553885. doi: 10.3389/fmicb.2025.1553885. eCollection 2025. Front Microbiol. 2025. PMID: 40190734 Free PMC article.
References
-
- ANZ (2018). Standard 1.6.1. Australia New Zealand Food Standards Code - Standard 1.6.1 - Microbiological Limits for Food. Available online at: https://www.legislation.gov.au/Series/F2015L00411/Compilations (accessed January 19, 2019).
LinkOut - more resources
Full Text Sources
Research Materials