. 2019 Jun 7:14:134-147.
doi: 10.1016/j.omtm.2019.05.015. eCollection 2019 Sep 13.

Enhancing Lentiviral and Alpharetroviral Transduction of Human Hematopoietic Stem Cells for Clinical Application

Affiliations

Enhancing Lentiviral and Alpharetroviral Transduction of Human Hematopoietic Stem Cells for Clinical Application

Juliane W Schott et al. Mol Ther Methods Clin Dev. .

Abstract

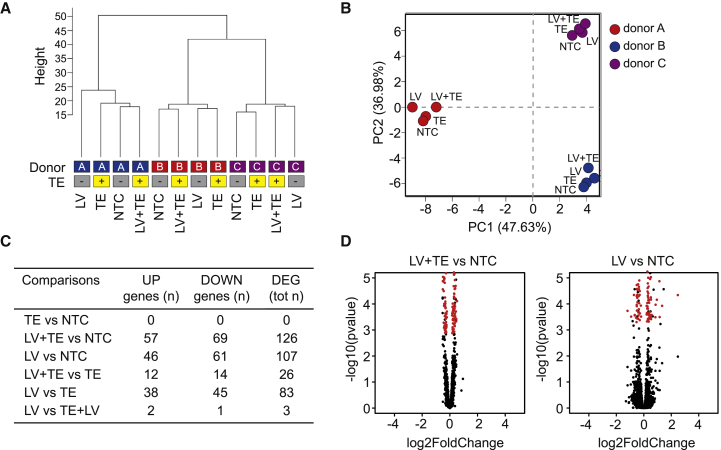
Ex vivo retroviral gene transfer into CD34+ hematopoietic stem and progenitor cells (HSPCs) has demonstrated remarkable clinical success in gene therapy for monogenic hematopoietic disorders. However, little attention has been paid to enhancement of culture and transduction conditions to achieve reliable effects across patient and disease contexts and to maximize potential vector usage and reduce treatment cost. We systematically tested three HSPC culture media manufactured to cGMP and eight previously described transduction enhancers (TEs) to develop a state-of-the-art clinically applicable protocol. Six TEs enhanced lentiviral (LV) and five TEs facilitated alpharetroviral (ARV) CD34+ HSPC transduction when used alone. Combinatorial TE application tested with LV vectors yielded more potent effects, with up to a 5.6-fold increase in total expression of a reporter gene and up to a 3.8-fold increase in VCN. Application of one of the most promising combinations, the poloxamer LentiBOOST and protamine sulfate, for GMP-compliant manufacturing of a clinical-grade advanced therapy medicinal product (ATMP) increased total VCN by over 6-fold, with no major changes in global gene expression profiles or inadvertent loss of CD34+CD90+ HSPC populations. Application of these defined culture and transduction conditions is likely to significantly improve ex vivo gene therapy manufacturing protocols for HSPCs and downstream clinical efficacy.

Keywords: ATMP; CD34+ cell transduction; HSPC; LentiBOOST; SCID-X1; alpharetroviral vector; gene therapy; lentiviral vector; protamine sulfate; transduction enhancer.


Figures

Figure 1
Figure 1
Media Comparison for CD34+ HSPC Culture and Expansion (A) Experimental scheme. Purified CD34+ HSPCs from 2 different HDs were thawed and cultured in X-Vivo 15 (green), SCGM (blue), StemSpan (orange) and HSC Brew (gray) in the presence of SCF (300 ng/mL), Flt3-L (300 ng/mL), and TPO (100 ng/mL). Cultures were analyzed daily by FCM for cell counts and expression of stem cell markers. Cells were additionally subjected to colony-forming unit (CFU) assay on day 3 post-thaw. (B and C) Cell counts assessed with counting beads (B) and percentage of CD34+CD90+ HSPCsprim (C), determined by FCM at the indicated time points of culture in the different media. Top: donor A; bottom: donor B. Error bars indicate the mean of 2 independent technical duplicates ± SD; *adjusted p ≤ 0.05, two-way ANOVA with Geisser-Greenhouse correction. (D) Number of BFU-E, CFU-GM, and CFU-GEMM colonies in the CFU assay, determined after 2 weeks of culture in MethoCult. HSC Brew was excluded from CFU assay due to insufficient cell numbers.
Figure 2
Figure 2
Single Transduction Enhancers Increase Transduction of CD34+ HSPCs with Lentiviral and Alpharetroviral Vectors (A) Schematic representation of the EGFP-encoding alpharetroviral (ARV) and lentiviral (LV) SIN vectors used in this study. R, repeat region; U5, unique 5; hPGK, human phosphoglycerate kinase promoter; PRE, post-transcriptional regulatory element; ΔU3, unique 3 region with self-inactivating deletion. (B) Experimental scheme. CD34+ HSPCs from 3 HDs were pre-stimulated for 24 h prior to transduction in the presence or absence of single transduction enhancers (TEs) in SCGM plus STF. Transduction was carried out at a MOI of 20, which is lower than the MOI used with most gene therapy protocols, allowing for a better observation of TE effects due to a lower transduction rate. Cells were washed after 24 h and analyzed by FCM 1 week post-transduction. Donor C was used in 2 independent experiments for selected conditions. (C and D) Percentage of CD34+CD90+ HSPCsprim 1 week post-transduction with LV (C) and ARV (D) vectors at a MOI of 20. NTC, non-transduced control; -, no TE or vehicle; DMSO, vehicle only; PGE2, prostaglandin E2; PS, protamine sulfate; Stauro, staurosporine; OH-Stauro, 7-hydroxy-staurosporine. Horizontal lines indicate baseline levels in the absence of TE treatment (“-” condition) for each donor. (E and F) Total EGFP expression (= normalized percentage of EGFP+ cells × median EGFP intensity within the EGFP+ fraction) in live cells 1 week post-transduction with LV (E) and ARV (F) vectors at a MOI of 20. Vertical bars represent the mean total expression. Numbers in boxes above bars indicate the mean fold increase (if ≥1.1) from the four experiments. (G and H) Total EGFP expression in the CD34+CD90+ HSPCprim fraction 1 week post-transduction with LV (G) and ARV (H) vectors at a MOI of 20. Vertical bars represent the mean total expression. Numbers in boxes above bars indicate the mean fold increase (if ≥1.1) from the four experiments.
Figure 3
Figure 3
Combination of Transduction Enhancers Increases Lentiviral CD34+ HSPC Transduction over Their Single Use (A) Experimental timeline. CD34+ HSPCs from 3 HDs were pre-stimulated for 24 h and then transduced with the LV vector depicted in Figure 2A at MOIs of 20 and 10 in the presence or absence of selected transduction enhancer (TE) combinations in two sets of experiments. Cells were cultured in SCGM plus STF. Cells were washed after 24 h and analyzed by FCM 1 week post-transduction. Vector copy numbers (VCNs) were determined 2 weeks post-transduction (MOI 10 set of experiments). (B) Percentage of CD34+CD90+ HSPCsprim 1 week after LV transduction at a MOI of 20. NTC, non-transduced control; -, no TE or vehicle; DMSO, vehicle only; PGE2, prostaglandin E2; PS, protamine sulfate; Stauro, staurosporine. Horizontal lines indicate baseline levels in the absence of TE treatment (“-” condition) for each donor. Numbers in boxes above the graph indicate the mean fold change from the three experiments, relative to the “no TE” transduced control. (C and D) Total EGFP expression (= normalized percentage of EGFP+ cells × median EGFP intensity within the EGFP+ fraction) in the live (C) and in the CD34+CD90+ HSPCprim (D) fraction 1 week after LV HSPC transduction at a MOI of 20. Vertical bars represent the mean total expression. Numbers in boxes above bars indicate the mean fold increase (if ≥1.1) from the three experiments. (E) Total EGFP expression in live cells 1 week post-LV-HSPC-transduction at a MOI of 10. Vertical bars represent the mean total expression. Numbers above bars indicate the mean fold increase (if ≥1.1) from the three experiments. Note: for 2 (green and orange symbols) of the 3 donors, Stauro treatment was performed for 24 h, including the transduction period, instead of the 2-h pre-incubation period chosen in previous experiments. (F) Vector copy number (VCN) per diploid cell, determined by real-time qPCR detecting the post-transcriptional regulatory element (PRE) 2 weeks post-transduction at a MOI of 10. Vertical bars represent the mean of three experiments. Numbers in boxes above bars indicate the mean fold increase. Note that, for 2 (green and orange symbols) of the 3 donors, Stauro treatment was performed for 24 h, including the transduction period, instead of the 2-h pre-incubation period chosen in previous experiments.
Figure 4
Figure 4
LentiBOOST Plus Protamine Sulfate Do Not Cause Major Alterations in HSPC Gene Expression Profiles (A) Hierarchical clustering of RNA-seq data. NTC, non-transduced and non-TE-treated control; TE, non-transduced control treated with TE only; LV, transduced in the absence of TE; LV+TE, transduced in the presence of TE. (B) First two components of a principal-component analysis, with percentage of variance associated with each axis; each dot represents a sample, colored according to donor source. (C) List of differentially expressed genes (DEGs) found to be significantly deregulated (adjusted p ≤ 0.05) for each treatment comparison. (D) Volcano plots of RNA-seq data from three biological replicates; differentially expressed transcripts (adjusted p ≤ 0.05) between LV-treated or LV+TE-treated and untreated HSPCs are highlighted in red.
Figure 5
Figure 5
LentiBOOST Plus Protamine Sulfate Increase Transduction of CD34+ HSPCs with a Clinical-Grade Lentiviral SCID-X1 Vector under GMP Conditions (A) Experimental timeline. Fresh CD34+ HSPCs were purified from a mobilized leukapheresis and pre-stimulated for 24 h in SCGM supplemented with STF. Transduction was performed at a MOI of 66.66 (1 × 108 IG/mL) in the presence or absence of the TEs LentiBOOST and PS in two rounds on consecutive days. Viability was determined regularly by trypan blue staining and manual cell count. The product was formulated on day 3 post-selection, and cells were analyzed for the expression of stem cell markers by FCM. An aliquot of the formulated product was thawed and analyzed for the VCN 1 week after liquid culture and for CFUs, as well as for the VCN in individual colonies, after 2 weeks of culture in MethoCult (CFU assay). All steps were performed under GMP conditions and according to GMP protocols. (B) Schematic representation of the LV vector clinically used for the treatment of SCID-X1, with a SIN design to express the interleukin-2 receptor gamma chain (IL2RG). R, repeat region; U5, unique 5; EF1α, human elongation factor 1α promoter; PRE, post-transcriptional regulatory element; ΔU3, unique 3 region with self-inactivating deletion. (C) Percentage of live cells, determined by trypan blue exclusion. −TE, no transduction enhancer; +TE, supplemented with LentiBOOST and PS. (D) Percentage of CD34+CD90+ HSPCsprim on day 3 post-thaw. −TE, no transduction enhancer; +TE, supplemented with LentiBOOST and PS. (E) CFU assay. Individual colony types were manually counted after 2 weeks of culture in MethoCult. −TE, no transduction enhancer; +TE, supplemented with LentiBOOST and PS. (F) Mean VCN of the LV Psi sequence per diploid cell, determined by real-time qPCR after 1 week of liquid culture. −TE, no transduction enhancer; +TE, supplemented with LentiBOOST and PS. (G) VCN (Psi) in individual CFU colonies. Error bars indicate the mean ± SD. −TE, no transduction enhancer; +TE, supplemented with LentiBOOST and PS. (H) Percentage of vector-positive CFUs in different CFU fractions, determined by real-time qPCR detecting the Psi sequence. (I) The clinical transduction protocol involving two rounds of transduction at 1 × 108 IG/mL in the absence of TE administration was tested against two modified protocols entailing the use of the TEs LentiBOOST and PS, i.e., only one round of transduction at the full vector dose or at half the original vector dose (0.5 × 108 IG/mL). VCN determination in liquid culture and CFU assays were performed as shown in Figure 5A. −TE, no transduction enhancer; +TE, supplemented with LentiBOOST and PS. (J) Mean VCNs of the LV Psi sequence per diploid cell, determined by real-time qPCR after 1 week of liquid culture. *p ≤ 0.05, Kruskal-Wallis test with Dunn’s multiple comparison. Bars indicate the mean ± SD. (K) VCNs (Psi) in individual CFU colonies. Error bars indicate the mean ± SD. (L) Percentage of vector-positive CFUs in different CFU fractions, determined by real-time qPCR detecting the Psi sequence. Error bars indicate the mean ± SD.

References

    1. Cavazzana-Calvo M., Hacein-Bey S., de Saint Basile G., Gross F., Yvon E., Nusbaum P., Selz F., Hue C., Certain S., Casanova J.L. Gene therapy of human severe combined immunodeficiency (SCID)-X1 disease. Science. 2000;288:669–672. - PubMed
    1. Hacein-Bey-Abina S., Le Deist F., Carlier F., Bouneaud C., Hue C., De Villartay J.P., Thrasher A.J., Wulffraat N., Sorensen R., Dupuis-Girod S. Sustained correction of X-linked severe combined immunodeficiency by ex vivo gene therapy. N. Engl. J. Med. 2002;346:1185–1193. - PubMed
    1. Ribeil J.-A., Hacein-Bey-Abina S., Payen E., Magnani A., Semeraro M., Magrin E., Caccavelli L., Neven B., Bourget P., El Nemer W. Gene therapy in a patient with sickle cell disease. N. Engl. J. Med. 2017;376:848–855. - PubMed
    1. Morris E.C., Fox T., Chakraverty R., Tendeiro R., Snell K., Rivat C., Grace S., Gilmour K., Workman S., Buckland K. Gene therapy for Wiskott-Aldrich syndrome in a severely affected adult. Blood. 2017;130:1327–1335. - PMC - PubMed
    1. Thompson A.A., Walters M.C., Kwiatkowski J., Rasko J.E.J., Ribeil J.A., Hongeng S., Magrin E., Schiller G.J., Payen E., Semeraro M. Gene therapy in patients with transfusion-dependent β-thalassemia. N. Engl. J. Med. 2018;378:1479–1493. - PubMed

LinkOut - more resources