. 2019 Jun 14;5(6):e01707.
doi: 10.1016/j.heliyon.2019.e01707. eCollection 2019 Jun.

Identification of differentially expressed genes in small and non-small cell lung cancer based on meta-analysis of mRNA

Affiliations

Identification of differentially expressed genes in small and non-small cell lung cancer based on meta-analysis of mRNA

Nitesh Shriwash et al. Heliyon. .

Abstract

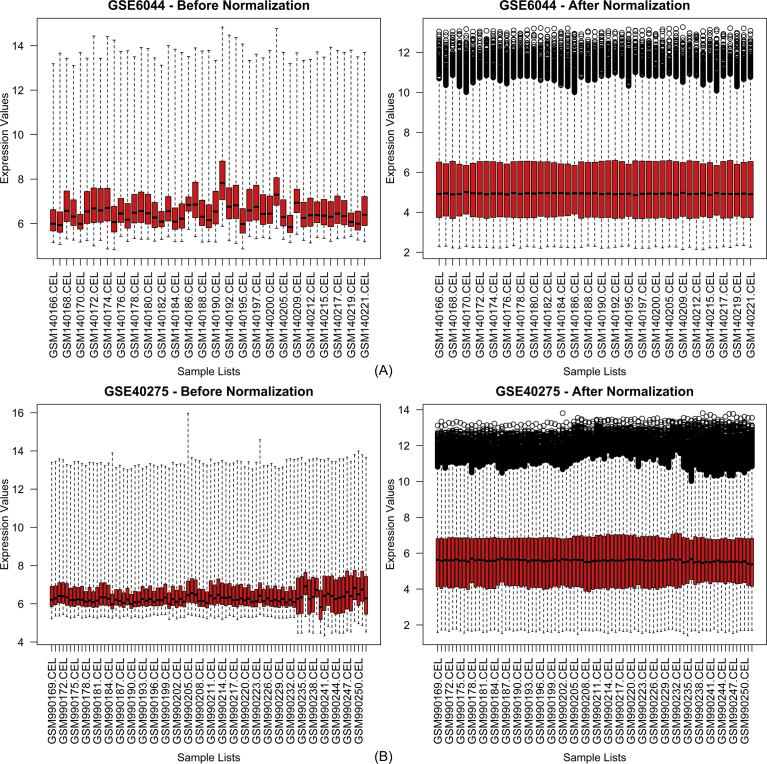
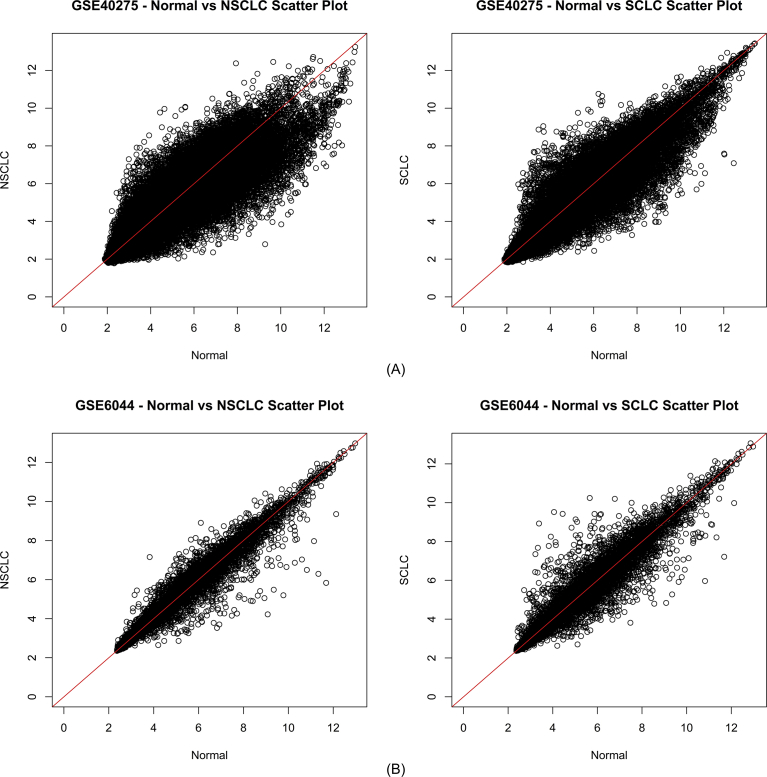
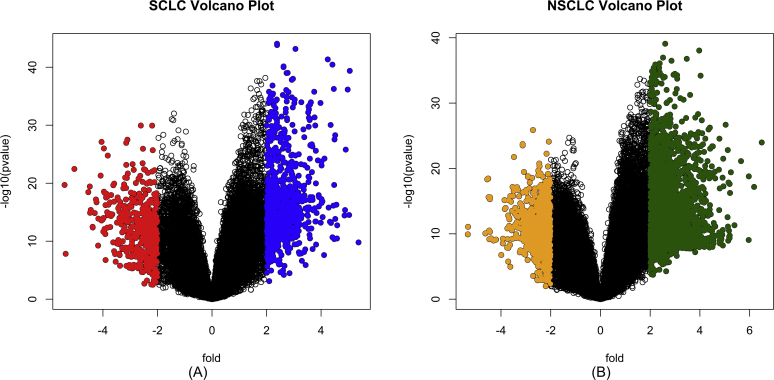
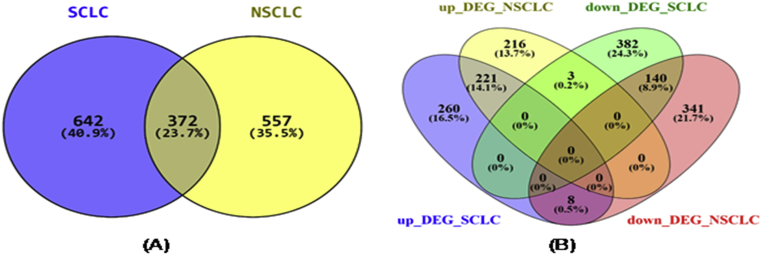
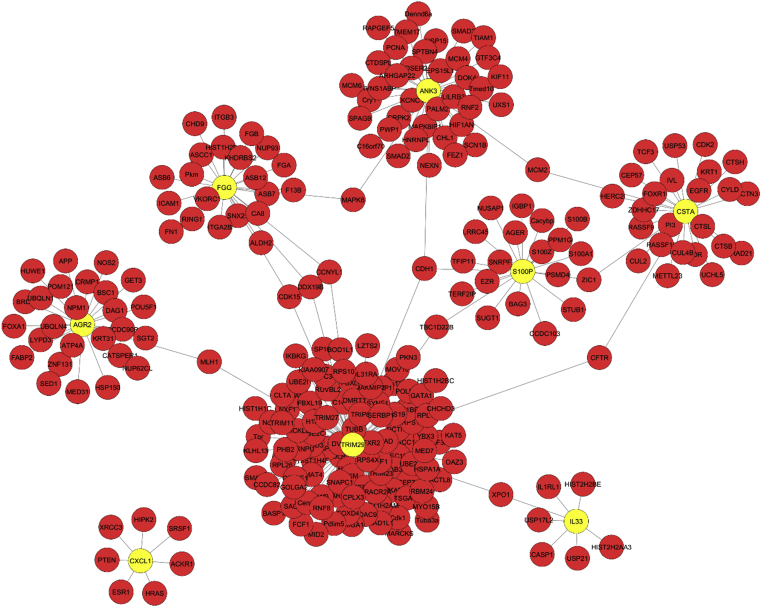
Lung cancer has the lowest survival rate spread globally resulting in a large number of deaths. This is attributed to insufficient measures such as lack of early detection and chemoresistance in the patients. It can be subdivided into two histological groups: Non-Small-Cell Lung Cancer (NSCLC), which is most prevalent (85% of all lung cancers) but less destructive; and Small-Cell Lung Cancer (SCLC), which is intermittently metastatic and less prevalent (15% of all lung cancers). The present study deals with the analysis of gene expression of two subtypes to identify the Differentially Expressed Genes (DEGs). For this study, we selected two datasets from the Omnibus database, which included 50 non-small cell lung cancer samples, 31 small cell lung cancer samples, and 48 samples from normal lung tissue. After DEGs identification using the meta-analysis approach, they were then subjected to further analysis following p-value adjustment via the Benjamini-Hochberg method. We identified 440 overexpressed and 489 underexpressed genes in NSCLC, and 489 overexpressed and 525 underexpressed genes in SCLC, compared with normal lung tissues. Furthermore, we identified 3 overlapping genes between upregulated DEGs in NSCLC and downregulated DEGs in SCLC; and 8 overlapping genes between upregulated DEGs in SCLC and downregulated DEGs in NSCLC. Accordingly, a Protein-Protein Interaction (PPI) network of the overlapping genes was generated, which contained a total of 261 genes, of which the top five were TRIM29, ANK3, CSTA, FGG, and AGR2. These five candidate genes reported herein may prove to be potential therapeutic targets.

Keywords: Bioinformatics; Biological science; Gene expression; Systems biology.


Figures

Fig. 1
Fig. 1
Distribution of Expression Data Before and After Normalization in (A) GSE6044 and (B) GSE40275 . X-axis represents the sample lists; Y-axis represents expression values. Before normalization box plot shows median of data at different levels whereas after n normalization median is adjusted.
Fig. 2
Fig. 2
Intensity Scattered Plot showing the relationship between expression values of Normal vs NSCLC and Normal vs SCLC in datasets (A) GSE40275 and (B) GSE6044. (A) represents the comparison of expression value of genes in dataset GSE40275 between normal and NSCLC samples and between normal and SCLC samples. (B) represents the comparison of expression value of genes in dataset GSE6044 between normal and NSCLC samples and between normal and SCLC samples. x-axis represents the expression value of normal samples whereas y-axis represents the expression values of diseased samples.
Fig. 3
Fig. 3
Volcano plot highlighting DEGs: (A) A fold vs -log10(p-value) plot, highlighting DEGs in SCLC, indicates that the down-regulated DEGs highlighted with blue color are more in number than the up-regulated DEGs highlighted with red color. The second fold vs -log10(p-value) plot (B) highlights DEGs in NSCLC, up-regulated DEGs are highlighted with orange color and down-regulated DEGs are highlighted with green color. X-axis represents the fold change (log2 scale) and Y-axis represents the p-value (-log10 scale).
Fig. 4
Fig. 4
(A) Venn diagram showing overlap in the number of genes identified as differentially expressed in SCLC and NSCLC. As shown in figure (A), 642 genes were included exclusively in “SCLC”, 557 genes were included exclusively in “NSCLC” and 372 genes were common in “NSCLC” and “SCLC”. Blue circle denotes the number of DEGs in SCLC group and yellow circle denotes number of DEGs in NSCLC group. (B) Venn diagram showing overlap between the up-regulated and down-regulated differentially expressed genes in SCLC and NSCLC. As shown in Figure (B), 221 genes were commonly up-regulated in NSCLC group and SCLC group whereas 140 genes were commonly down-regulated in NSCLC group and SCLC group and also 3 genes (GUSBP8, CHL1, CXCL1) were common between up-regulated DEGs in NSCLC and down-regulated DEGs in SCLC and 8 genes (FGG, IL33, AGR2, ANK3, CSTA, FABP6, S100P, TRIM29) were common between up-regulated DEGs in SCLC and down-regulated DEGs in NSCLC. The four ovals highlighted with different colors represent the type of differential expression pattern. Blue color represents up-regulated DEGs in SCLC, yellow color represents up-regulated DEGs in NSCLC, green denotes down-regulated DEGs in SCLC and red shows down-regulated DEGs in NSCLC.
Fig. 5
Fig. 5
Protein-protein interaction (PPI) network: This PPI-interaction network was constructed from the 8 overlapping differentially expressed genes (DEGs). A total of 261 proteins participated in this network. Yellow nodes represent 8 DEGs.

References

    1. Stewart B.W., Wild C. IARC Press; Lyon, France: 2014. World Cancer Report 2014.
    1. Hoffman P.C., Mauer A.M., Vokes E.E. Lung cancer. The Lancet. 2000;355(9202):479–485. - PubMed
    1. Travis W.D. World Health Organization Classification of Tumours. IARC Press Oxford University Press (distributor); Lyon Oxford: 2004. Pathology and genetics of tumours of the lung, pleura, thymus and heart; p. 344.
    1. van Meerbeeck J.P., Fennell D.A., De Ruysscher D.K.M. Small-cell lung cancer. The Lancet. 2011;378(9804):1741–1755. - PubMed
    1. Loiselle J.J., Roy J.G., Sutherland L.C. RBM5 reduces small cell lung cancer growth, increases cisplatin sensitivity and regulates key transformation-associated pathways. Heliyon. 2016;2(11) - PMC - PubMed