

The DNA damage response acts as a safeguard against harmful DNA-RNA hybrids of different origins
- PMID: 31338941
- PMCID: PMC6726908
- DOI: 10.15252/embr.201847250
The DNA damage response acts as a safeguard against harmful DNA-RNA hybrids of different origins
Abstract
Despite playing physiological roles in specific situations, DNA-RNA hybrids threat genome integrity. To investigate how cells do counteract spontaneous DNA-RNA hybrids, here we screen an siRNA library covering 240 human DNA damage response (DDR) genes and select siRNAs causing DNA-RNA hybrid accumulation and a significant increase in hybrid-dependent DNA breakage. We identify post-replicative repair and DNA damage checkpoint factors, including those of the ATM/CHK2 and ATR/CHK1 pathways. Thus, spontaneous DNA-RNA hybrids are likely a major source of replication stress, but they can also accumulate and menace genome integrity as a consequence of unrepaired DSBs and post-replicative ssDNA gaps in normal cells. We show that DNA-RNA hybrid accumulation correlates with increased DNA damage and chromatin compaction marks. Our results suggest that different mechanisms can lead to DNA-RNA hybrids with distinct consequences for replication and DNA dynamics at each cell cycle stage and support the conclusion that DNA-RNA hybrids are a common source of spontaneous DNA damage that remains unsolved under a deficient DDR.
Keywords: ATM; ATR; DNA damage response; R loop; post-replicative repair.
© 2019 The Authors.
Conflict of interest statement
The authors declare that they have no conflict of interest.
Figures

Top‐hit selected candidates are listed. The plot shows relative S9.6 nuclear intensity values for cells transformed with each of the indicated pool of siRNAs.
Representative images of HeLa cells immunostained with S9.6 and nucleolin antibodies after transfection with at least a pool of two siRNAs of each original pool.
Relative S9.6 signal intensity per nucleus after nucleolus signal removal in HeLa cells transfected with the indicated siRNAs. More than 250 total cells from three independent experiments were considered. The median of each population is shown. Boxes and whiskers indicate 25–75 and 10–90 percentiles, respectively. ***P < 0.001 (Mann–Whitney U‐test).
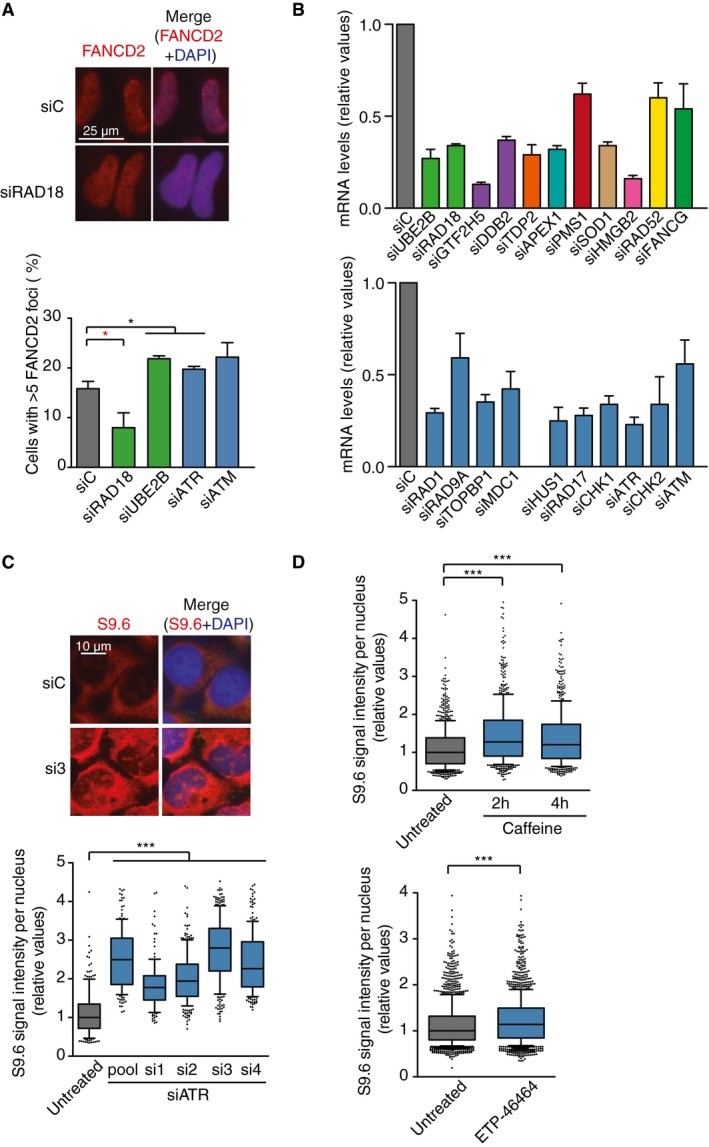
FANCD2 foci in HeLa cells depleted of the selected candidates. The mean of three independent experiments with at least 100 cells each was considered. *P < 0.05 (Mann–Whitney U‐test). Red stars denote significant decreases. Representative images are shown on top.
Relative mRNA levels of the indicated candidates as measured by RT–qPCR after siRNA depletion. Error bars represent relative target quantity (RQ) minimum and maximum from three technicals replicates.
Relative S9.6 signal intensity per nucleus after nucleolus signal removal in HeLa cells transfected with the indicated siRNAs. More than 130 total cells from three independent experiments were considered. The median of each population is shown. Boxes and whiskers indicate 25–75 and 10–90 percentiles, respectively. ***P < 0.001 (Mann–Whitney U‐test).
Relative S9.6 signal intensity per nucleus after nucleolus signal removal in HeLa cells transfected with the indicated siRNAs and treated with caffeine (10 mM, 2 or 4 h) or the ATR inhibitor ETP‐46464 (5 mM, 2 h). More than 600 total cells from five independent experiments were considered. The median of each population is shown. Boxes and whiskers indicate 25–75 and 10–90 percentiles, respectively. ***P < 0.001 (Mann–Whitney U‐test).
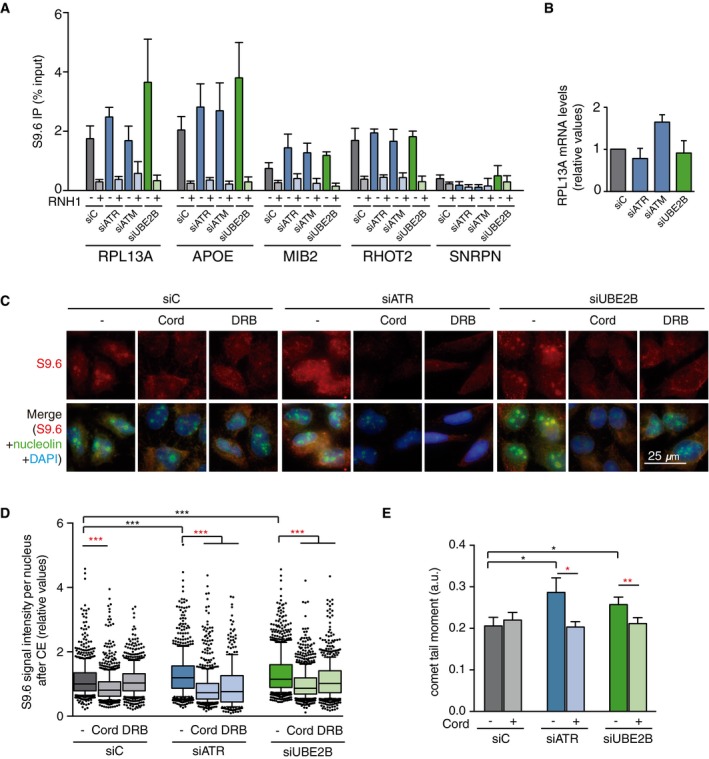
DRIP–qPCR signal values at RPL13A, APOE, MIB2, RHOT2, and SNRPN genes in HeLa cells transfected with the indicated siRNAs and treated in vitro with RNase H pre‐immunoprecipitation where indicated. The mean ± SEM from at least three independent experiments is shown.
Relative mRNA levels from the RPL13A gene in HeLa cells after transfection with the indicated siRNAs. The mean ± SEM from at least two independent experiments is shown.
Representative images of HeLa cells immunostained with S9.6 and nucleolin antibodies after transfection with the indicated siRNAs and after cytoplasm pre‐extraction (CE).
Relative S9.6 signal intensity per nucleus in HeLa cells transfected with the indicated siRNAs and treated with the transcription inhibitors 5,6‐dichloro‐1‐β‐D‐ribofuranosylbenzimidazole (DRB) or cordycepin (Cord). The median of the S9.6 signal intensity per nucleus relative to siC. Boxes and whiskers indicate 25–75 and 10–90 percentiles, respectively. More than 300 total cells from four independent experiments were considered. Values were normalized to the median of siC. ***P < 0.001 (Mann–Whitney U‐test). Black stars denote significant increases, whereas red stars denote significant decreases.
Tail moment from single‐cell alkaline gel electrophoresis (comet assay) of HeLa cells transfected with the indicated siRNAs and treated with the transcription inhibitor cordycepin (Cord). More than 250 total cells were considered. The mean ± SEM of the median from five independent experiments is shown. *P < 0.05, **P < 0.01 (one‐tailed unpaired t‐test). Black stars denote significant increases, whereas red stars denote significant decreases.
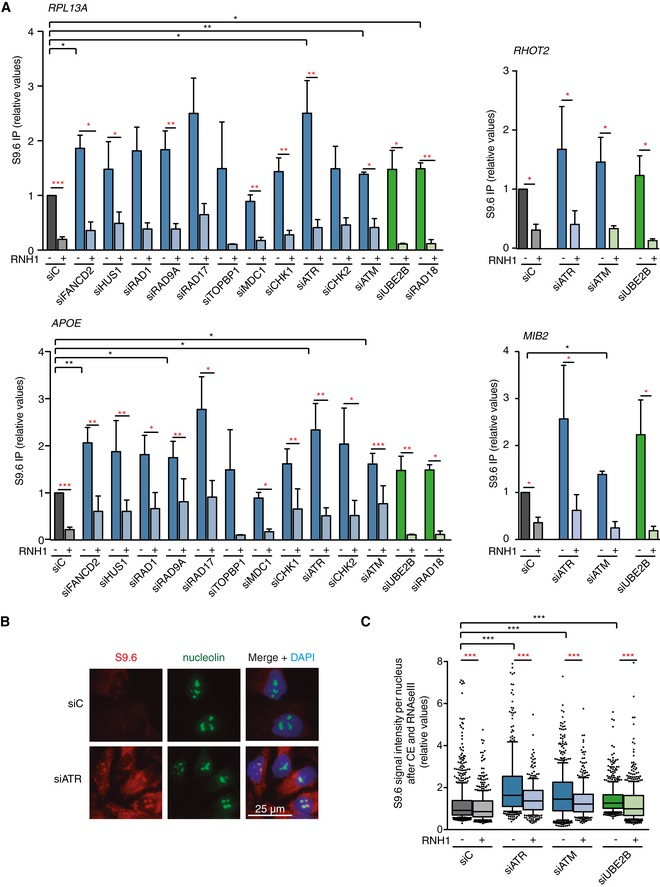
Relative DRIP–qPCR signal values at RPL13A, APOE, MIB2, and RHOT2 genes in HeLa cells transfected with the indicated siRNAs and treated in vitro with RNase H pre‐immunoprecipitation where indicated. The mean ± SEM from at least three independent experiments is shown. *P < 0.05, **P < 0.01, ***P < 0.001 (one‐tailed paired t‐test).
Representative images of immunostaining with S9.6 and anti‐nucleolin antibodies in HeLa cells transfected with the indicated siRNAs.
Relative S9.6 signal intensity per nucleus after nucleolus signal removal in HeLa cells after cytoplasm pre‐extraction (CE) and treated in vitro with RNase III and RNase H where indicated. More than 500 total cells from three independent experiments were considered. The median of each population is shown. Boxes and whiskers indicate 25–75 and 10–90 percentiles, respectively. ***P < 0.001 (Mann–Whitney U‐test).

Representative images of single‐cell alkaline gel electrophoresis (comet assay) of HeLa cells transfected with the indicated siRNAs and either pEGFP‐C1 (RNH1−) or pEGFP‐M27 (RNH1+).
Comet tail moment from single‐cell alkaline gel electrophoresis (comet assay) of HeLa cells transfected with the indicated siRNAs and either pEGFP‐C1 (RNH1−) or pEGFP‐M27 (RNH1+). More than 250 total cells were considered. The mean ± SEM of the median from at least three independent experiments is shown, except for RAD1, RAD17, and UBE2B (n = 2). *P < 0.05, **P < 0.01, ***P < 0.001 (one‐tailed unpaired t‐test). Black stars denote significant increases, whereas red stars denote significant decreases.
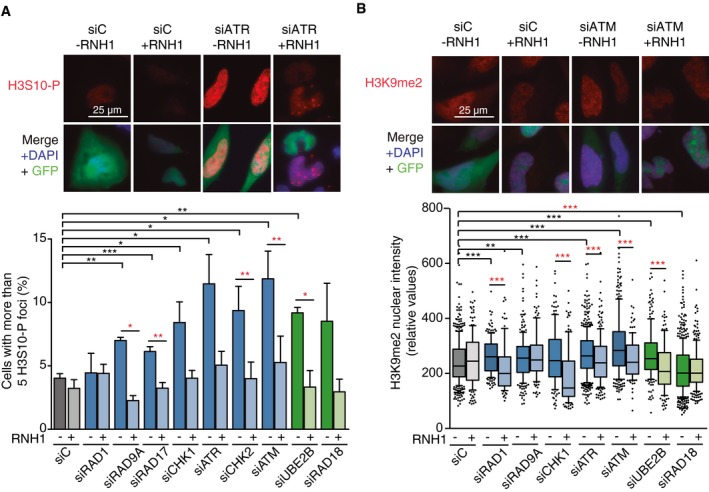
Representative images and percentage of HeLa cells with more than 5 H3S10‐P foci after transfection with the indicated siRNAs and either pEGFP‐C1 (RNH1−) or pEGFP‐M27 (RNH1+). Mitotic cells were excluded for the analysis by DAPI staining. More than 300 total cells were considered. Data represent mean ± SEM from three independent experiments.
Representative images and H3K9me2 nuclear signal intensity of HeLa cells transfected with the indicated siRNAs and either pEGFP‐C1 (RNH1−) or pEGFP‐M27 (RNH1+). At least three experiments were performed. The median of each population in a representative experiment with at least 100 cells per condition is shown. Boxes and whiskers indicate 25–75 and 10–90 percentiles, respectively.
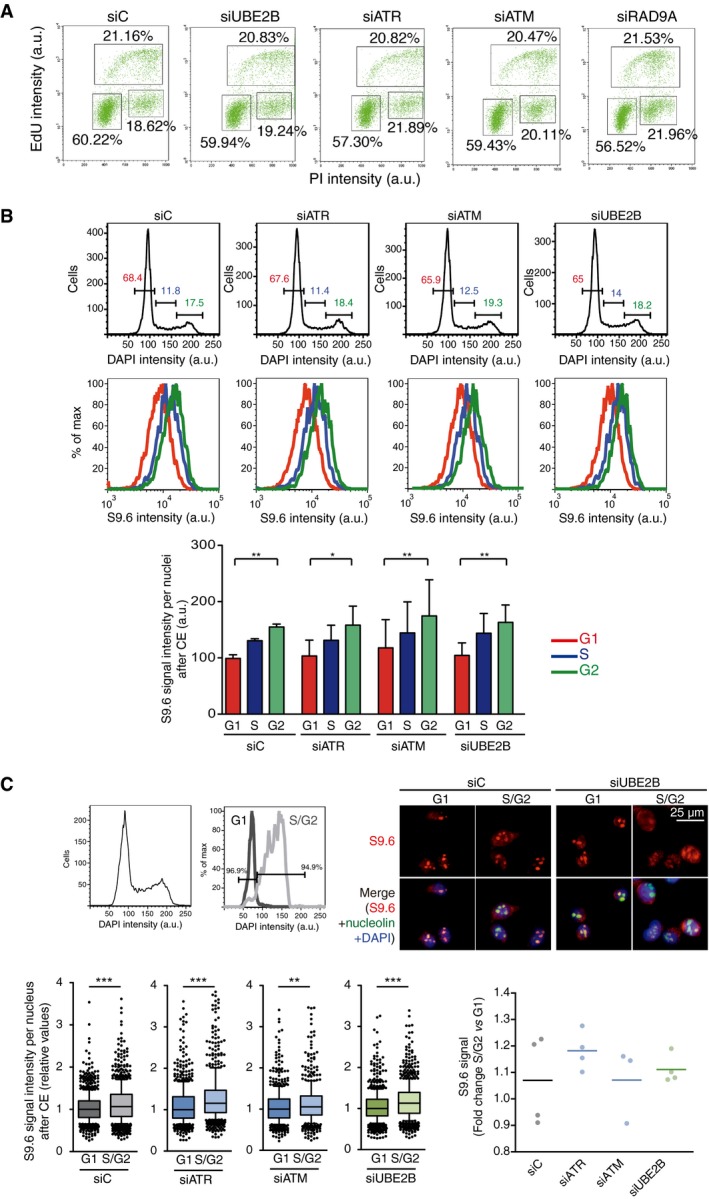
Flow cytometry profiles showing EdU incorporation versus DNA content in the indicated HeLa cells. The percentage of cells in S (upper box), G0/1 (lower left box), and G2/M (lower right box) are indicated.
Top row: flow cytometry histograms displaying the DNA content of the indicated HeLa cells after cytoplasm pre‐extraction (CE). G1 (red), S (blue), and G2 (green) phases are calculated from the profile. Bottom row: flow cytometry histograms depicting intensity of S9.6 signal in each phase of the cell cycle. Quantification is shown in panel below representing the mean ± SD of four experiments. *P < 0.05, **P < 0.01 (ANOVA test with Bonferroni's post‐test).
Top left panel: flow cytometry histogram showing the DNA content of cells before (left) and after (right) sorting by DAPI signal to obtain samples enriched in G1 and S/G2 populations. A representative experiment of control cells is shown. Top right panel: representative images of S9.6 staining of G1 and S/G2 sorted fractions in control and UBE2B‐depleted cells after cytoplasm pre‐extraction (CE). Bottom left panel: relative S9.6 intensity in G1 and S/G2‐sorted cells. Median values are indicated. Boxes and whiskers indicate 25–75 and 10–90 percentiles, respectively. At least three experiments, each with more than 150 cells per condition, were considered. Bottom right panel: fold change of S9.6 signal median values in S/G2 with respect to G1 sorted cells. **P < 0.01, ***P < 0.001 (Mann–Whitney U‐test).
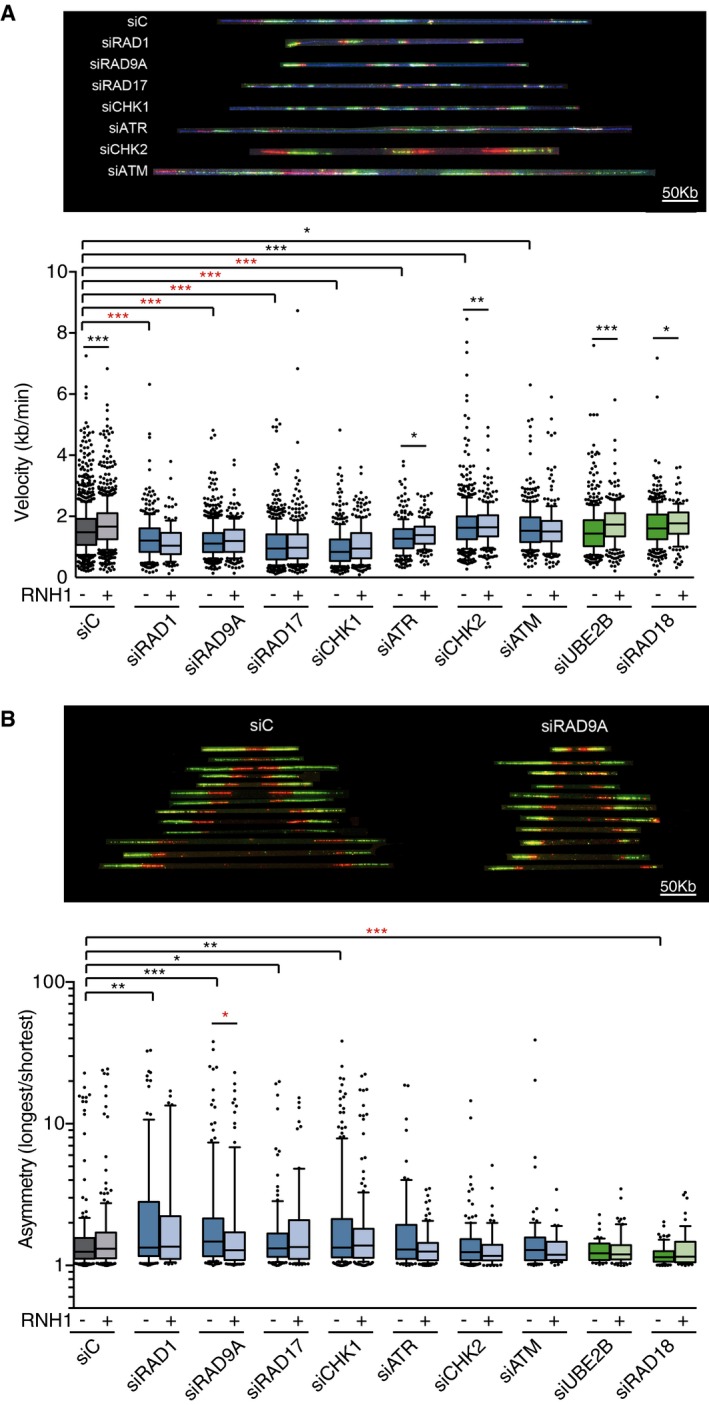
Fork velocity as measured by DNA combing assay in HeLa cells transfected with the indicated siRNAs and either pEGFP‐C1 (RNH1−) or pEGFP‐M27 (RNH1+). More than 200 tracks were considered except for RAD1 + RNH1 (n = 125), ATR +RNH1 (n = 182), and RAD18 + RNH1 (n = 146).
Fork asymmetry as measured by DNA combing assay in HeLa cells transfected with the indicated siRNAs and either pEGFP‐C1 (RNH1−) or pEGFP‐M27 (RNH1+). From 40 to 200 total measurements were considered for each candidate.
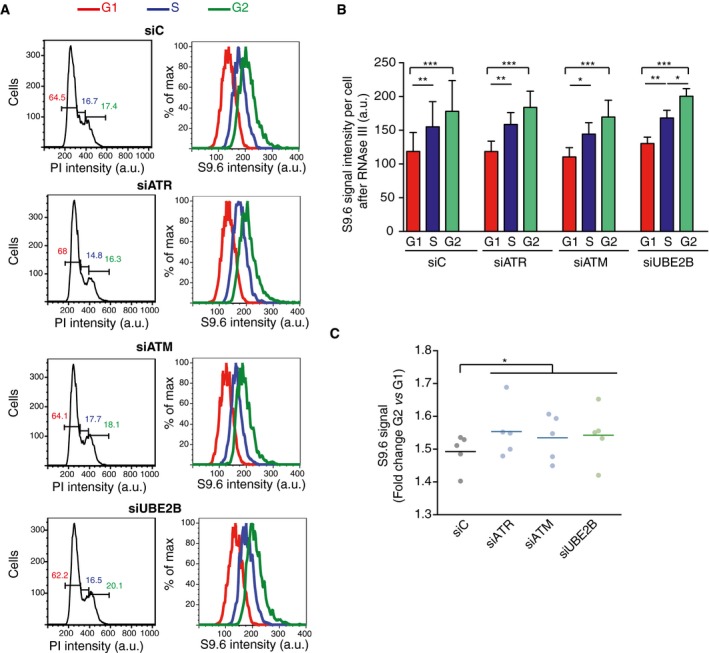
Left column: flow cytometry profiles showing DNA content of the indicated RNase III‐treated cells. G1 (red), S (blue), and G2 (green) phases were calculated from the profile. Right column: flow cytometry histograms depicting intensity of S9.6 signals in each phase of the cell cycle for the indicated cells.
Quantification of panel (A). The mean ± SD of the S9.6 mean intensity of five experiments is shown. ***P < 0.001, **P < 0.01, *P < 0.05 (repeated measures ANOVA test with Bonferroni's post‐test).
Graph represents fold change of S9.6 mean signal in G2 with respect to G1 cells. Values for five independent experiments together with the mean are shown. *P < 0.05 (one‐tailed paired t‐test).
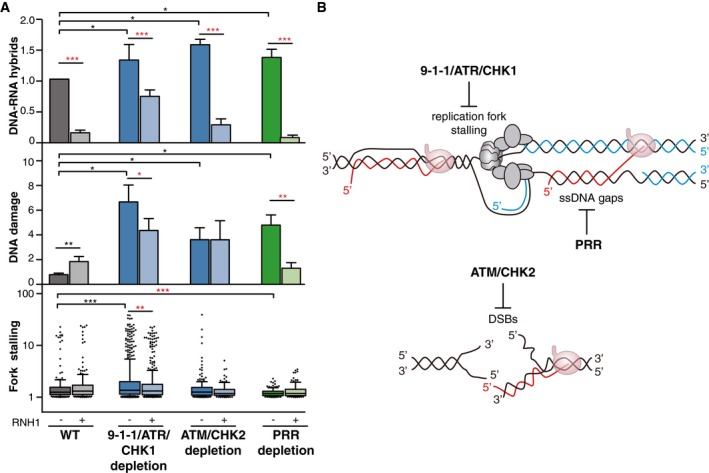
DNA–RNA hybrids, DNA damage, and fork stalling in 9‐1‐1/ATR/CHK1, ATM/CHK2, and PRR‐deficient cells. DNA–RNA hybrids represent the mean ± SEM of all the DRIP data from Fig 2A. ***P < 0.001, *P < 0.05 (paired t‐test). DNA damage represents the mean of medians ± SEM of all the comet tail moment data from Fig 3B. **P < 0.01, *P < 0.05 (paired t‐test). Fork stalling represents the median, 25–75 (boxes) and 10–90 percentiles (whiskers) of all the fork asymmetry data from Fig 5B. ***P < 0.001, **P < 0.01 (Mann–Whitney U‐test). Black stars denote significant increases, whereas red stars denote significant decreases.
A model to show that spontaneous DNA–RNA hybrids impairing replication fork progression would require the 9‐1‐1/ATR/CHK1 for dissolution. Additionally, unrepaired DSBs (accumulated as a consequence of ATM/CHK2 depletion) and post‐replicative ssDNA gaps (present in PRR‐defective cells) could favor DNA–RNA hybrid accumulation without stalling replication forks.
References
-
- Aguilera A, Garcia‐Muse T (2012) R loops: from transcription byproducts to threats to genome stability. Mol Cell 46: 115–124 - PubMed
-
- Santos‐Pereira JM, Aguilera A (2015) R loops: new modulators of genome dynamics and function. Nat Rev Genet 16: 583–597 - PubMed
-
- Huertas P, Aguilera A (2003) Cotranscriptionally formed DNA:RNA hybrids mediate transcription elongation impairment and transcription‐associated recombination. Mol Cell 12: 711–721 - PubMed
Publication types
MeSH terms
Substances
Grants and funding
LinkOut - more resources
Full Text Sources
Research Materials
Miscellaneous
