. 2020 Jan;72(1):166-178.
doi: 10.1002/art.41052. Epub 2019 Nov 29.

Activated M2 Macrophages Contribute to the Pathogenesis of IgG4-Related Disease via Toll-like Receptor 7/Interleukin-33 Signaling

Affiliations

Activated M2 Macrophages Contribute to the Pathogenesis of IgG4-Related Disease via Toll-like Receptor 7/Interleukin-33 Signaling

Noriko Ishiguro et al. Arthritis Rheumatol. 2020 Jan.

Abstract

Objective: IgG4-related disease (IgG4-RD) is a unique inflammatory disorder in which Th2 cytokines promote IgG4 production. In addition, recent studies have implicated the Toll-like receptor (TLR) pathway. This study was undertaken to examine the expression of TLRs in salivary glands (SGs) from patients with IgG4-RD.

Methods: SGs from 15 patients with IgG4-RD, 15 patients with Sjögren's syndrome (SS), 10 patients with chronic sialadenitis, and 10 healthy controls were examined histologically. TLR family gene expression (TLR-1 through TLR-10) was analyzed by DNA microarray in the submandibular glands (SMGs). Up-regulation of TLRs was confirmed in SGs from patients with IgG4-RD. Finally, the phenotype of human TLR-7 (huTLR-7)-transgenic C57BL/6 mice was assessed before and after stimulation with TLR agonist.

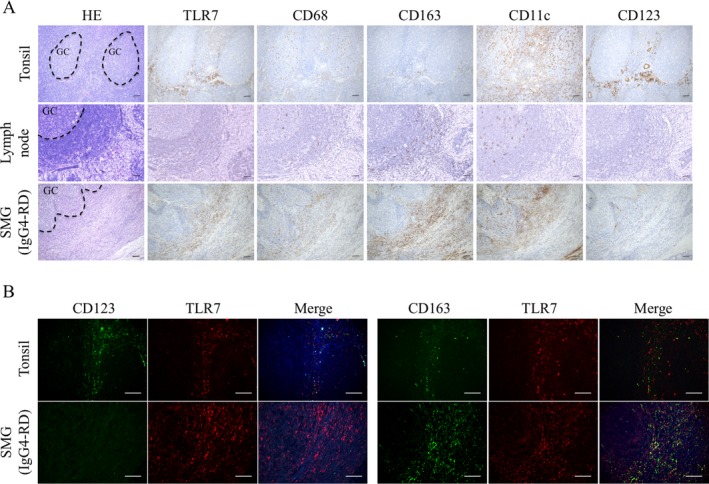
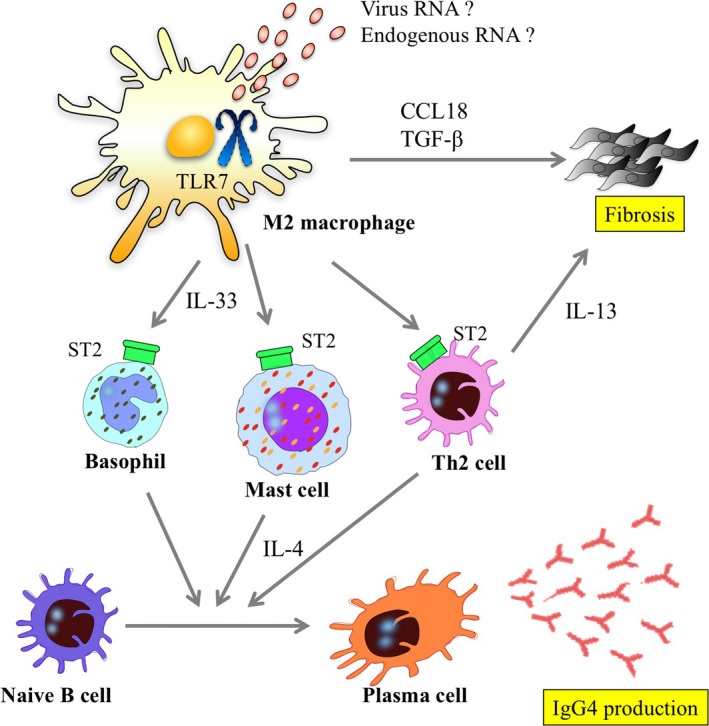
Results: In patients with IgG4-RD, TLR-4, TLR-7, TLR-8, and TLR-9 were overexpressed. Polymerase chain reaction validated the up-regulation of TLR-7 in IgG4-RD compared with the other groups. Immunohistochemical analysis confirmed strong infiltration of TLR-7-positive cells in the SGs of patients with IgG4-RD. Double immunohistochemical staining showed that TLR-7 expression colocalized with CD163+ M2 macrophages. After in vitro stimulation with a TLR-7 agonist, CD163+ M2 macrophages produced higher levels of interleukin-33 (IL-33), which is a Th2-activating cytokine. In huTLR-7-transgenic mice, the focus and fibrosis scores in SMGs, pancreas, and lungs were significantly higher than those in wild-type mice (P < 0.05). Moreover, the concentration of serum IgG, IgG1, and IL-33 in huTLR-7-transgenic mice was distinctly increased upon stimulation with a TLR-7 agonist (P < 0.05).

Conclusion: TLR-7-expressing M2 macrophages may promote the activation of Th2 immune responses via IL-33 secretion in IgG4-RD.


Figures

Figure 1
Figure 1
Toll‐like receptor (TLR)–related gene expression patterns in salivary glands (SGs) from patients with IgG4‐related disease (IgG4‐RD). A, Heatmap depicting differentially expressed TLR‐related genes in submandibular glands (SMGs) from patients with IgG4‐RD (n = 6), patients with chronic sialadenitis (CS; n = 3), and healthy controls (HCs; n = 3). Only genes up‐regulated or down‐regulated by at least 2‐fold are shown. B, Quantitative polymerase chain reaction analysis of TLR‐4, TLR‐7, TLR‐8, and TLR‐9 in SGs from healthy controls (n = 10), patients with chronic sialadenitis (n = 10), patients with Sjögren's syndrome (SS; n = 15), and patients with IgG4‐RD (n = 15). Bars show the mean ± SD. * = P < 0.05; ** = P < 0.01 by Kruskal‐Wallis test. NS = not significant. C, Distribution of candidate TLRs in SMGs from representative healthy controls and patients with chronic sialadenitis, patients with SS, and patients with IgG4‐RD. Sections were stained with hematoxylin and eosin (H&E) and for TLR‐4, TLR‐7, TLR‐8, and TLR‐9. Outlined area indicates a germinal center (GC). Mayer's hematoxylin (blue) counterstained; bars = 100 μm.
Figure 2
Figure 2
Identification of TLR‐7–expressing cells in SMGs from patients with IgG4‐RD and in normal secondary lymphoid organs from patients with oral squamous cell carcinoma. A, Staining of serial sections of normal tonsil, normal lymph node, and IgG4‐RD SMGs with H&E, and for TLR‐7, CD68 as a marker of both M1 and M2 macrophages, CD163 as a marker of M2 macrophages, CD11c as a marker of myeloid dendritic cells, and CD123 as a marker of plasmacytoid dendritic cells. Outlined areas indicate GCs. Mayer's hematoxylin (blue) counterstained; bars = 100 μm. B, Double immunostaining for TLR‐7 (red), CD123 (green), and CD163 (green) in normal tonsil and SMGs from representative patients with IgG4‐RD. DAPI (blue) counterstained; bars = 50 μm. See Figure 1 for definitions.
Figure 3
Figure 3
Expression of interleukin‐33 (IL‐33) and candidate TLRs in SGs from patients with IgG4‐RD. A, Expression levels of mRNA for IL‐33 in SGs from healthy controls (n = 10), patients with chronic sialadenitis (n = 10), patients with SS (n = 15), and patients with IgG4‐RD (n = 15). B, Distribution of IL‐33 in SGs from a representative healthy control, patient with chronic sialadenitis, patient with SS, and patient with IgG4‐RD. Mayer's hematoxylin (blue) counterstained; bars = 100 μm. C, Correlation between expression levels of IL‐33 mRNA and candidate TLRs in SGs from patients with IgG4‐RD (n = 15), as determined by Spearman's rank correlation test. D, Schematic illustration of the extraction of CD163+ M2 macrophages stimulated with TLR‐7 agonist R848. Cells were cultivated as described in Patients and Methods. PBMC = peripheral blood mononuclear cell. E, Production of IL‐33 by CD163+ M2 macrophages stimulated with R848, as determined by enzyme‐linked immunosorbent assay. IL‐33 levels increased in a concentration‐dependent manner. In A and E, bars show the mean ± SD. * = P < 0.05; ** = P < 0.01 by Kruskal‐Wallis test. See Figure 1 for other definitions.
Figure 4
Figure 4
Pathologic and serologic findings in human TLR‐7–transgenic/mouse TLR‐7–deficient (huTLR‐7–transgenic/mTLR‐7−/−) mice on a C57BL/6 background. A, A wild‐type (WT) C57BL/6 mouse and an huTLR‐7–transgenic/mTLR‐7−/− (transgenic [Tg]) mouse at 4 weeks old. B, Weight of SMGs, kidneys, lungs, and liver in 4‐week‐old WT mice (n = 5) and transgenic mice (n = 5). Bars show the mean ± SD. C, H&E‐stained sections of SMGs, pancreas, kidneys, lungs, and liver from representative WT and transgenic mice. Bars = 100 μm. D, Focus score for each organ in WT mice (n = 5) and transgenic mice (n = 5). The focus score was estimated as described in Patients and Methods. Bars show the mean ± SD. HPF = high‐power field. E, Masson's trichrome–stained sections of SMGs, pancreas, kidneys, lungs, and liver from representative WT and transgenic mice. Masson's trichrome was used to stain nuclei (purple), cytoplasm (red), and collagen (connective or fibrotic tissue; blue) Bars = 100 μm. F, Fibrosis score for each organ in WT mice (n = 5) and transgenic mice (n = 5). The fibrosis score was calculated from Masson's trichrome staining as described in Patients and Methods. Bars show the mean ± SD. G, Serum IgG, IgG1, and IgG2a levels in WT mice (n = 10) and transgenic mice (n = 10), as determined by enzyme‐linked immunosorbent assay. Symbols represent individual mice; horizontal lines show the mean. * = P < 0.05; **= P < 0.01 by Mann‐Whitney U test. See Figure 1 for other definitions.
Figure 5
Figure 5
Effects of TLR‐7 agonist R848 in transgenic mice. A, Detection of GFP in bone marrow–derived macrophages (BMMs) from mTLR‐7−/− (knockout [KO]) mice and transgenic (Tg) mice by flow cytometric analysis, after staining with anti‐CD11b antibody. At least 2 independent experiments were performed. B, Interleukin‐6 (IL‐6) and IL‐12p40 levels in BMMs from knockout mice and transgenic mice left unstimulated or stimulated with R848. After 24 hours of incubation, IL‐6 and IL‐12p40 were detected in culture medium by enzyme‐linked immunosorbent assay (ELISA). Results are from triplicate wells. At least 2 independent experiments were performed. C, Weight of SMGs, kidneys, lungs, and liver in 8‐week‐old knockout, wild‐type (WT), and transgenic mice treated with topical R848 for 4 weeks (n = 8 per group). D and F, H&E‐stained (D) and Masson's trichrome–stained (F) sections of SMGs, pancreas, kidneys, lungs, and liver from representative 8‐week‐old R848‐treated knockout, WT, and transgenic mice. Bars = 100 μm. E and G, Focus score (E) and fibrosis score (G) for each organ in 8‐week‐old knockout, WT, and transgenic mice left untreated or treated with R848 (n = 8 per group). The fibrosis score was calculated from Masson's trichrome staining as described in Patients and Methods. HPF = high‐power field. H, Serial sections of SMGs from a representative 8‐week‐old R848‐treated transgenic mouse, stained with H&E and for IgG1, TLR‐7, CD206, CD317, and IL‐33. Mayer's hematoxylin (blue) counterstained; bars = 100 μm. I, Serum IgG, IgG1, and IgG2a levels in knockout, WT, and transgenic mice (n = 10 per group) before and after R848 treatment, as determined by ELISA. Symbols represent individual mice; horizontal lines show the mean. J, Serum IL‐33 levels, determined by ELISA, in knockout, WT, and transgenic mice left untreated or treated with R848 (n = 10 per group). In B, C, E, G, and J, bars show the mean ± SD. * = P < 0.05; ** = P < 0.01 by Mann‐Whitney U test in E and G; by Kruskal‐Wallis test in C, I and J. See Figure 1 for other definitions.
Figure 6
Figure 6
Schematic model of the role of Toll‐like receptor 7 (TLR‐7)–positive M2 macrophages in the initiation of Ig4‐related disease. TLR‐7 expressed on M2 macrophages recognize some RNA viruses or self RNA from apoptotic cells. Activated M2 macrophages secrete interleukin‐33 (IL‐33) and promote production of Th2 cytokines that lead to IgG4 class‐switching and fibrosis. TGFβ = transforming growth factor β.

References

    1. Hamano H, Kawa S, Horiuchi A, Unno H, Furuya N, Akamatsu T, et al. High serum IgG4 concentrations in patients with sclerosing pancreatitis. N Engl J Med 2001;344:732–8. - PubMed
    1. Umehara H, Okazaki K, Masaki Y, Kawano M, Yamamoto M, Saeki T, et al. A novel clinical entity, IgG4‐related disease (IgG4RD): general concept and details. Mod Rheumatol 2012;22:1–14. - PMC - PubMed
    1. Stone JH, Zen Y, Deshpande V. IgG4‐related disease. N Engl J Med 2012;366:539–51. - PubMed
    1. Nirula A, Glaser SM, Kalled SL, Taylor FR. What is IgG4? A review of the biology of a unique immunoglobulin subtype. Curr Opin Rheumatol 2011;23:119–24. - PubMed
    1. Finkelman FD, Boyce JA, Vercelli D, Rothenberg ME. Key advances in mechanisms of asthma, allergy, and immunology in 2009. J Allergy Clin Immunol 2010;125:312–8. - PubMed

Publication types

MeSH terms