. 2019 Jul;127(7):77007.
doi: 10.1289/EHP4438. Epub 2019 Jul 24.

Mortality Risk and Fine Particulate Air Pollution in a Large, Representative Cohort of U.S. Adults

Affiliations

Mortality Risk and Fine Particulate Air Pollution in a Large, Representative Cohort of U.S. Adults

C Arden Pope 3rd et al. Environ Health Perspect. 2019 Jul.

Erratum in

Abstract

Background: Evidence indicates that air pollution contributes to cardiopulmonary mortality. There is ongoing debate regarding the size and shape of the pollution–mortality exposure–response relationship. There are also growing appeals for estimates of pollution–mortality relationships that use public data and are based on large, representative study cohorts.

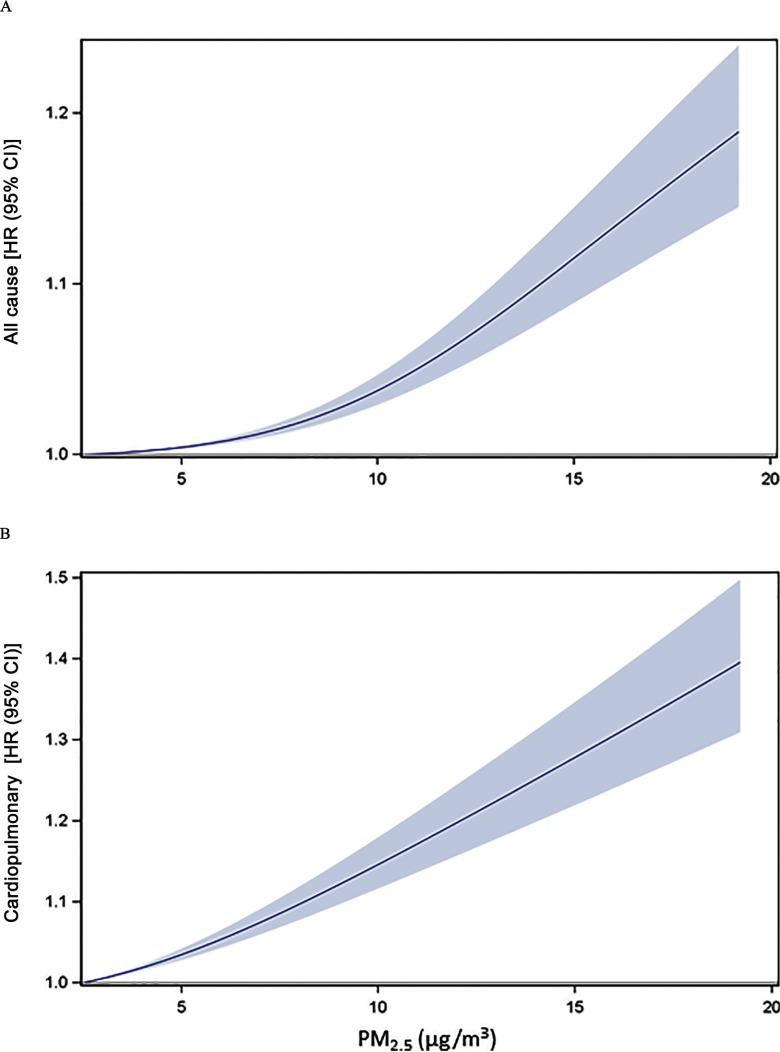
Objectives: Our goal was to evaluate fine particulate matter air pollution ([Formula: see text]) and mortality using a large cohort that is representative of the U.S. population and is based on public data. Additional objectives included exploring model sensitivity, evaluating relative effects across selected subgroups, and assessing the shape of the [Formula: see text]–mortality relationship.

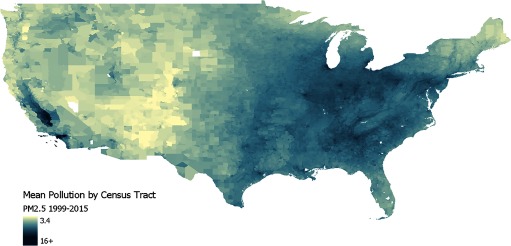
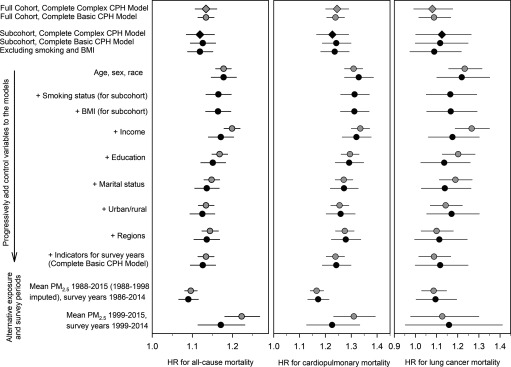
Methods: National Health Interview Surveys (1986–2014), with mortality linkage through 2015, were used to create a cohort of 1,599,329 U.S. adults and a subcohort with information on smoking and body mass index (BMI) of 635,539 adults. Data were linked with modeled ambient [Formula: see text] at the census-tract level. Cox proportional hazards models were used to estimate [Formula: see text]–mortality hazard ratios for all-cause and specific causes of death while controlling for individual risk factors and regional and urban versus rural differences. Sensitivity and subgroup analyses were conducted and the shape of the [Formula: see text]–mortality relationship was explored.

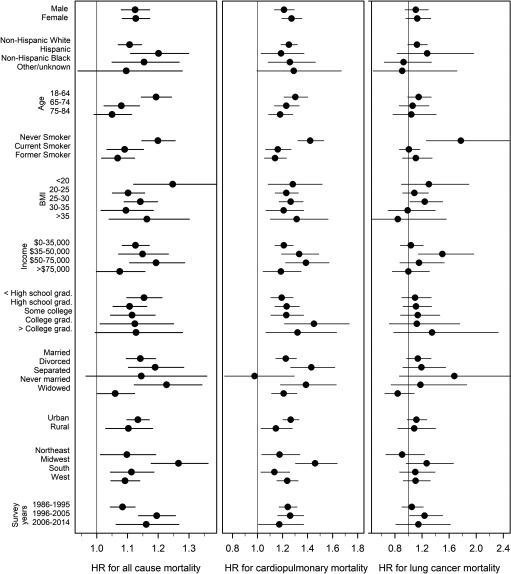
Results: Estimated mortality hazard ratios, per [Formula: see text] long-term exposure to [Formula: see text], were 1.12 (95% CI: 1.08, 1.15) for all-cause mortality, 1.23 (95% CI: 1.17, 1.29) for cardiopulmonary mortality, and 1.12 (95% CI: 1.00, 1.26) for lung cancer mortality. In general, [Formula: see text]–mortality associations were consistently positive for all-cause and cardiopulmonary mortality across key modeling choices and across subgroups of sex, age, race-ethnicity, income, education levels, and geographic regions.

Discussion: This large, nationwide, representative cohort of U.S. adults provides robust evidence that long-term [Formula: see text] exposure contributes to cardiopulmonary mortality risk. The ubiquitous and involuntary nature of exposures and the broadly observed effects across subpopulations underscore the public health importance of breathing clean air. https://doi.org/10.1289/EHP4438.


Figures

Figure 1 is a map of the United States showing mean pollution by U.S. Census Tract (average concentrations of PM subscript 2.5 ranging between 3.4 and 16 and above) from 1999 to 2015.
Figure 1.
Average concentrations of PM2.5 pollution (μg/m3) by 2010 U.S. Census tracts in the continental United States, 1999–2015. PM2.5, particulate matter <2.5μm in aerodynamic diameter.
Figure 2 shows three forest plots, plotting results from sensitivity analyses using stepwise inclusion of control variables into the models, alternative exposure windows, and survey periods (y-axis). Hazard ratios and 95% confidence intervals are shown for all-cause mortality (ranging between 1.0 and 1.2 with increments of 0.1), for cardiopulmonary mortality (ranging between 1.0 and 1.4 with increments of 0.1), and for lung cancer mortality (ranging between 0.9 and 1.4 with increments of 0.1) (x-axis).
Figure 2.
Illustration of model sensitivity analysis. Hazard ratios (and 95% CIs) associated with 10μg/m3 PM2.5 estimated from various models are presented. Gray and black symbols indicate models that use the full cohort and subcohort, respectively. Diamonds indicate complex CPH models that control for the complex survey design, whereas circles indicate models that use the basic CPH models. Cause-of-death groupings are based on ICD-10 codes. Cardiopulmonary disease includes cardiovascular disease (I00–I09, I11, I13, I20–I51), cerebrovascular disease (I60–I69), chronic lower respiratory disease (J40–J47), and influenza and pneumonia (J09–J18). Lung cancer includes C33–C34. CI, confidence interval; CPH, Cox proportional hazards (regression model); HR, hazard ratio; PM2.5, particulate matter <2.5μm in aerodynamic diameter; ICD-10, International Statistical Classification of Diseases, Injuries, and Causes of Death, Tenth Revision.
Figure 3 shows three forest plots, plotting hazard ratios and 95% confidence intervals for key analysis variables (y-axis) for all-cause mortality (ranging between 1.0 and 1.3 with increments of 0.1), for cardiopulmonary mortality (ranging between 0.8 and 1.8 with increments of 0.2), and for lung cancer mortality (ranging between 0.8 and 2.4 with increments of 0.4) (x-axis).
Figure 3.
Illustration of stratified analysis for the subcohort. Hazard ratios (and 95% CIs) associated with 10μg/m3 PM2.5 estimated from the basic CPH model are presented by sex, race-ethnicity, age, smoking status, BMI, income, education, marital status, rural/urban, census regions, and survey years. All stratified estimates are adjusted for remaining covariates. Cause-of-death groupings are based on ICD-10 codes. Cardiopulmonary disease includes cardiovascular disease (I00–I09, I11, I13, I20–I51), cerebrovascular disease (I60–I69), chronic lower respiratory disease (J40–J47), and influenza and pneumonia (J09–J18). Lung cancer includes C33–C34. BMI, body mass index; CI, confidence interval; CPH, Cox proportional hazards (regression model); HR, hazard ratio; PM2.5, particulate matter <2.5μm in aerodynamic diameter; ICD-10, International Statistical Classification of Diseases, Injuries, and Causes of Death, Tenth Revision.
Figure 4 shows two line graphs, plotting estimated concentration-response functions and associated 95% confidence interval bounds for all-cause mortality and cardiopulmonary mortality (ranging between 1.0 and 1.2 with increments of 0.1 and between 1.0 and 1.5 with increments of 0.1, respectively) (y-axis) across PM subscript 2.5 (ranging between 5 and 20 micrograms per cubic meter with increments of 5) (x-axis).
Figure 4.
Estimated concentration–response associations between PM2.5 and all-cause (A) and cardiopulmonary (B) mortality using the subcohort and basic CPH model with the flexible modeling approach, adjusting for age, sex, race-ethnicity, income, education, marital status, urban versus rural, census regions, survey year, smoking status, and BMI. The optimal nonlinear models are presented as solid lines with 95% uncertainty bounds (shaded area). Cause-of-death groupings are based on ICD-10 codes. Cardiopulmonary disease includes cardiovascular disease (I00–I09, I11, I13, I20–I51), cerebrovascular disease (I60–I69), chronic lower respiratory disease (J40–J47), and influenza and pneumonia (J09–J18). BMI, body mass index; CI, confidence interval; CPH, Cox proportional hazards (regression model); HR, hazard ratio; ICD-10, International Statistical Classification of Diseases, Injuries, and Causes of Death, Tenth Revision; PM2.5, particulate matter <2.5μm in aerodynamic diameter.

Comment in

References

    1. Beelen R, Raaschou-Nielsen O, Stafoggia M, Andersen ZJ, Weinmayr G, Hoffmann B, et al. . 2014. Effects of long-term exposure to air pollution on natural-cause mortality: an analysis of 22 European cohorts within the multicentre ESCAPE project. Lancet 383(9919):785–795, PMID: 24332274, 10.1016/S0140-6736(13)62158-3. - DOI - PubMed
    1. Bentayeb M, Wagner V, Stempfelet M, Zins M, Goldberg M, Pascal M, et al. . 2015. Association between long-term exposure to air pollution and mortality in France: a 25-year follow-up study. Environ Int 85:5–14, PMID: 26298834, 10.1016/j.envint.2015.08.006. - DOI - PubMed
    1. Brook RD, Rajagopalan S, Pope CA III, Brook JR, Bhatnagar A, Diez-Roux AV, et al. . 2010. Particulate matter air pollution and cardiovascular disease: an update to the scientific statement from the American Heart Association. Circulation 121(21):2331–2378, PMID: 20458016, 10.1161/CIR.0b013e3181dbece1. - DOI - PubMed
    1. Carey IM, Atkinson RW, Kent AJ, van Staa T, Cook DG, Anderson HR. 2013. Mortality associations with long-term exposure to outdoor air pollution in a national English cohort. Am J Respir Crit Care Med 187(11):1226–1233, PMID: 23590261, 10.1164/rccm.201210-1758OC. - DOI - PMC - PubMed
    1. Cesaroni G, Badaloni C, Gariazzo C, Stafoggia M, Sozzi R, Davoli M, et al. . 2013. Long-term exposure to urban air pollution and mortality in a cohort of more than a million adults in Rome. Environ Health Perspect 121(3):324–331, PMID: 23308401, 10.1289/ehp.1205862. - DOI - PMC - PubMed

Publication types