. 2019 Jul 24:8:e47177.
doi: 10.7554/eLife.47177.

Characterizing functional pathways of the human olfactory system

Affiliations

Characterizing functional pathways of the human olfactory system

Guangyu Zhou et al. Elife. .

Abstract

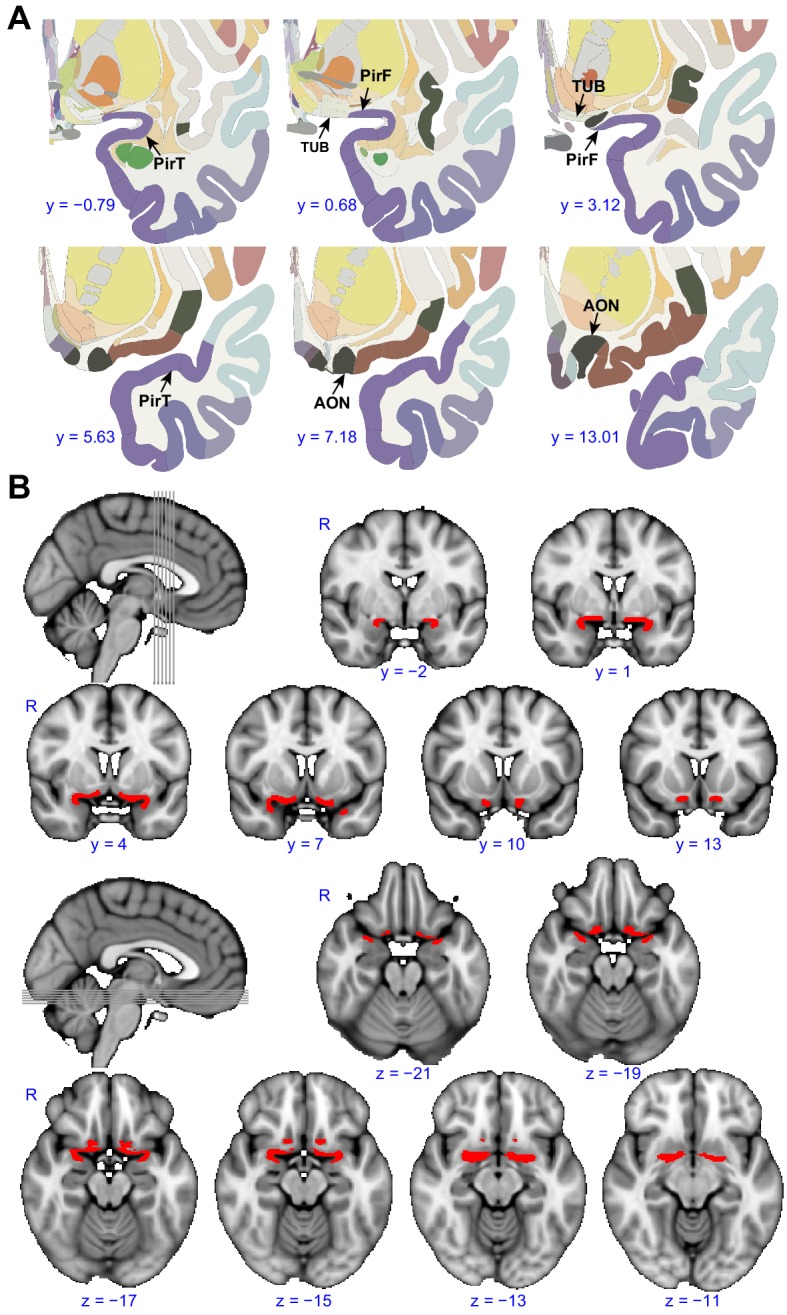
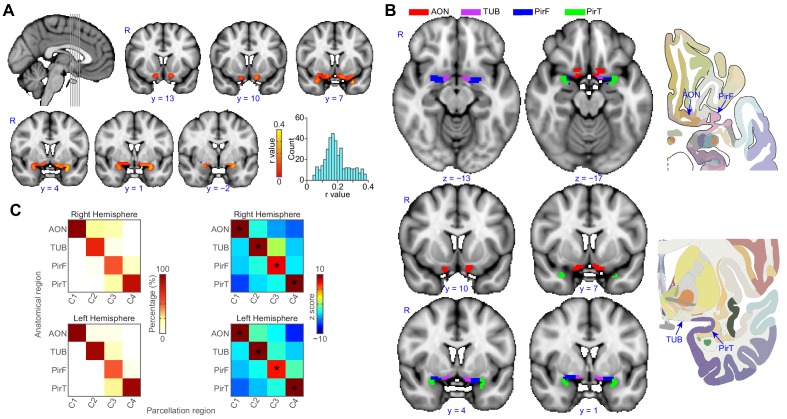
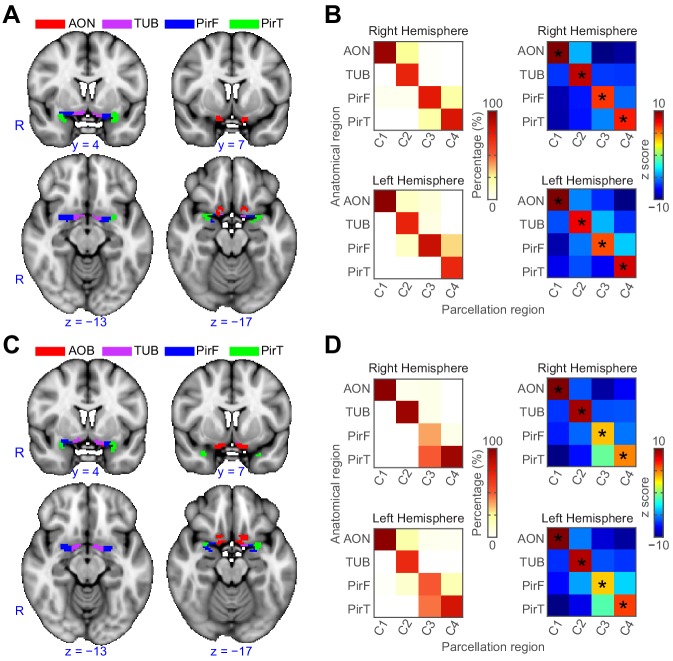
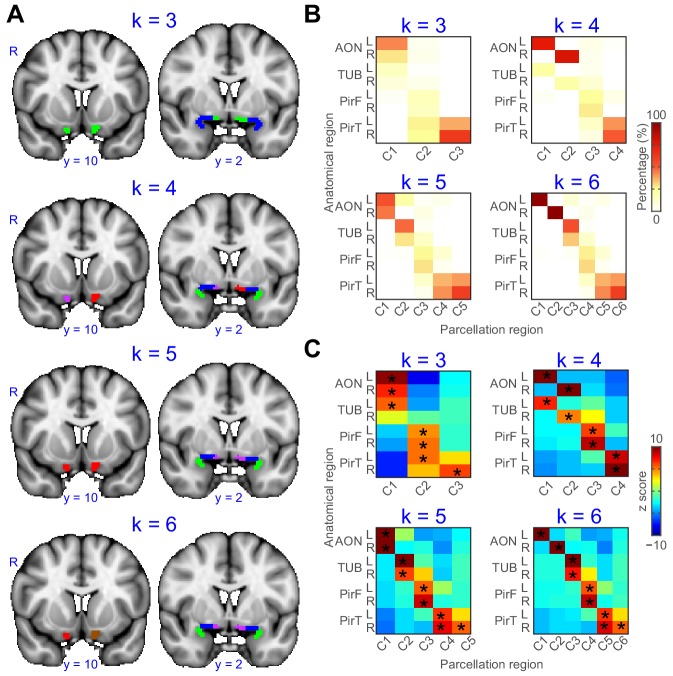
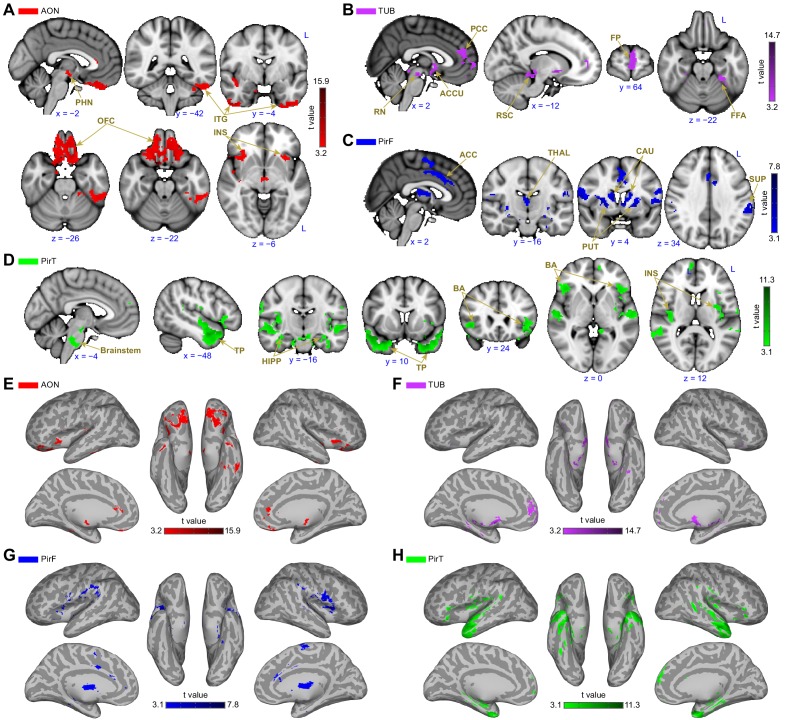
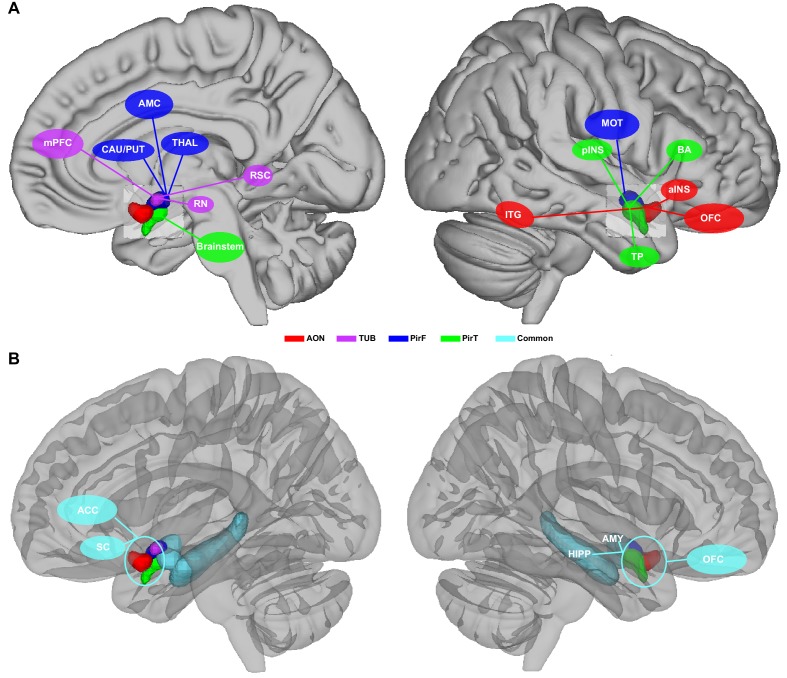
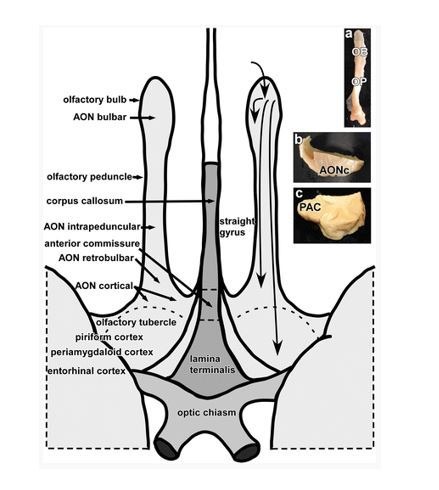
The central processing pathways of the human olfactory system are not fully understood. The olfactory bulb projects directly to a number of cortical brain structures, but the distinct networks formed by projections from each of these structures to the rest of the brain have not been well-defined. Here, we used functional magnetic resonance imaging and k-means clustering to parcellate human primary olfactory cortex into clusters based on whole-brain functional connectivity patterns. Resulting clusters accurately corresponded to anterior olfactory nucleus, olfactory tubercle, and frontal and temporal piriform cortices, suggesting dissociable whole-brain networks formed by the subregions of primary olfactory cortex. This result was replicated in an independent data set. We then characterized the unique functional connectivity profiles of each subregion, producing a map of the large-scale processing pathways of the human olfactory system. These results provide insight into the functional and anatomical organization of the human olfactory system.

Keywords: computational biology; functional connectivity; human; neuroscience; olfaction; primary olfactory cortex; systems biology.


Conflict of interest statement

GZ, GL, SC, CZ No competing interests declared, TK Reviewing editor, eLife

Figures

Figure 1.
Figure 1.. Region of interest.
(A) Panels show examples from the human brain atlas used to define the region of interest used in the parcellation analysis. Relevant areas include the anterior olfactory nucleus (AON), olfactory tubercle (TUB), and frontal (PirF) and temporal (PirT) piriform cortex (Mai et al., 2015). (B) The region of interest shown overlaid on the FSL’s MNI152_T1_1mm_brain. The coronal and axial slices correspond to the vertical and horizontal lines on the sagittal slice respectively. R, right hemisphere.
Figure 2.
Figure 2.. Parcellation of human left and right primary olfactory cortex.
(A) Inter-subject stability of functional connectivity patterns. The correlation of the functional connectivity patterns between each subject and all other subjects was calculated for each voxel using a leave-one-out method. The coronal slices, corresponding to the vertical lines on the sagittal slice, show the average stability map. The bar plot shows the histogram of the correlation values. (B) k-means (k = 4) clustering results shown on the FSL’s MNI152_T1_1mm_brain. The right column shows one axial and one coronal slice of the Atlas (Mai et al., 2015). (C) Parcellation accuracy of each subregion. Left column: proportion of voxels from each parcellation subdivision located within each anatomical subregion. Right column: z score of the proportion maps. * indicates p<0.001 (false discovery rate corrected). R, right hemisphere; AON, anterior olfactory tubercle; TUB, olfactory tubercle; PirF, frontal piriform cortex; PirT, temporal piriform cortex.
Figure 2—figure supplement 1.
Figure 2—figure supplement 1.. Replication analyses.
(A–B) k-means (k = 4) clustering results from the region-of-interest that was outlined independently by one of the co-authors. The parcellation accuracy of each subregion is shown in panel B. (C–D) k-means (k = 4) clustering results from an independent dataset collected for a previous study. The parcellation accuracy is shown in panel D. In panels A and C, the background is the FSL’s MNI152_T1_1mm_brain. In panels B and D, left column: proportion of voxels from each parcellation subdivision located within each anatomical subregion; right column: z score of the proportion maps. * indicates p<0.001 (false discovery rate corrected). R, right hemisphere; AON, anterior olfactory tubercle; TUB, olfactory tubercle; PirF, frontal piriform cortex; PirT, temporal piriform cortex.
Figure 2—figure supplement 2.
Figure 2—figure supplement 2.. Example sagittal slice from one fMRI volume for each subject (S1–S25).
Figure 3.
Figure 3.. Parcellation of primary olfactory cortex combined across left and right hemispheres.
(A) k-means clustering results shown on the FSL’s MNI152_T1_1mm_brain for k = 3 to 6. Each color represents one cluster. (B) Proportion of voxels of each parcellation subdivision within each anatomical subregion. (C) z score of the proportion maps in panel B. * indicates p<0.001 (false discovery rate corrected). L, left hemisphere; R, right hemisphere; AON, anterior olfactory tubercle; TUB, olfactory tubercle; PirF, frontal piriform cortex; PirT, temporal piriform cortex.
Figure 4.
Figure 4.. Subregion-specific functional connectivity patterns.
(A–D) Brain regions that are uniquely positively connected to each of the primary olfactory subregions including the (A) anterior olfactory nucleus (AON, red), (B) olfactory tubercle (TUB, purple), (C) frontal piriform cortex (PirF, blue) and (D) temporal piriform cortex (PirT, green). The results are shown on the FSL’s MNI152_T1_1mm_brain. (E–H) Functional connectivity maps shown on Freesurfer's cvs_avg35_inMNI152 brain surface for AON, TUB, PirF and PirT. All functional connectivity maps were thresholded at threshold-free cluster enhancement corrected p<0.001. L, left hemisphere; PHN, posterior hypothalamic nucleus; ITG, inferior temporal gyrus; OFC, orbitofrontal cortex; INS, insula; PCC, paracingulate cortex; RN, retromammillary nucleus; ACCU, accumbens; RSC, retrosplenial area; FP, frontal pole; FFA, fusiform face areas; ACC, anterior cingulate cortex; THAL, thalamus; CAU, caudate; PUT, putamen; SUP, supramarginal gyrus; TP, temporal pole; HIPP, hippocampus; BA, Broca’s area.
Figure 4—figure supplement 1.
Figure 4—figure supplement 1.. Lateralization of functional connectivity.
Left subregions show stronger within-region functional connectivity than right subregions and vice versa, and no differences across the rest of the brain. The left subregions' whole-brain functional connectivity patterns were not statistically different from those of the right subregions. The results were thresholded at threshold-free cluster enhancement corrected p<0.001 and overlaid on the FSL’s MNI152_T1_1mm_brain. R, right hemisphere; AON, anterior olfactory tubercle; TUB, olfactory tubercle; PirF, frontal piriform cortex; PirT, temporal piriform cortex.
Figure 5.
Figure 5.. Functional connectivity common to all subregions.
(A) Brain regions that showed statistically significant positive functional connectivity with each of the primary olfactory subregions. Results are overlaid on the FSL’s sagittal and axial MNI152_T1_1mm_brain. (B) Same brain regions as in (A) shown on medial (top row) and lateral (bottom row) Freesurfer's cvs_avg35_inMNI152 brain surfaces. Red indicates the functional connectivity maps that were thresholded at threshold-free cluster enhancement corrected p<0.001. R, right hemisphere.
Figure 6.
Figure 6.. Schematic illustrative summary of the functional organization of human primary olfactory cortex.
(A) Summary of brain regions that are uniquely connected to each subregion, including the anterior olfactory nucleus (AON), olfactory tubercle (TUB), frontal piriform cortex (PirF), and temporal piriform cortex (PirT). (B) Summary of brain regions that are commonly connected to all subregions. mPFC, medial prefrontal cortex; CAU, caudate; PUT, putamen; AMC, anterior mid-cingulate cortex; THAL, thalamus; RN, red nucleus; RSC, retrosplenial cortex; ITG, inferior temporal gyrus; pINS, posterior insular cortex; MOT, motor area; TP, temporal pole; BA, Broca's area; aINS, anterior insular cortex; OFC, orbitofrontal cortex; ACC, anterior cingulate cortex; SC, subcallosal cortex; HIPP, hippocampus; AMY, amygdala.
Author response image 1.

References

    1. Ackermann H, Riecker A. The contribution(s) of the insula to speech production: a review of the clinical and functional imaging literature. Brain Structure and Function. 2010;214:419–433. doi: 10.1007/s00429-010-0257-x. - DOI - PubMed
    1. Albrecht J, Kopietz R, Frasnelli J, Wiesmann M, Hummel T, Lundström JN. The neuronal correlates of intranasal trigeminal function-an ALE meta-analysis of human functional brain imaging data. Brain Research Reviews. 2010;62:183–196. doi: 10.1016/j.brainresrev.2009.11.001. - DOI - PMC - PubMed
    1. Allison AC. The secondary olfactory areas in the human brain. Journal of Anatomy. 1954;88:481–488. - PMC - PubMed
    1. Aqrabawi AJ, Browne CJ, Dargaei Z, Garand D, Khademullah CS, Woodin MA, Kim JC. Top-down modulation of olfactory-guided behaviours by the anterior olfactory nucleus pars medialis and ventral Hippocampus. Nature Communications. 2016;7:13721. doi: 10.1038/ncomms13721. - DOI - PMC - PubMed
    1. Aqrabawi AJ, Kim JC. Topographic organization of hippocampal inputs to the anterior olfactory nucleus. Frontiers in Neuroanatomy. 2018a;12:12:12. doi: 10.3389/fnana.2018.00012. - DOI - PMC - PubMed

Publication types