Review
. 2019 Nov;67(11):2107-2124.
doi: 10.1002/glia.23668. Epub 2019 Jul 24.

Oligodendrocyte involvement in Gulf War Illness

Affiliations
Review

Oligodendrocyte involvement in Gulf War Illness

Jillian Belgrad et al. Glia. 2019 Nov.

Abstract

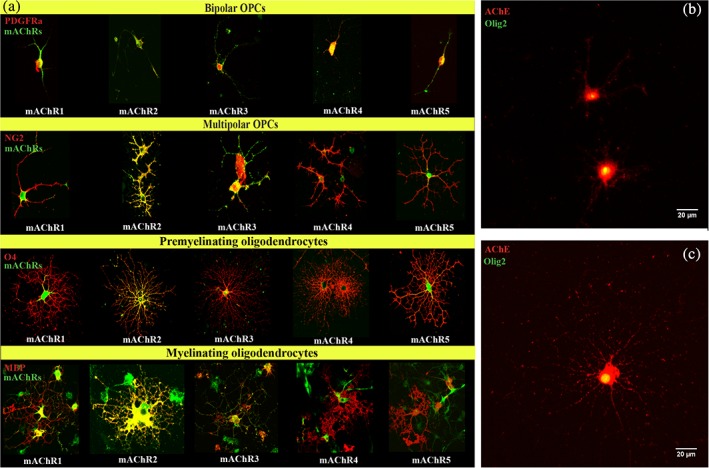
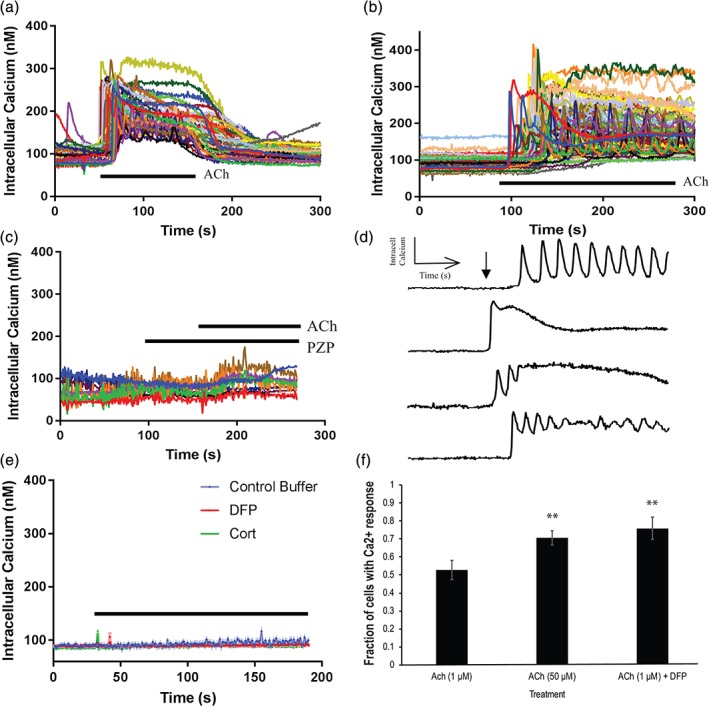
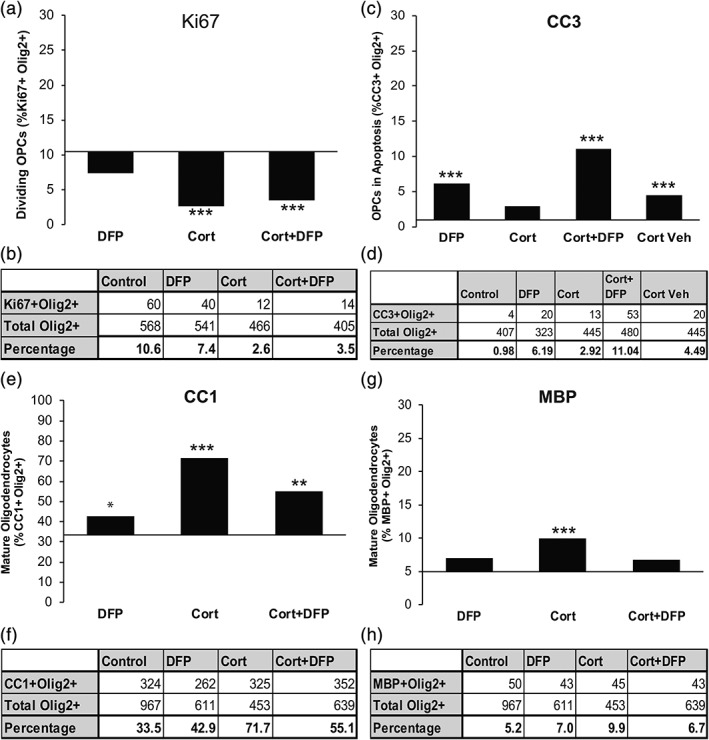
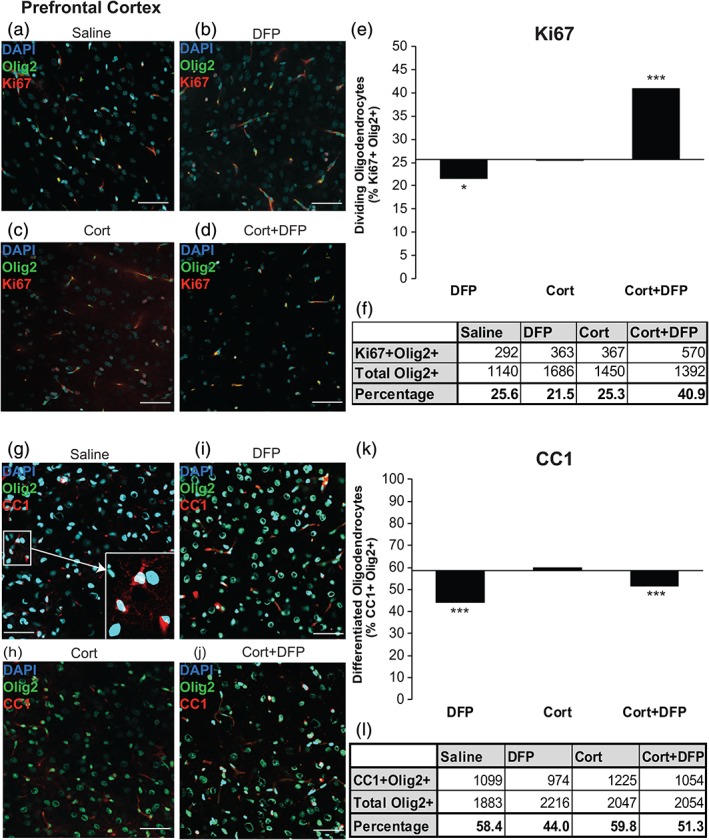
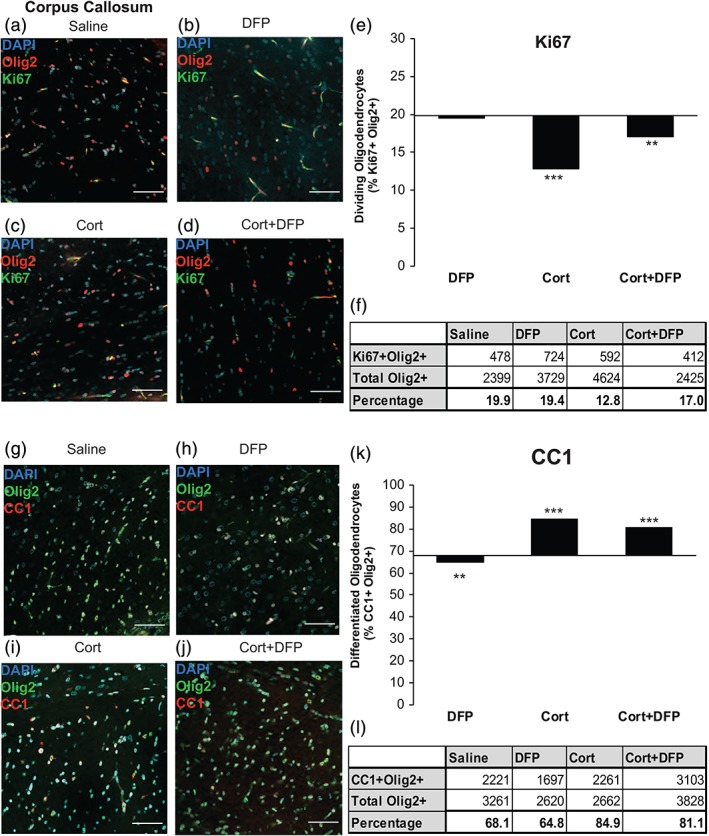
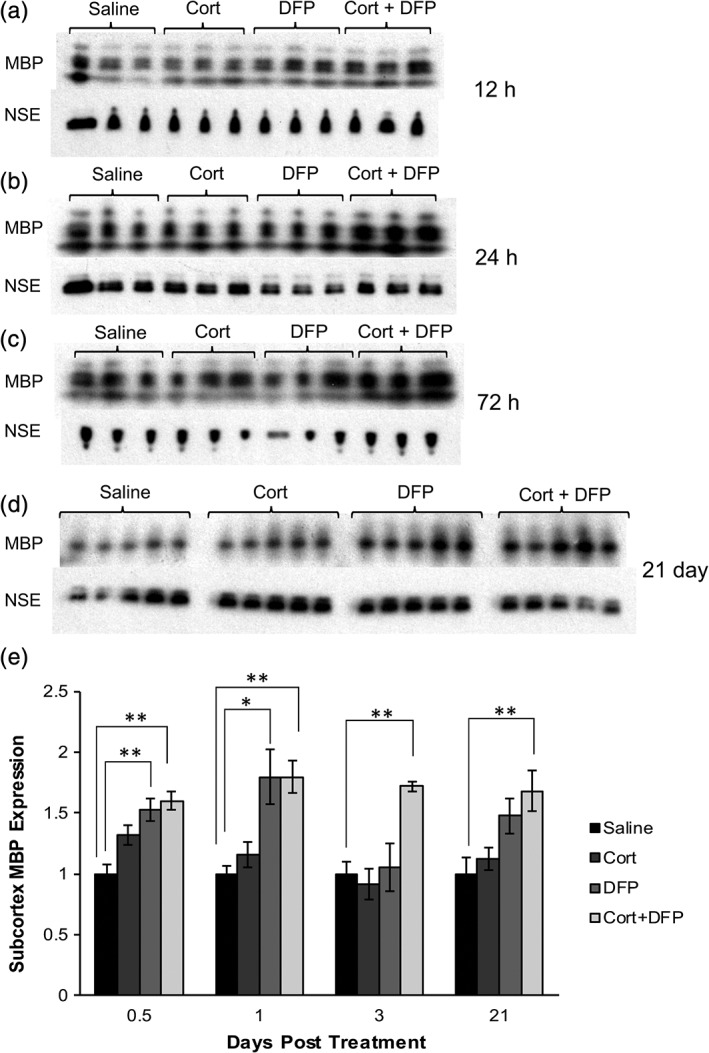
Low level sarin nerve gas and other anti-cholinesterase agents have been implicated in Gulf War illness (GWI), a chronic multi-symptom disorder characterized by cognitive, pain and fatigue symptoms that continues to afflict roughly 32% of veterans from the 1990-1991 Gulf War. How disrupting cholinergic synaptic transmission could produce chronic illness is unclear, but recent research indicates that acetylcholine also mediates communication between axons and oligodendrocytes. Here we investigated the hypothesis that oligodendrocyte development is disrupted by Gulf War agents, by experiments using the sarin-surrogate acetylcholinesterase inhibitor, diisopropyl fluorophosphate (DFP). The effects of corticosterone, which is used in some GWI animal models, were also investigated. The data show that DFP decreased both the number of mature and dividing oligodendrocytes in the rat prefrontal cortex (PFC), but differences were found between PFC and corpus callosum. The differences seen between the PFC and corpus callosum likely reflect the higher percentage of proliferating oligodendroglia in the adult PFC. In cell culture, DFP also decreased oligodendrocyte survival through a non-cholinergic mechanism. Corticosterone promoted maturation of oligodendrocytes, and when used in combination with DFP it had protective effects by increasing the pool of mature oligodendrocytes and decreasing proliferation. Cell culture studies indicate direct effects of both DFP and corticosterone on OPCs, and by comparison with in vivo results, we conclude that in addition to direct effects, systemic effects and interruption of neuron-glia interactions contribute to the detrimental effects of GW agents on oligodendrocytes. Our results demonstrate that oligodendrocytes are an important component of the pathophysiology of GWI.

Keywords: Gulf War illness; acetylcholine; activity-dependent myelination; cholinergic; corticosterone; myelin; organophosphate; plasticity; white matter.


Figures

Figure 1
Figure 1
Expression of muscarinic receptors and acetylcholinesterase in oligodendrocyte lineage cells. (a) Expression of muscarinic acetylcholine receptors (mAChRs) 1–5 at various stages of oligodendrocyte development, from immature bipolar progenitors to highly branched mature oligodendrocytes, in primary cultures of oligodendrocyte lineage cells. Red are oligodendrocyte markers; green are muscarinic ACh receptors. (b) AChE expression in immature OPCs. Red is AChE; green is Olig2. (c) AChE expression in mature oligodendrocytes. Red is AChE; green is Olig2
Figure 2
Figure 2
ACh induces OPC intracellular calcium response. (a) 50 μM ACh (N = 5, n = 56). Line indicates duration of treatment. (b) 1 μM ACh (N = 5, n = 91). Line indicates duration of treatment. (c) Inhibition with mAChR M1 inhibitor, Pirenzepine (PZP, 50 μM), to confirm specificity of mAChR induced calcium response (N = 3, n = 9). Line indicates duration of treatment. PZP pretreatment onset at 40 s and co‐treatment of PZP with 50 μM ACh beginning at 160 s. (d) Representative waveform traces of data presented in b. Arrow indicates onset of ACh treatment. (e) DFP (50 μm) alone and Cort (5 μM) alone had no effect on intracellular calcium mobilization in OPCs. (DFP: N = 4, n = 95; Cort: N = 3, n = 36). (f) DFP pretreatment followed by ACh significantly increased the fraction of cells that respond to ACh (52.8 ± 5.37% vs. 75.9 ± 6.21%, t[15 dishes] = 2.131, p = 0.005). Fifty micromolar ACh significantly increased the number of cells that respond to ACh compared to 1 μM ACh (52.8 ± 5.37% vs. 70.6 ± 3.92%, t[15 dishes] = 2.947, p = 0.0118). Student's t‐test was performed comparing ACh (1 μM) and ACh (1 μM) vs. DFP. * indicates p < 0.05; ** indicates p < 0.01
Figure 3
Figure 3
In vitro exposure to GW agents disrupts OPC development. (a) Immunocytochemical staining of OPC monoculture using Ki67 and Olig2 primary antibodies. Cort (χ2 [1, n = 466] = 26.604, p < 0.001) and Cort+DFP (χ2 [1, n = 405] = 11.150, p = 0.001) significantly reduced OPC proliferation, identified as Ki67+ Olig2+ cells, compared to Cort condition. DFP alone had no effect on oligodendrocyte proliferation (χ2 [1, n = 541] = 2.436, p = 0.119). Baseline indicates control value. (b) Table of raw Ki67+ Olig2+ cell counts used to generate part (a). (c) Immunocytochemical staining of OPC monoculture using cleaved caspase 3 (CC3) and Olig2 primary antibodies. DFP (χ2 [1, n = 323] = 14.316, p < 0.001) and Cort+DFP (χ2 [1, n = 480] = 11.663, p = 0.001) treatments significantly increased OPC apoptosis, identified as cleaved caspase 3+ cells. Cort had no effect on apoptosis (χ2 [1, n = 445] = 1.432, p = 0.23). Baseline indicates control value. (d) Table of CC3+ Olig2+ cell counts were used to generate percentages in part (c). (e) Immunocytochemistry staining of oligodendrocyte monoculture (grown in differentiation media for 5 days total) using CC1 and Olig2 primary antibodies. DFP alone, (χ2 [1, n = 611] = 6.371, p = 0.012), Cort alone (χ2 [1, n = 453] = 28.962, p < 0.001) and Cort+DFP (χ2 [1, n = 639] = 11.133, p = 0.001) increased CC1+ mature oligodendrocytes. Baseline indicates control value. (f) Table of CC1+ Olig2+ cell counts used to generate percentages in part (e). (g) Immunocytochemical staining of oligodendrocyte monoculture (grown in differentiation media for 5 days total) using MBP and Olig2 primary antibodies. Cort alone increased MBP+ mature oligodendrocytes (χ2 [1, n = 453] = 8.419, p = 0.004). DFP (χ2 [1, n = 611] = 2.083, p = 0.149) and Cort+DFP (χ2 [1, n = 639] = 2.449, p = 0.118) had no significant effect on counts of MBP+ mature oligodendrocytes. Baseline indicates control value. (h) Table of MBP+ Olig2+ cell counts used to generate percentages in part (g). * indicates p < 0.05; ** indicates p < 0.01, *** indicates p < 0.001. Significance is determined by comparing all treatment conditions with the control condition. DMEM + 10% FBS (used in experiments for parts a–d) or differentiation media (used in experiments for parts e–h). DFP values were compared to control. Cort and Cort+DFP values were compared relative to the “Cort vehicle” control
Figure 4
Figure 4
AChE inhibition decreases the frequency of mature oligodendrocytes in the prefrontal cortex (PFC) of the GWI animal model. Data are cell counts from immunohistochemistry of GWI animals at 24 hr postexposure for proliferation analysis and 21 days postexposure for maturation analysis. (a–d) Representative images of Olig2+ Ki67+ cells across treatment conditions. (e) Fraction of proliferating oligodendrocytes (Olig2+ Ki67+) compared to total oligodendrocytes (Olig2+) in the PFC varied with treatment condition (χ2 [1, N = 3] = 158.86, p < 0.00001). DFP decreased the frequency of proliferating oligodendrocytes (χ2 [1, n = 1686] = 6.3703, p = 0.01195). Cort had no effect on Ki67+ oligodendrocyte frequency (χ2 [1, n = 1450] = 0.031, p = 0.8602). Cort+DFP condition had significantly more proliferating oligodendrocytes than saline control (χ2 [1, n = 1392] = 65.6309, p < 0.00001) Bar graphs are total cell counts (N = 5, n = 50). X‐axis is drawn at the saline control value. (f) Table of proliferating (Ki67+ Olig2+) cell counts in the PFC for each condition. (g–j) Representative images of CC1+ Olig2+ cells across treatment conditions. Inset in (g) illustrates CC1+ (red) Olig2+ (green) and CC1+ Olig2+ (yellow) cell identification. (k) Fraction of mature oligodendrocytes (Olig2+ CC1+) compared to total oligodendrocytes (Olig2+) in the PFC varied with treatment condition (χ2 [1, N = 3] = 135.04, p < 0.001). Bar graphs are total cell counts (N = 3, n = 30). X‐axis is drawn at the saline control value. DFP treatment resulted in significantly fewer mature oligodendrocytes than saline condition. (χ2 [1, n = 2216] = 27.611, p < 0.001). Cort alone had no effect on CC1+ oligodendrocytes in the PFC (χ2 [1, n = 2047] = 0.888, p = 0.346). Cort+DFP was associated with significantly fewer mature oligodendrocytes than saline condition (χ2 [1, n = 2054] = 5.7633, p = 0.0163). (l) Table of mature (Olig2+ CC1+) cell counts in the PFC for each condition. Scale bar on all representative images is 40 μM. * indicates p < 0.05, *** indicates p < 0.001, significance is determined by comparing all treatment conditions with the control condition, saline
Figure 5
Figure 5
Corticosterone increases the frequency of mature oligodendrocytes in the corpus callosum of the GWI animal model. Data are cell counts from immunohistochemistry of GWI animals at 24 hr postexposure for proliferation analysis and 21 days postexposure for maturation analysis. (a–d) Representative images of Ki67+ Olig2+ cells across treatment conditions. (e) Fraction of proliferating oligodendrocytes (Olig2+ Ki67+) compared to total oligodendrocytes (Olig2+) in the corpus callosum was dependent on treatment condition (χ2 = 88.142, p < 0.001). Bar graphs are total cell counts (N = 5, n = 50). X‐axis is drawn at the saline control value. DFP had no effect on the frequency of proliferating oligodendrocytes in the corpus callosum (χ2 [1, n = 3,729] = 0.240, p = 0.624). Cort treatment was associated with significantly fewer proliferating oligodendrocytes (χ2 [1, n = 4,624] = 60.080, p < 0.001). Cort+DFP treatment was associated with significantly fewer proliferating cells than saline condition (χ2 [1, n = 2425] = 6.910, p = 0.009). (f) Table of mature (Olig2+ CC1+) cell counts in the corpus callosum for each condition. (g–j) Representative images of Olig2+ CC1+ cells across treatment conditions. (k) Fraction of mature oligodendrocytes (Olig2+ CC1+) compared to total oligodendrocytes (Olig2+) in the corpus callosum was dependent on treatment condition (χ2 = 444.328, p < 0.001). Bar graphs are total cell counts (N = 5, n = 50). X‐axis is drawn at the saline control value. Cort treatment resulted in significantly more mature oligodendrocytes than saline condition. (χ2 [1, n = 2,662] = 225.445, p < 0.001). Cort+DFP was also associated with significantly more mature oligodendrocytes than saline condition, (χ2 [1, n = 3,828] = 157.995, p < 0.001). DFP alone had significantly fewer mature oligodendrocytes (χ2 [1, n = 2,620 = 7.275, p = 0.007). (l) Table of mature (Olig2+ CC1+) cell counts in the corpus callosum for each condition. Scale bar on all representative images is 40 μM. ** indicates p < 0.01; *** indicates p < 0.001, significance is determined by comparing all treatment conditions with the control condition, saline
Figure 6
Figure 6
GWI treatment paradigm increases levels of myelin basic protein (MBP) in subcortical white matter. Immunoblots of subcortical white matter homogenates indicate MBP levels after treatment with saline, Cort, DFP, and Cort+DFP at (a) 12 hr, (b) 24 hr, (c) 72 hr, and (d) 21 days posttreatment. MBP isoforms correspond to four immunoblot bands with molecular weights of 21, 18, 17, and 14 kDa. NSE band occurs at 47 kDa. (e) MBP expression was quantified with densitometry and normalized to neuron‐specific enolase (NSE). Each treatment was compared to the control condition, saline, at each time point (12 hr: ANOVA F[3, 8] = 10.97, p = 0.0033; 24 hr: ANOVA F[3,8] = 11.19, p = 0.0031; 72 hr: ANOVA F(3,8) = 8.81, p = 0.0065; 21 days: ANOVA F(3,16) = 5.258, p = 0.0102. Dunnett's multiple comparison: Saline vs. DFP. p < 0.01; saline vs. Cort+DFP, p < 0.01). Cort+DFP cotreatment significantly increased MBP levels beginning at 12 hr and persisting at 1, 3, and 21 days postexposure (Dunnett's multiple comparison: Saline vs. Cort+DFP, p < 0.01 each time point). Data are reported from N = 3 or 5 animals per condition. * indicates p < 0.05, ** indicates p < 0.01

References

    1. Abiraman, K. , Pol, S. U. , O'Bara, M. A. , Chen, G. D. , Khaku, Z. M. , Wang, J. , … Salvi, R. J. (2015). Anti‐muscarinic adjunct therapy accelerates functional human oligodendrocyte repair. Journal of Neuroscience, 35(8), 3676–3688. - PMC - PubMed
    1. Alonso, G. (2000). Prolonged corticosterone treatment of adult rats inhibits the proliferation of oligodendrocyte progenitors present throughout white and gray matter regions of the brain. Glia, 31(3), 219–231. - PubMed
    1. Ashbrook, D. G. , Hing, B. , Michalovicz, L. T. , Kelly, K. A. , Miller, J. V. , de Vega, W. C. , … McGowan, P. O. (2018). Epigenetic impacts of stress priming of the neuroinflammatory response to sarin surrogate in mice: A model of gulf war illness. Journal of Neuroinflammation, 15(1), 86. - PMC - PubMed
    1. Bartholdi, D. , & Schwab, M. E. (1998). Oligodendroglial reaction following spinal cord injury in rat: Transient upregulation of MBP mRNA. Glia, 23(3), 278–284. - PubMed
    1. Benowitz, L. I. , & Routtenberg, A. (1997). GAP‐43: An intrinsic determinant of neuronal development and plasticity. Trends in Neurosciences, 20(2), 84–91. - PubMed

Publication types