. 2019 Dec;19(12):1490-1504.
doi: 10.1089/ast.2018.2004. Epub 2019 Jul 24.

Biomarker Profiling of Microbial Mats in the Geothermal Band of Cerro Caliente, Deception Island (Antarctica): Life at the Edge of Heat and Cold

Affiliations

Biomarker Profiling of Microbial Mats in the Geothermal Band of Cerro Caliente, Deception Island (Antarctica): Life at the Edge of Heat and Cold

María Ángeles Lezcano et al. Astrobiology. 2019 Dec.

Abstract

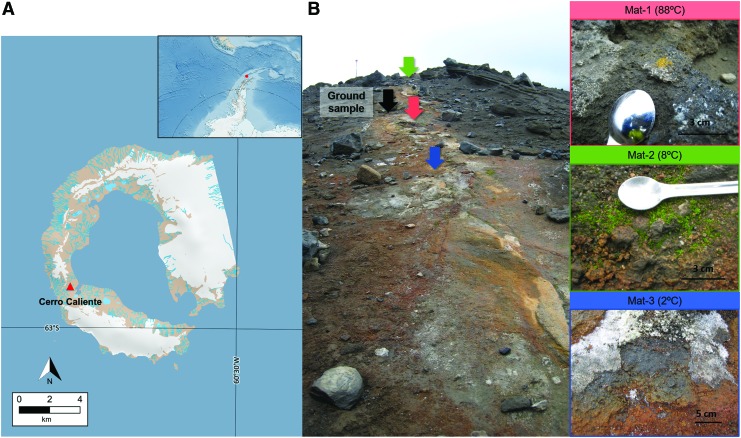
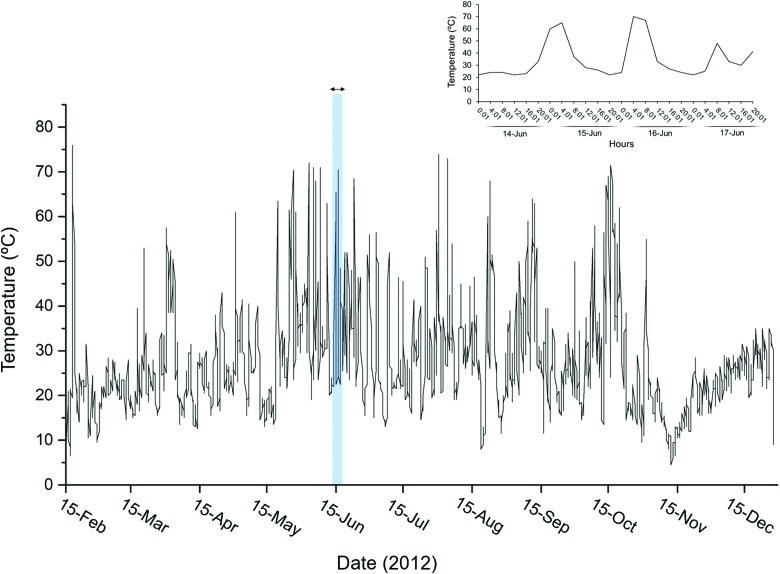
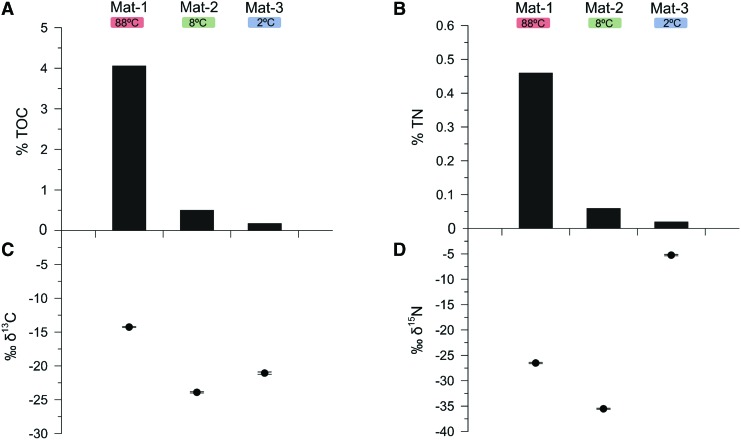
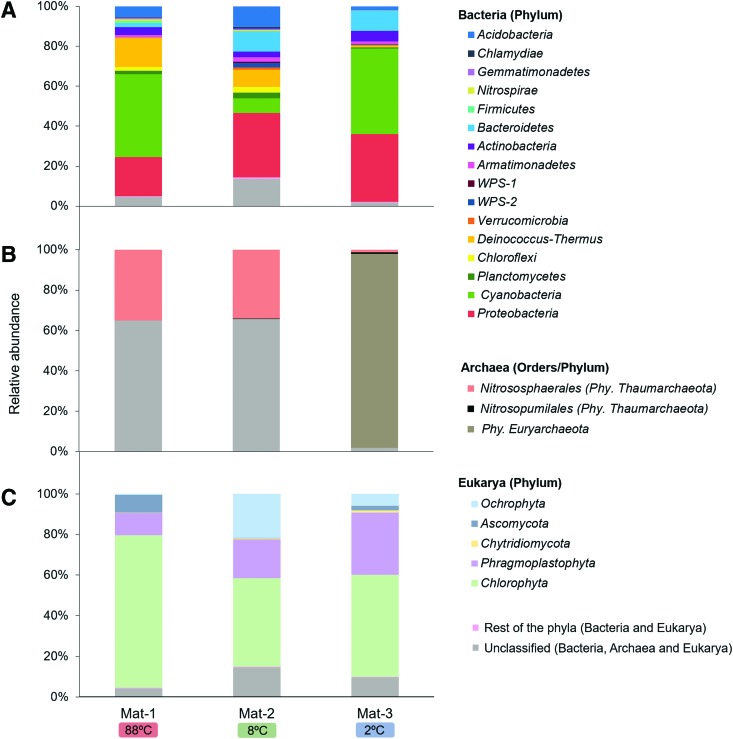
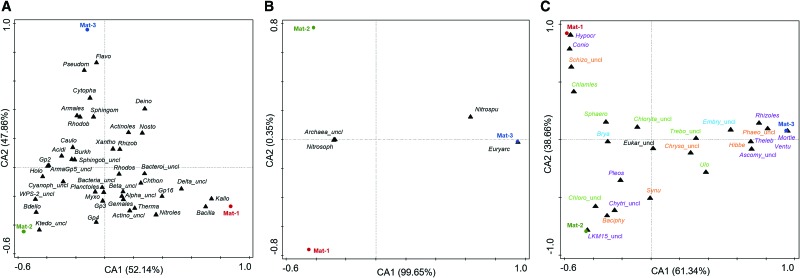
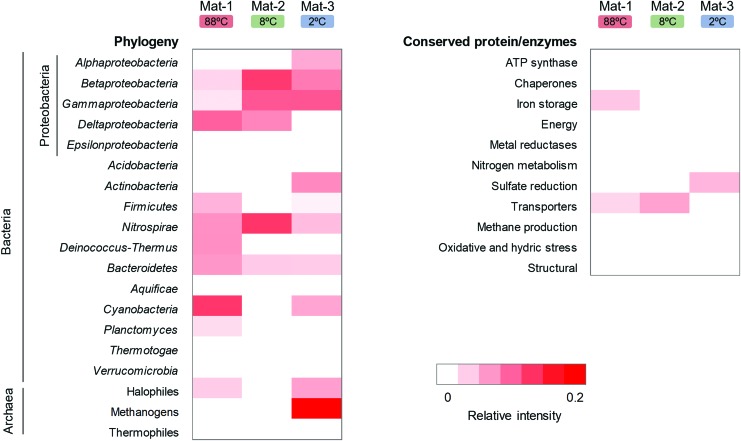
Substrate-atmosphere interfaces in Antarctic geothermal environments are hot-cold regions that constitute thin habitable niches for microorganisms with possible counterparts in ancient Mars. Cerro Caliente hill in Deception Island (active volcano in the South Shetland Islands) is affected by ascending hydrothermal fluids that form a band of warm substrates buffered by low air temperatures. We investigated the influence of temperature on the community structure and metabolism of three microbial mats collected along the geothermal band of Cerro Caliente registering 88°C, 8°C, and 2°C at the time of collection. High-throughput sequencing of small subunit ribosomal ribonucleic acid (SSU rRNA) genes and Life Detector Chip (LDChip) microarray immunoassays revealed different bacterial, archaeal, and eukaryotic composition in the three mats. The mat at 88°C showed the less diverse microbial community and a higher proportion of thermophiles (e.g., Thermales). In contrast, microbial communities in the mats at 2°C and 8°C showed relatively higher diversity and higher proportion of psychrophiles (e.g., Flavobacteriales). Despite this overall association, similar microbial structures at the phylum level (particularly the presence of Cyanobacteria) and certain hot- and cold-tolerant microorganisms were identified in the three mats. Daily thermal oscillations recorded in the substrate over the year (4.5-76°C) may explain the coexistence of microbial fingerprints with different thermal tolerances. Stable isotope composition also revealed metabolic differences among the microbial mats. Carbon isotopic ratios suggested the Calvin-Benson-Bassham cycle as the major pathway for carbon dioxide fixation in the mats at 2°C and 8°C, and the reductive tricarboxylic acid cycle and/or the 3-hydroxypropionate bicycle for the mat at 88°C, indicating different metabolisms as a function of the prevailing temperature of each mat. The comprehensive biomarker profile on the three microbial mats from Cerro Caliente contributes to unravel the diversity, composition, and metabolism in geothermal polar sites and highlights the relevance of geothermal-cold environments to create habitable niches with interest in other planetary environments.

Keywords: Biomarker; Cerro Caliente; Deception Island; Geothermal; Microbial mat structure; Microbial metabolism.


Conflict of interest statement

No competing financial interest exist.

Figures

<b>FIG. 1.</b>
FIG. 1.
Sampling location at Cerro Caliente, Deception Island. Map showing Deception Island close to the Antarctic Peninsula (A), and pictures showing the sampling sites at Cerro Caliente and the aspect of the microbial mats (B). Black arrow indicates the site for ground sample and color arrows indicate the location for the microbial mat samples. Source of the map: Quantartica (Matsuoka et al., 2018).
<b>FIG. 2.</b>
FIG. 2.
Ground thermal oscillations at 2.5 cm depth in the geothermal band of Cerro Caliente over the year 2012. Temperature was measured with a thermocouple located inside a hole perforated close to the ground sampling point. Upper plot represents a zoom of the temperature oscillations every 4 h recorded from 14 to 17 June.
<b>FIG. 3.</b>
FIG. 3.
Carbon and nitrogen composition in the three microbial mats. The plots show (A) TOC (%) and (B) TN (%) contents, and (C) isotopic δ13C and (D) δ15N ratios (‰). Error bars indicate standard deviation of triplicates. TN, total nitrogen; TOC, total organic carbon.
<b>FIG. 4.</b>
FIG. 4.
Microbial community structure of the mat samples in the geothermal band of Cerro Caliente. Total bacterial (A), archaeal (B), and eukaryotic (C) community composition at phylum level identified in terms of relative abundance. In the Archea domain, the order is also represented. The phyla with relative abundances <0.5% in the three microbial mats are comprised in the “rest of the phyla” group.
<b>FIG. 5.</b>
FIG. 5.
Correspondence Analysis (CA) of the bacterial (A), archaeal (B), and eukaryotic (C) community composition in Mat-1 (88°C), Mat-2 (8°C), and Mat-3 (2°C) at order level. In absence of order, the upper taxonomic level is shown. For an enhanced view, plot A only shows the 40 bacterial orders with the highest weight (i.e., most frequent). Colors in plot C show the kingdoms of Fungi (purple), Plantae (green algae in green; mosses/other plants in blue), and Protist (brown algae, chrysophytes and amoeba in orange). Acidi, Acidimicrobiales; Actino, Actinobacteria; Actinoles, Actinomycetales; Alpha, Alphaproteobacteria; ArmaGp5, Armatimonadetes Gp5; Armales, Armatimonadales; Ascomy, Ascomycota; Bacilla, Bacillales; Baciphy, Bacillariophytina; Bact, Bacteria; Bacteroi, Bacteroidetes; Basidio, Basidiomycota; Bdello, Bdellovibrionales; Beta, Betaproteobacteria; Brya, Bryales; Burkh, Burkholderiales; Caulo, Caulobacterales; Chlamles, Chlamydomonadales; Chloro, Chlorophyceae; Chlorof, Chloroflexi; Chloryta, Chlorophyta; Chryso, Chrysophyceae; Chthon, Chthonomonadales; Chytri, Chytridiomycota; Conio, Coniochaetales; Cyanoph, Cyanophyceae; Cytopha, Cytophagales; Deino, Deinococcales; Delta, Deltaproteobacteria; Embry, Embryophyta; Eukar, Eukaryota; Euryarc, Euryarchaeota; Flavo, Flavobacteriales; Gemales, Gemmatimonadales; Hibbe, Hibberdiales; Holo, Holophagales; Hypocr, Hypocreales; Ignaviles, Ignavibacteriales; Incert, Incertae; Kallo, Kallotenuales; Krieg, Kriegeriales; Ktedono, Ktedonobacteria; Mortie, Mortierellales; Mucoro, Mucoromycota; Myxo, Myxococcales; Nitroles, Nitrospirales; Nitrosoph, Nitrososphaerales; Nitrospu, Nitrosopumilales; Nosto, Nostocales; Ochro, Ochrophyta; Phaeo, Phaeophyceae; Phragmo, Phragmoplastophyta; Planctoles, Planctomycetales; Pleos, Pleosporales; Pseudom, Pseudomonadales; Rhizob, Rhizobiales; Rhizoles, Rhizophydiales; Rhodob, Rhodobacterales; Rhodos, Rhodospirillales; Saccha, Saccharibacteria; Schizo, Schizoplasmodiida; Sphaero, Sphaeropleales; Sphingob, Sphingobacteriales; Sphingom, Sphingomonadales; Synu, Synurales; Thauma, Thaumarchaeota; Theleb, Thelebolales; Therma, Thermales; Trebo, Trebouxiophyceae; Ulo, Ulotrichales; Ventu, Venturiales; Xantho, Xanthomonadales; _uncl, unclassified. CA, correspondence analysis.
<b>FIG. 6.</b>
FIG. 6.
Heatmap of the LDChip immunoassay analysis on the three microbial mats. The antibodies (Supplementary Table S1) were organized into 30 categories based on main phylogenetic groups, metabolic traits, and protein functions. Only phylum Proteobacteria is divided into five taxonomic classes. The averaged fluorescence intensity of the positive signals within each category was used for relative intensity calculation. The color scale represents the relative intensity of the positive signals. White cells stand for values under the detection limit and positive signals are indicated from light pink to red (0.2 as maximum relative intensity). LDChip, Life Detector Chip.

References

    1. Alcamán-Arias M.E., Pedrós-Alió C., Tamames J., Fernández C., Pérez-Pantoja D., Vásquez M., and Díez B. (2018) Diurnal changes in active carbon and nitrogen pathways along the temperature gradient in Porcelana hot spring microbial mat. Front Microbiol 9:2353. - PMC - PubMed
    1. Amenábar M.J., Flores P.A., Pugin B., Boehmwald F.A., and Blamey J.M. (2013) Archaeal diversity from hydrothermal systems of Deception Island, Antarctica. Polar Biol 36:373–380
    1. ATS (Antarctic Treaty Secretariat). (2012) Management plan for Antarctic Specially Managed Area No. 140. Parts of Deception Island, South Shetland Islands. In ATCM XXXV Final Report. Secretariat of the Antarctic Treaty; Hobart, Australia, pp 99–124
    1. Baker P.E. and McReath I. (1971) 1970 Volcanic eruption at Deception Island. Nat Phys Sci 231:5–9
    1. Barnes D.K.A., Linse K., Enderlein P., Smale D., Fraser K.P.P., and Brown M. (2008) Marine richness and gradients at Deception Island, Antarctica. Antarct Sci 20:271–279

Publication types

MeSH terms

LinkOut - more resources