. 2019 Jul 23;12(14):2333.
doi: 10.3390/ma12142333.

Adsorption of Serum Albumin onto Octacalcium Phosphate in Supersaturated Solutions Regarding Calcium Phosphate Phases

Affiliations

Adsorption of Serum Albumin onto Octacalcium Phosphate in Supersaturated Solutions Regarding Calcium Phosphate Phases

Ryo Hamai et al. Materials (Basel). .

Abstract

Octacalcium phosphate (OCP) has been shown to enhance new bone formation, coupled with its own biodegradation, through osteoblasts and osteoclast-like cell activities concomitant with de novo hydroxyapatite (HA) formation and serum protein accumulation on its surface. However, the nature of the chemical environment surrounding OCP and how it affects its metabolism and regulates protein accumulation is unknown. The present study examined how the degree of supersaturation (DS) affects the bovine serum albumin (BSA) adsorption onto OCP in 150 mM Tris-HCl buffer at 37 °C and pH 7.4, by changing the Ca2+ ion concentration. The amount of BSA adsorbed onto OCP increased as the DS increased. In addition, the amount of newly formed calcium phosphate, which could be OCP, was increased, not only by increases in DS, but also at lower equilibrium concentrations of BSA. The increased adsorption capacity of BSA was likely related to the formation of calcium phosphate on the adsorbed OCP. Together the results suggested that the formation of new calcium phosphate crystals is dependent on both the DS value and the adsorbate protein concentration, which may control serum protein accumulation on the OCP surface in vivo.

Keywords: bovine serum albumin; degree of supersaturation; octacalcium phosphate; protein adsorption.


Conflict of interest statement

The authors declare no conflict of interest but the content of the present study was used for a patent application.

Figures

Figure 1
Figure 1
Adsorption isotherms of BSA onto octacalcium phosphate (OCP) plotted as adsorption amount as a function of initial BSA concentration (A) and adsorption amount per unit area of OCP as a function of BSA equilibrium concentration (B) in solutions containing 1.0 mM Pi ion and 1.5 or 3.0 mM Ca2+ (Ca1.5P1.0 and Ca3.0P1.0, respectively). Mean values were obtained from three independent experiments (n = 3). Significant difference (p < 0.01) for 0.20, 0.25, 0.75, 1.0 and 1.5 mg·mL−1 BSA in aCa3.0P1.0 and bCa1.5P1.0 solution; cSignificant difference (p < 0.01) for 0.20, 0.25 and 1.0 mg·mL−1 BSA in Ca3.0P1.0; dp < 0.01 significantly difference from 0.20 and 0.25 mg·mL−1 BSA in Ca1.5P1.0; eSignificant difference (p < 0.01) from 0.20 and 1.0 mg·mL−1 BSA in Ca3.0P1.0; fp < 0.01 significant difference for 0.20, 1.0 and 1.5 mg·mL−1 BSA in Ca1.5P1.0. gp < 0.01 significant difference from 0.10 and 1.5 mg·mL−1 BSA in Ca3.0P1.0; hp < 0.01 significant difference for 1.5 mg·mL−1 BSA in Ca1.5P1.0; **p < 0.01 significant difference between Ca1.5P1.0 and Ca3.0P1.0 solution at each BSA concentration. Dashed line indicates the adsorption isotherm of BSA onto OCP under saturation conditions with respect to OCP at 37 °C and pH 7.4 reported by Suzuki et al. [25], and is plotted using adsorption constants obtained from previous reports [25] based on the Langmuir equation (Equation (2)).
Figure 2
Figure 2
Change in free Ca2+ concentration from 0 to 1.5 mg·mL−1 BSA in Ca1.5P1.0 (A) or Ca3.0P1.0 (B) solutions. Mean values were obtained from three independent experiments (n = 3).
Figure 3
Figure 3
Powder XRD patterns of OCP before and after incubation with 0 to 1.5 mg·mL−1 BSA in Ca1.5P1.0 (A) or Ca3.0P1.0 (B) solutions.
Figure 4
Figure 4
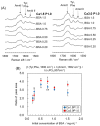
Raman spectra of OCP before and after incubation with 0 to 1.5 mg·mL−1 BSA in Ca1.5P1.0 (A) or Ca3.0P1.0 (B) solutions.
Figure 5
Figure 5
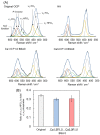
Magnified Raman spectra between 1500 to 1800 cm−1 (A) and change in integrated intensity ratio of the total of two BSA peaks at 1600 and 1653 cm−1 to the OCP peak at 957 cm−1 (B) after incubation with BSA solutions. ap < 0.01 significant difference for 0.20, 0.25 and 1.0 mg·mL−1 BSA in Ca3.0P1.0; bp < 0.01 significant difference for 0.20, 0.25 and 1.5 mg·mL−1 in Ca1.5P1.0 solution; cp < 0.01 significant difference for 0.20, 0.25 and 1.0 mg·mL−1 BSA in Ca3.0P1.0. dp < 0.01 significant difference between 0.20 and 0.75 mg·mL−1 BSA, and ep < 0.05 significant difference from 1.5 mg·mL−1 BSA in Ca1.5P1.0; fp < 0.01 significantly different for 1.0 and 1.5 mg·mL−1 BSA in Ca3.0P1.0; gp < 0.05 significant difference for 0.20 mg·mL−1 BSA and hp < 0.01 significant difference from 1.0 mg·mL−1 BSA in Ca1.5P1.0. ip < 0.05 significant difference from 1.5 mg·mL−1 BSA in Ca1.5P1.0. Mean values were obtained from three independent experiments (n = 3).
Figure 6
Figure 6
Raman spectra curve fitting of original OCP, hydroxyapatite (HA) and OCP after incubation with Ca1.5P1.0 or Ca3.0P1.0 solution without BSA (A). Integrated intensity ratio of ν2, ν4 HPO4 to the total phosphate vibration (ν2, ν4 HPO4 + ν2, ν4 PO4) estimated by a curve fitting of Raman spectra for OCP before and after incubation (B). Mean values were obtained from three independent experiments (n = 3).
Figure 7
Figure 7
Bright field image of OCP before and after incubation with 0, 0.25 and 0.50 mg·mL−1 BSA in this Ca3.0P1.0 solution (A). Selected area of OCP electron diffraction before and after incubation in 0.25 or 0.50 mg·mL−1 BSA in the Ca3.0P1.0 solution (B).
Figure 8
Figure 8
Change in the mass ratio of newly-formed calcium phosphate assuming that the OCP composition is the same as the original OCP determined from the decrease in the Ca2+ (A) and Pi ion (B) concentration after incubation in the Ca3.0P1.0 or Ca1.5P1.0 solution containing BSA. Mean values were obtained from three independent experiments (n = 3). *p < 0.05, **p < 0.01 significant difference among the BSA concentrations in each supersaturated solution. ##p < 0.01 significant difference between Ca1.5P1.0 and Ca3.0 P1.0 solution at each BSA concentration.
Figure 9
Figure 9
Ca2+ (A) and Pi ion (B) concentration in the Ca3.0P1.0 solution without BSA after incubation of OCP with pre-adsorbed BSA in the Ca3.0P1.0 solution containing 0.25 or 1.5 mg·mL−1 BSA. Mean values were obtained from three independent experiments (n = 3). *p < 0.05, **p < 0.01 significant difference.

Similar articles

Cited by

References

    1. Brown W.E. Crystal growth of bone mineral. Clin. Orthop. Relat. Res. 1966;44:205–220. doi: 10.1097/00003086-196601000-00021. - DOI - PubMed
    1. Brown W.E., Smith J.P., Frazier A.W., Lehr J.R. Crystallographic and chemical relations between octacalcium phosphate and hydroxyapatite. Nature. 1962;196:1050–1055. doi: 10.1038/1961050a0. - DOI
    1. Brown W.E., Mathew M., Tung M.S. Crystal chemistry of octacalcium phosphate. Prog. Cryst. Growth Charact. 1981;4:59–87. doi: 10.1016/0146-3535(81)90048-4. - DOI
    1. Meyer J.L., Eanes E.D. Thermodynamic analysis of secondary transition in spontaneous precipitation of calcium phosphate. Calcif. Tissue Res. 1978;25:209–216. doi: 10.1007/BF02010771. - DOI - PubMed
    1. Chow L.C. Next generation calcium phosphate-based biomaterials. Dent. Mater. J. 2009;28:1–10. doi: 10.4012/dmj.28.1. - DOI - PMC - PubMed

LinkOut - more resources