

Evaluation of a shortened cardiac MRI protocol for left ventricular examinations: diagnostic performance of T1-mapping and myocardial function analysis
- PMID: 31340756
- PMCID: PMC6657063
- DOI: 10.1186/s12880-019-0358-9
Evaluation of a shortened cardiac MRI protocol for left ventricular examinations: diagnostic performance of T1-mapping and myocardial function analysis
Abstract
Background: In this study we sought to retrospectively evaluate whether a very brief cardiac magnetic resonance imaging (CMR) protocol sufficiently distinguishes patients with relevant myocardial changes with need for further examination from healthy subjects.
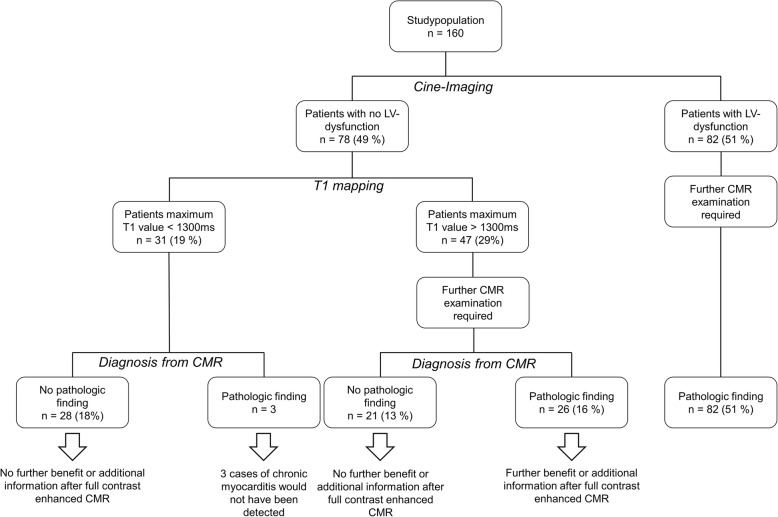
Methods: Patients with clinical indication for CMR (n = 160) were included in the study. Patients were categorized into two groups depending on presence of left ventricular (LV) dysfunction. ROC-analysis was done for results of T1-, T2- mapping and extracellular volume evaluation in patients without LV dysfunction. Binary endpoint was correctly depicted pathology of the conventional qualitative CMR techniques and report.
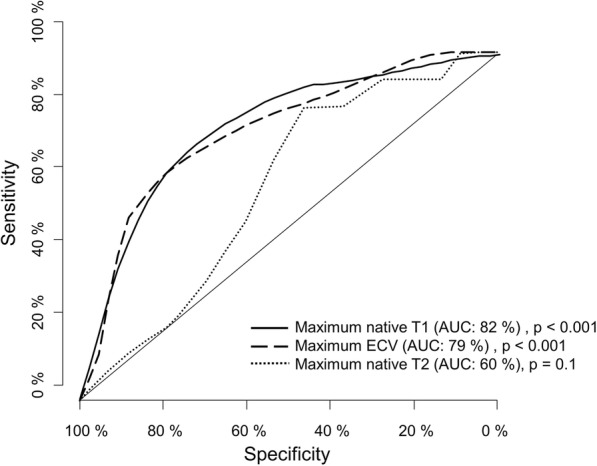
Results: In the patient cohort without LV dysfunction (49%), AUC for T1 mapping was 82% (p < 0.001), 60% for T2 mapping (p = 0.1) and 79% for ECV (p < 0.001). T1 mapping was significantly superior to T2 mapping to rule out left ventricular pathology (p = 0.012). Sensitivity for the combined use of T1 mapping and sBTFE cine imaging was 98%; the negative predictive value was 90%. In 49 patients (30%) full protocol CMR did not provide any additional information; T1 mapping correctly detected 57% of the subjects from this group who would not benefit from additional CMR.
Conclusion: A shortened CMR protocol comprising T1 mapping and LV-function analysis seems suitable to rule out myocardial alterations. Every third patient of the study population did not benefit from full contrast enhanced CMR. The shortened protocol correctly identified every fifth patient who would not benefit but no relevant pathologic findings with the obligation for treatment were missed.
Keywords: CMR; Cardiac MRI; Economic; Shortened protocol; T1mapping.
Conflict of interest statement
The authors have nothing to disclose. This is an investigator-driven study; there is no involvement from outside the departments.
Figures
References
-
- Ferreira VM, Piechnik SK, Dall'Armellina E, Karamitsos TD, Francis JM, Ntusi N, Holloway C, Choudhury RP, Kardos A, Robson MD, et al. T(1) mapping for the diagnosis of acute myocarditis using CMR: comparison to T2-weighted and late gadolinium enhanced imaging. JACC Cardiovasc Imaging. 2013;6(10):1048–1058. doi: 10.1016/j.jcmg.2013.03.008. - DOI - PubMed
-
- Nassenstein K, Nensa F, Schlosser T, Bruder O, Umutlu L, Lauenstein T, Maderwald S, Ladd ME. Cardiac MRI: T2-mapping versus T2-weighted dark-blood TSE imaging for myocardial edema visualization in acute myocardial infarction. Rofo. 2014;186(2):166–172. - PubMed
-
- Kramer CM, Barkhausen J, Flamm SD, Kim RJ, Nagel E, Society for Cardiovascular Magnetic Resonance Board of Trustees Task Force on Standardized P Standardized cardiovascular magnetic resonance imaging (CMR) protocols, society for cardiovascular magnetic resonance: board of trustees task force on standardized protocols. J Cardiovasc Magn Reson. 2008;10:35. doi: 10.1186/1532-429X-10-35. - DOI - PMC - PubMed
MeSH terms
LinkOut - more resources
Full Text Sources
