

Comparative effectiveness trial comparing MyPlate to calorie counting for mostly low-income Latino primary care patients of a federally qualified community health center: study design, baseline characteristics
- PMID: 31340800
- PMCID: PMC6651946
- DOI: 10.1186/s12889-019-7294-z
Comparative effectiveness trial comparing MyPlate to calorie counting for mostly low-income Latino primary care patients of a federally qualified community health center: study design, baseline characteristics
Abstract
Background: Primary care-based behavior change obesity treatment has long featured the Calorie restriction (CC), portion control approach. By contrast, the MyPlate-based obesity treatment approach encourages eating more high-satiety/high-satiation foods and requires no calorie-counting. This report describes study methods of a comparative effectiveness trial of CC versus MyPlate. It also describes baseline findings involving demographic characteristics and their associations with primary outcome measures and covariates, including satiety/satiation, dietary quality and acculturation.
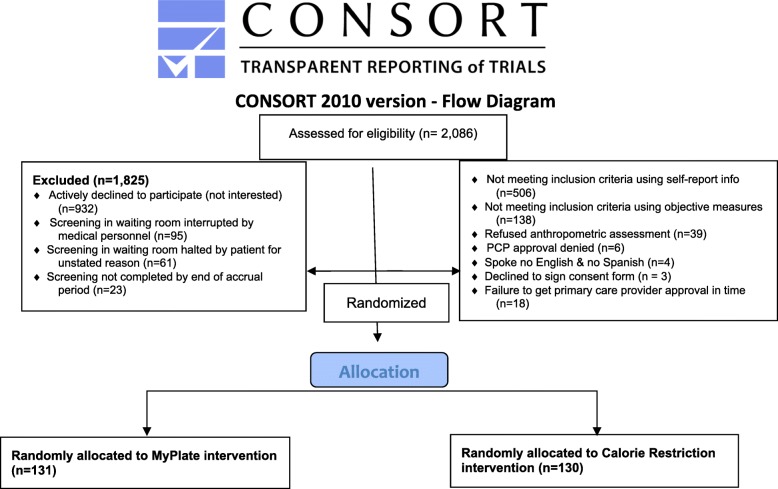
Methods: A comparative effectiveness trial was designed to compare the CC approach (n = 130) versus a MyPlate-based approach (n = 131) to treating patient overweight. Intervenors were trained community health workers. The 11 intervention sessions included two in-home health education sessions, two group education sessions, and seven telephone coaching sessions. Questionnaire and anthropometric assessments occurred at baseline, 6- and 12 months; food frequency questionnaires were administered at baseline and 12 months. Participants were overweight adult primary care patients of a federally qualified health center in Long Beach, California. Two measures of satiety/satiation and one measure of post-meal hunger comprised the primary outcome measures. Secondary outcomes included weight, waist circumference, blood pressure, dietary quality, sugary beverage intake, water intake, fruit and vegetable fiber intake, mental health and health-related quality of life. Covariates included age, gender, nativity status (U.S.-born, not U.S.-born), race/ethnicity, education, and acculturation.
Analysis: Baseline characteristics were compared using chi square tests. Associations between covariates and outcome measures were evaluated using multiple regression and logistic regression.
Results: Two thousand eighty-six adult patients were screened, yielding 261 enrollees who were 86% Latino, 8% African American, 4% White and 2% Other. Women predominated (95%). Mean age was 42 years. Most (82%) were foreign-born; 74% chose the Spanish language option. Mean BMI was 33.3 kg/m2; mean weight was 82 kg; mean waist circumference was 102 cm. Mean blood pressure was 122/77 mm. Study arms on key baseline measures did not differ except on dietary quality and sugary beverage intake. Nativity status was significantly associated with dietary quality.
Conclusions: The two treatment arms were well-balanced demographically at baseline. Nativity status is inversely related to dietary quality.
Trial registration: NCT02514889 , posted on 8/4/2015.
Keywords: Behavior change; Community health workers; Latino; Nativity; Obesity treatment; Primary care; Satiation; Satiety.
Conflict of interest statement
The authors declare that they have no competing interests.
Figures

References
-
- Centers for Disease Control (CDC) Table 53. Selected health conditions and risk factors, by age: U.S., selected years 1988–1994 through 2015–16.2018. 2018.
-
- Hales CM, Carroll MD, Fryar CD, Ogden CL. Prevalence of obesity among adults and youth: United States, 2015–2016. Hyattsville: National Center for Health Statistics; 2017.
