. 2019 Sep 12;93(19):e00970-19.
doi: 10.1128/JVI.00970-19. Print 2019 Oct 1.

Bile Salts Alter the Mouse Norovirus Capsid Conformation: Possible Implications for Cell Attachment and Immune Evasion

Affiliations

Bile Salts Alter the Mouse Norovirus Capsid Conformation: Possible Implications for Cell Attachment and Immune Evasion

Michael B Sherman et al. J Virol. .

Abstract

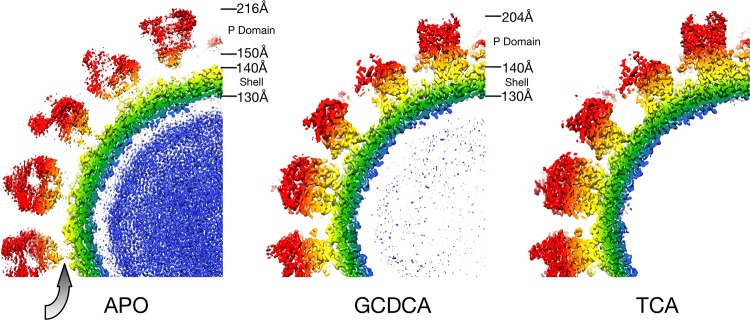
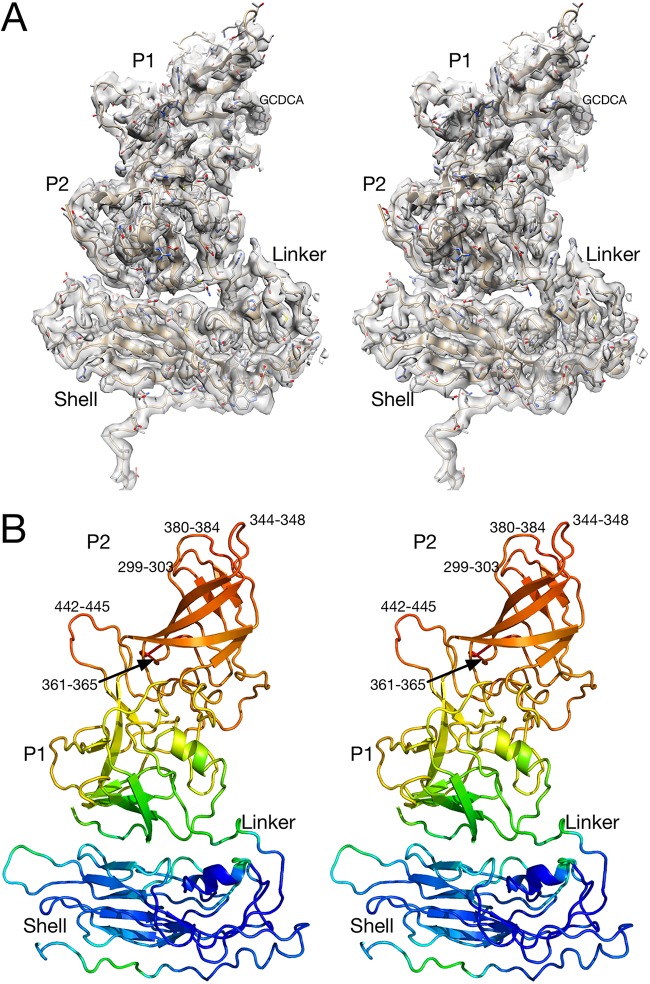
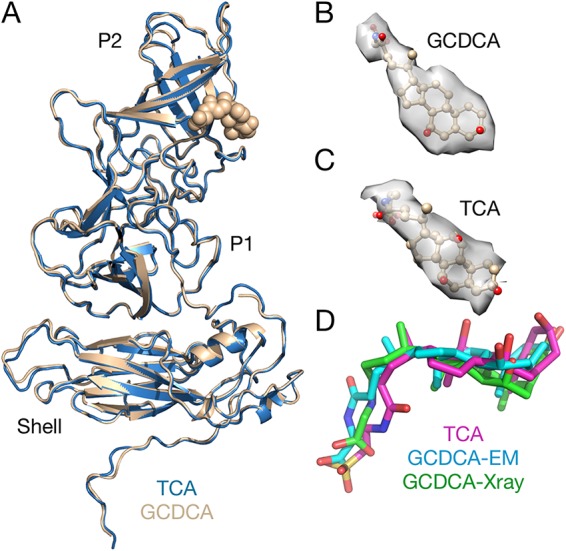
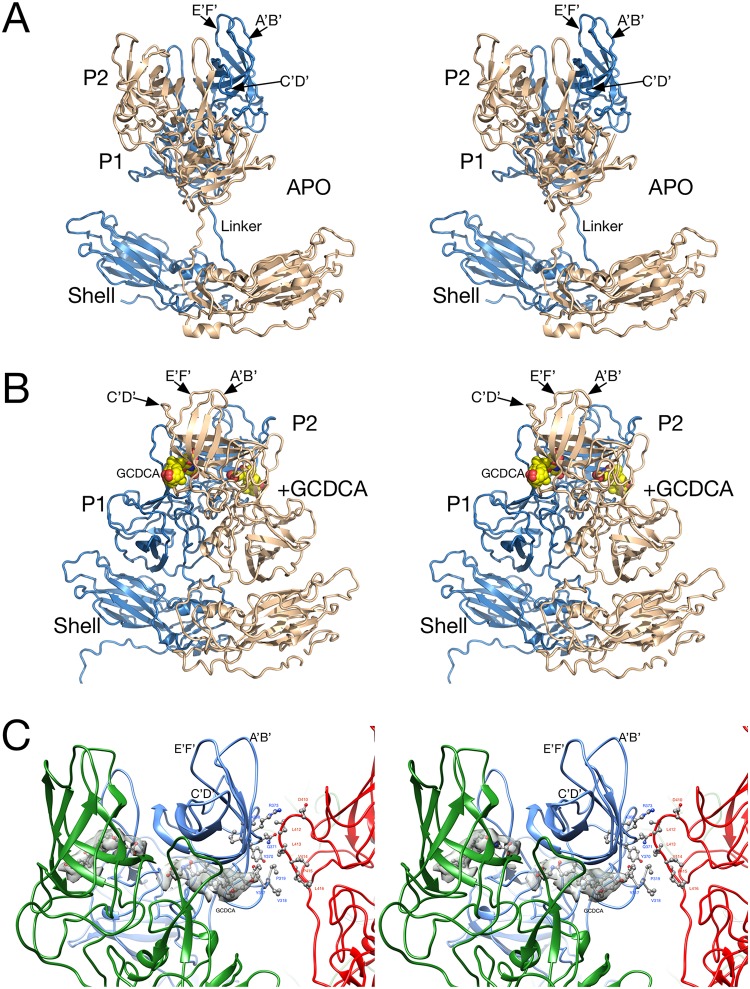
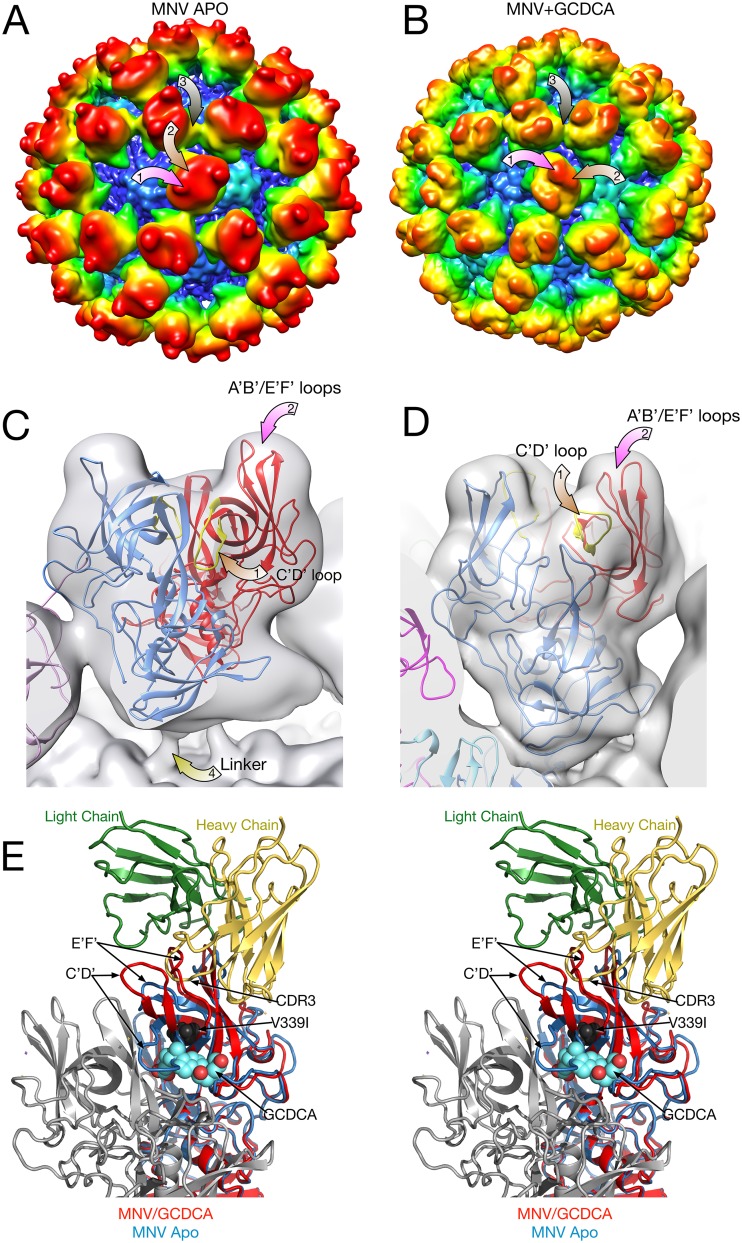
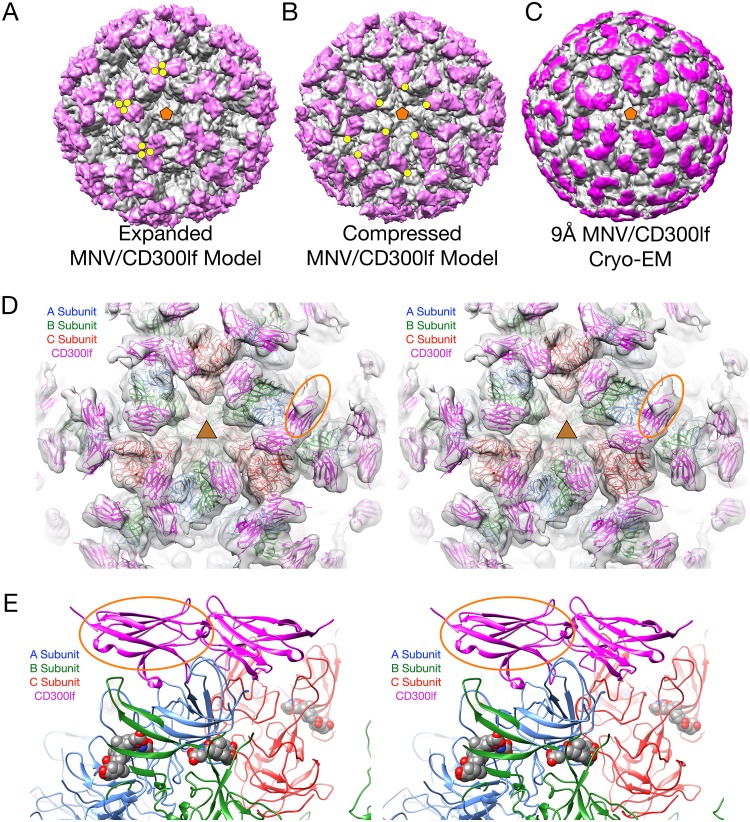
Caliciviruses are single-stranded RNA viruses with 180 copies of capsid protein comprising the T=3 icosahedral capsids. The main capsid feature is a pronounced protruding (P) domain dimer formed by adjacent subunits on the icosahedral surface while the shell domain forms a tight icosahedral sphere around the genome. While the P domain in the crystal structure of human Norwalk virus (genotype I.1) was tightly associated with the shell surface, the cryo-electron microscopy (cryo-EM) structures of several members of the Caliciviridae family (mouse norovirus [MNV], rabbit hemorrhagic disease virus, and human norovirus genotype II.10) revealed a "floating" P domain that hovers above the shell by nearly 10 to 15 Å in physiological buffers. Since this unusual feature is shared among, and unique to, the Caliciviridae, it suggests an important biological role. Recently, we demonstrated that bile salts enhance cell attachment to the target cell and increase the intrinsic affinity between the P domain and receptor. Presented here are the cryo-EM structures of MNV-1 in the presence of bile salts (∼3 Å) and the receptor CD300lf (∼8 Å). Surprisingly, bile salts cause the rotation and contraction of the P domain onto the shell surface. This both stabilizes the P domain and appears to allow for a higher degree of saturation of receptor onto the virus. Together, these results suggest that, as the virus moves into the gut and the associated high concentrations of bile, the entire capsid face undergoes a conformational change to optimize receptor avidity while the P domain itself undergoes smaller conformational changes to improve receptor affinity.IMPORTANCE Mouse norovirus and several other members of the Caliciviridae have been shown to have a highly unusual structure with the receptor binding protruding (P) domain only loosely tethered to the main capsid shell. Recent studies demonstrated that bile salts enhance the intrinsic P domain/receptor affinity and is necessary for cell attachment. Presented here are the high-resolution cryo-EM structures of apo MNV, MNV/bile salt, and MNV/bile salt/receptor. Bile salts cause a 90° rotation and collapse of the P domain onto the shell surface that may increase the number of available receptor binding sites. Therefore, bile salts appear to be having several effects on MNV. Bile salts shift the structural equilibrium of the P domain toward a form that binds the receptor and away from one that binds antibody. They may also cause the entire P domain to optimize receptor binding while burying a number of potential epitopes.

Keywords: murine; norovirus; virion structure.


Figures

FIG 1
FIG 1
Image reconstructions of apo-, GCDCA-, and TCA-bound forms of MNV. Each panel represents midsections of the image reconstructions and is colored blue to red according to radial distance. As with previous MNV image reconstructions in PBS buffer, the first panel shows that the P domain is fairly disordered and “floats” above the shell. The gray arrow denotes the gap between the shell and the P domains in the apo MNV reconstruction. In contrast, both GCDCA and TCA cause the collapse of the P domain onto the shell surface. In both cases, the quality of the P domain was of sufficient quality to trace the peptide chain.
FIG 2
FIG 2
Electron density of one of the subunits of the MNV/GCDCA complex and corresponding atomic model. (A) Stereo image of the density of one of the subunits. Note that the quality of the density is better toward the shell. (B) Ribbon diagram of one of the MNV/GCDCA subunits. The model is colored according to B values, blue to red for low to high B values, respectively. Also noted on this figure are the residues that are significantly disordered in the model.
FIG 3
FIG 3
Comparison of the MNV/GCDCA and MNV/TCA complexes. (A) Overlay of MNV/GCDCA (tan) and MNV/TCA (blue) complexes. There are no significant differences between the structures of the two complexes. (B and C) Isolated electron densities of the bound bile salts. (D) Comparison of the bound bile salts as observed in the cryo-EM and crystallographic structures.
FIG 4
FIG 4
Atomic models of the A/B subunit pairs for the apo (A) and GCDCA (B) MNV complexes. In these images, the A and B subunits are colored blue and tan, respectively. (A) Structure of the apo form of MNV. While the resolution of the shell domain was of sufficient quality to build an atomic model, a previously published crystal structure of the P domain (11) was used for modeling. (B) The P domain rotates by nearly 90° and drops down onto the shell in the presence of bile salts. The bound GCDCA is highlighted in yellow and red spheres. (C) Interactions between the P domains in the MNV/GCDCA complex when the capsid collapses in the presence of bile salts. The A, B, and C subunits are shown in blue, green, and red, respectively. Also shown in gray is the electron density of bound GCDCA.
FIG 5
FIG 5
Comparison of the P domains in the presence and absence of bile salts. For panels A to D, a 2-Å Gaussian filter was applied to the electron density maps so that they could be directly compared. (A and B) Surfaces of the apo and GCDCA forms of MNV, respectively, colored according to radial distances. The mauve arrows point to the locations of the A′B′/E′F′ loops and C′D′ loops, respectively. The brown arrow denotes the A/C subunit contact detailed in the stereo figure (panel E). Note the sharp protrusion in the apo form that is a ridge in the GCDCA-bound form. (C and D) Details of one of the P domain dimers. For panel C, the atomic model is the previously published apo structure (11), with the open and closed A′B′/E′F′ loop structures colored in blue and red, respectively. For panel D, the atomic model of the P domain/GCDCA complex is shown (21). (E) Stereo image of the comparison of the atomic structures of the P domain in the presence or absence of GCDCA and resulting differences in how a neutralizing antibody would bind. The heavy and light chains of bound 3D3 antibody (19) are shown in yellow and green, respectively. The bound GCDCA is represented by cyan and red spheres. The location of the 3D3 escape mutant, V339I, is represented by black spheres. The blue ribbon structure is of the “open” conformation of the apo P domain where that A′B′/E′F′ loops are splayed apart. In contrast, the red ribbon shows the conformation of the GCDCA-bound P domain (21) and how the loops in this conformation would likely prevent binding of the neutralizing antibody.
FIG 6
FIG 6
Structure of MNV complexed with the receptor, CD300lf. In panels A to C, the virus structure is colored gray, and the receptor is mauve. (A) Model showing the expanded form of MNV. The CD300lf was placed onto the surface using the atomic structure of the P domain/CD300lf complex (21). An icosahedral 5-fold axis is represented by an orange pentagon, and the C termini of some of the CD300lf molecules are highlighted with yellow circles. (B) Using the atomic model of the MNV/GCDCA complex determined here, the CD300lf molecules were placed onto the surface of the virion using the atomic structure of the P domain/CD300lf complex. (C) The 9-Å cryo-EM structure of the MNV/GCDCA/CD300lf complex. The density representing the receptor is highlighted in mauve. (D) Model used in panel B overlaid with the cryo-EM density of the MNV/GCDCA/CD300lf shown in panel C. This view is looking down on an icosahedral 3-fold axis that is denoted by the yellow triangle. Highlighted by the yellow ellipse is the density for the CD300lf bound to the A subunit. This density is notably weaker than those binding to the B and C subunits and may be due to partial occupancy. (E) Stereo diagram showing only the ribbon models for an A/B dimer that interacts with an icosahedrally related C/C dimer. The CD300lf bound to the A subunit in panel D is also highlighted with an orange oval in this figure. Note that the CD300lf bound to the A and C subunits are likely too close to be bound simultaneously.

References

    1. Hutson AM, Atmar RL, Estes MK. 2004. Norovirus disease: changing epidemiology and host susceptibility factors. Trends Microbiol 12:279–287. doi: 10.1016/j.tim.2004.04.005. - DOI - PMC - PubMed
    1. Moe CL, Sobsey MD, Stewart PW, Crawford-Brown D. 1999. Estimating the risk of human calicivirus infection from drinking water, abstr. International Workshop on Human Caliciviruses, Atlanta, GA.
    1. Prasad BVV, Hardy ME, Dokland T, Bella J, Rossmann MG, Estes MK. 1999. X-ray crystallographic structure of the Norwalk virus capsid. Science 286:287–290. doi: 10.1126/science.286.5438.287. - DOI - PubMed
    1. Prasad BV, Hardy ME, Jiang X, Estes MK. 1996. Structure of Norwalk virus. Arch Virol Suppl 12:237–242. - PubMed
    1. Prasad BV, Matson DO, Smith AW. 1994. Three-dimensional structure of calicivirus. J Mol Biol 240:256–264. doi: 10.1006/jmbi.1994.1439. - DOI - PubMed

Publication types