. 2019 Jul 25;4(14):e123231.
doi: 10.1172/jci.insight.123231.

Lipidomics unveils lipid dyshomeostasis and low circulating plasmalogens as biomarkers in a monogenic mitochondrial disorder

Affiliations

Lipidomics unveils lipid dyshomeostasis and low circulating plasmalogens as biomarkers in a monogenic mitochondrial disorder

Matthieu Ruiz et al. JCI Insight. .

Abstract

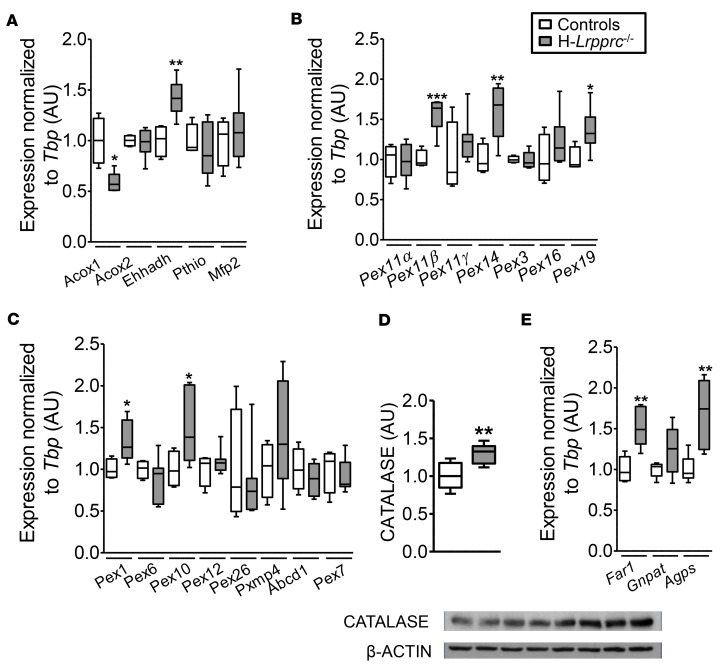
Mitochondrial dysfunction characterizes many rare and common age-associated diseases. The biochemical consequences, underlying clinical manifestations, and potential therapeutic targets, remain to be better understood. We tested the hypothesis that lipid dyshomeostasis in mitochondrial disorders goes beyond mitochondrial fatty acid β-oxidation, particularly in liver. This was achieved using comprehensive untargeted and targeted lipidomics in a case-control cohort of patients with Leigh syndrome French-Canadian variant (LSFC), a mitochondrial disease caused by mutations in LRPPRC, and in mice harboring liver-specific inactivation of Lrpprc (H-Lrpprc-/-). We discovered a plasma lipid signature discriminating LSFC patients from controls encompassing lower levels of plasmalogens and conjugated bile acids, which suggest perturbations in peroxisomal lipid metabolism. This premise was reinforced in H-Lrpprc-/- mice, which compared with littermates recapitulated a similar, albeit stronger peroxisomal metabolic signature in plasma and liver including elevated levels of very-long-chain acylcarnitines. These mice also presented higher transcript levels for hepatic markers of peroxisome proliferation in addition to lipid remodeling reminiscent of nonalcoholic fatty liver diseases. Our study underscores the value of lipidomics to unveil unexpected mechanisms underlying lipid dyshomeostasis ensuing from mitochondrial dysfunction herein implying peroxisomes and liver, which likely contribute to the pathophysiology of LSFC, but also other rare and common mitochondrial diseases.

Keywords: Cell Biology; Fatty acid oxidation; Metabolism; Mitochondria; Monogenic diseases.


Conflict of interest statement

Conflict of interest: The authors have declared that no conflict of interest exists.

Figures

Figure 1
Figure 1. Untargeted and targeted lipidomics unveil major plasma lipid dyshomeostasis, including lower circulating plasmalogen levels in LSFC patients.
(A) Volcano plot from LC-QTOF–based untargeted lipidomics of plasma from fasted LSFC and control subjects (n = 9/group) depicting the 2,052 features obtained following MS data processing. The x axis corresponds to fold changes (FCs) of MS signal intensity values for all these features in LSFC patients vs. control (log2) and the y axis to P values (–log10). Using a corrected P value (P-corr) threshold of 0.2 (corresponding to an uncorrected P value of 0.0034; horizontal red dotted line) and an FC >1.35 or <0.74 (vertical red dotted lines), 29 features significantly discriminated LSFC patients from controls, of which 19 were increased (red dots) and 10 decreased (green dots). See also Supplemental Table 1 for the list of lipids identified by MS/MS with FCs and P values (unpaired Student’s t test followed by Benjamini-Hochberg correction). (B) Dot plot of 13 selected lipids significantly discriminating LSFC patients from controls and identified by MS/MS using LC-QTOF. Each dot represents a log2-transformed patient/matched control signal intensity ratio (n = 9) for the indicated lipid (sub)classes with their acyl side chain(s) — (i) 2 acylcarnitines (ACs): AC16:1 and AC18:1, (ii) 7 glycerolipids: triacylglycerol (TG) and diacylglycerol (DG), (iii) 1 cholesteryl ester (CE), (iv) 4 plasmalogens: lysophosphatidylcholine (LPC) plasmalogens (LPC-O) and phosphatidylcholine plasmalogens (PC-O). The underscore symbol “_” beside the acyl side chain for TGs refers to acyl chains for which the sn position remains to be ascertained. (C) Box plots of LC-QQQ–based lipidomic analysis of plasmalogens, 21 of which were detected in plasma from LSFC patients (gray; n = 9) and controls (white; n = 9): 2 LPC-O, 15 PC-O, and 4 phosphatidylethanolamine (PE) plasmalogens (PE-O). Statistics using paired Student’s t test: *P < 0.05, **P < 0.01 before and $P-corr < 0.05 after Benjamini-Hochberg correction. See also Supplemental Figure 1, A–C, for corresponding plots of results obtained in the nutrient-uptake challenge condition.
Figure 2
Figure 2. Targeted profiling of acylcarnitines (ACs) and lysophosphatidylcholine (LPC) 26:0 and unconjugated/conjugated bile acids (BAs) reveals additional lipid perturbations in plasma from LSFC patients.
(A and B) LC-QQQ–based profiling of 91 ACs in plasma from LSFC patients (gray; n = 9) and controls (white; n = 9) after a nutrient-uptake challenge. (A) Dot plot of P values obtained using paired Student’s t test analysis for the various AC species: short-chain (SCAC, black), medium-chain (MCAC, red), long-chain (LCAC, orange), hydroxylated short/medium–chain (S/MCAC-OH, green), hydroxylated long-chain (LCAC-OH, pink), odd-numbered carbon chain (dark blue), dicarboxylic (DCAC, light blue), and very-long-chain (VLCAC, purple). Significantly elevated ACs are above the dotted line (black P < 0.05, red P-corr < 0.05). (B) Box plots of selected significantly (according to P-corr) elevated AC species in LSFC patients (gray) and controls (white). Cx refers to the number of carbons in the acyl chain of AC species and the symbol # to isomers of AC species, of which the structure remains to be ascertained (e.g., AC#1, AC#2, etc.). (C) Box plots of quantitative values for VLCAC (AC26:0) and LPC 26:0. (D and E) Box plots from LC-QQQ–based profiling of plasma from fasted LSFC patients (gray; n = 4–9) and controls (white; n = 6–9) for (D) unconjugated BA, (E) glyco- and tauro-conjugated BAs. Unequal distribution is ascribed to values below the limit of detection. Statistics using 2-tailed unpaired Student’s t test: *P < 0.05, **P < 0.01, ***P < 0.001 before and $P < 0.05, $$P < 0.01, $$$P < 0.001 after Benjamini-Hochberg correction. CA, cholic acid; CDCA, chenodeoxycholic acid; DCA, deoxycholic acid; GCA, glycocholic acid; GDCA, glycodeoxycholic acid; GCDCA, glycochenodeoxycholic acid; TCA, taurocholic acid; TDCA, taurodeoxycholic acid; TCDCA, taurochenodeoxycholic acid. See also Supplemental Figure 2, A–C, for corresponding plots of results obtained for the fasting and Supplemental Figure 2, D–F, for nutrient-uptake challenge condition.
Figure 3
Figure 3. Untargeted lipidomics in plasma from H-Lrpprc–/– mice identifies multiple lipid changes including lower levels of plasmalogens and docosahexaenoic acid (DHA).
(A) Volcano plot of LC-QTOF–based untargeted lipidomics from plasma of fed H-Lrpprc–/– mice (n = 13) and their littermate controls (n = 8) depicting the 1,295 features obtained following MS data processing. Using a P-corr threshold of 0.05 (corresponding to an uncorrected P value of 0.01; horizontal red dotted line) and a FC >2 or <0.5 (vertical red dotted lines), 98 features significantly discriminated H-Lrpprc–/– mice vs. controls, of which 32 were increased (red dots) and 66 were decreased (green dots). See also Supplemental Table 2 for the list of lipids identified by MS/MS with FCs and P values (2-tailed unpaired Student’s t test and with Benjamini-Hochberg correction). (BD) Dot plots of selected lipids significantly discriminating H-Lrpprc–/– mice from controls and identified by MS/MS using LC-QTOF. Each dot represents a log2-transformed signal intensity ratio for the indicated lipid (sub)classes with their acyl side chain(s): (B) 1 AC: AC18:0 and 15 glycerolipids (TGs); (C) 6 CEs; (D) 9 glycerophospholipids: 2 LPC, 5 PC, and 2 PE-plasmalogens (PE-O). The underscore symbol “_” beside the acyl side chain for TGs and glycerophospholipids refers to acyl chains for which the sn position remains to be ascertained. (E and F) Box plots of (E) plasmalogens and (F) DHA identified through manual alignment of this mouse plasma data set with human and mouse reference data sets for which the various plasmalogens had been previously identified by MS/MS. Statistics using 2-tailed unpaired Student’s t test: *P < 0.05; **P < 0.01, ***P < 0.001 before and $P < 0.05, $$P < 0.01 after Benjamini-Hochberg correction.
Figure 4
Figure 4. Untargeted lipidomics reveals major lipid perturbations in livers from H-Lrpprc–/– mice characteristic of nonalcoholic fatty liver disease.
(AD) LC-QTOF–based untargeted lipidomics from livers of fed H-Lrpprc–/– mice (n = 13) and their littermate controls (n = 8). (A) Volcano plot depicting the 1,386 features obtained following MS data processing. Using a P-corr threshold of 0.05 (corresponding to an uncorrected P value of 0.015; horizontal red dotted line) and an FC >2.5 or <0.4 (vertical red dotted lines), 92 features significantly discriminated H-Lrpprc–/– mice vs. controls, of which 60 were increased (red dots) and 32 decreased (green dots). See also Supplemental Table 3 for the list of lipids identified by MS/MS with FCs and P values (unpaired Student’s t test and with Benjamini-Hochberg correction). (BD) Dot plots of selected lipids significantly discriminating H-Lrpprc–/– mice from controls and identified by MS/MS. Each dot represents a log2-transformed signal intensity ratio for the indicated lipid (sub)classes with their acyl side chain(s): (B) 15 glycerolipids (TGs); (C) 22 glycerophospholipids: 9 PC, 9 PE, 2 phosphatidylglycerol (PG) and 2 phosphatidylserine (PS); and (D) 4 ACs.
Figure 5
Figure 5. Hepatic levels of plasmalogens, acylcarnitines (ACs), and bile acids (BAs) in H-Lrpprc–/– mice are consistent with peroxisomal lipid metabolism remodeling.
LC-MS–based analysis of livers from fed H-Lrpprc–/– mice (n = 13; gray) and their littermate controls (n = 8; white). (A) Box plots of 9 plasmalogens identified through manual alignment of mouse plasma data set with human and mouse reference data sets for which the various plasmalogens had been previously identified by MS/MS. (B) Dot plot of P values obtained using paired Student’s t test analysis for the various AC species: short-chain (SCAC, black), medium-chain (MCAC, red), long-chain (LCAC, orange), hydroxylated short/medium–chain (S/MCAC-OH, green), hydroxylated long-chain (LCAC-OH, pink), odd-numbered carbon chain (dark blue), dicarboxylic (DCAC, light blue), and very-long-chain (VLCAC, purple). Significantly elevated ACs are above the dotted line (P-corr < 0.05 corresponding to a P value of 0.035). See also Supplemental Figure 5 for the most representative increased ACs. (C) Box plots of LC-QQQ–based profiling of VLC-ACs and LPC 26:0. (D) Box plots of LC-QQQ–based analysis of conjugated/unconjugated BAs expressed as ratios. Statistics using 2-tailed unpaired Student’s t test: *P < 0.05; **P < 0.01, ***P < 0.001 before and $P < 0.05, $$P < 0.01, $$$P < 0.001 after Benjamini-Hochberg correction.
Figure 6
Figure 6. Livers from H-Lrpprc–/– mice display changes in molecular markers of biogenesis, fatty acid oxidation, and plasmalogen synthesis in peroxisomes.
Levels of transcripts and protein were assessed in whole-liver extracts from H-Lrpprc–/– mice (gray, n = 13) and controls (white, n = 8). (AD) Box plots depicting levels of mRNA, normalized to Tbp, are shown for markers of (A) fatty acid oxidation (Acox1, Acox2, Ehhadh, Pthio, Mfp2), (B) peroxisomal biogenesis (Pex11α, Pex11β, Pex11γ, Pex14, Pex3, Pex16, Pex19), and (C) transport (Pex1, Pex6, Pex10, Pex12, Pex26, PXMP4, ABCD1, Pex7). (D) Representative image and quantitation (histogram) of catalase and β-actin protein expression. (E) Markers of plasmalogen synthesis (Far1, Gnpat, Agps). *P < 0.05, ** P < 0.01, ***P < 0.001 using 2-tailed unpaired Student’s t test.
Figure 7
Figure 7. Mitochondrial and peroxisomal pathway contribution to the lipidomic signature observed in LSFC patients and in H-Lrpprc–/– mice.
This schematic depicts the metabolic pathways in mitochondria (in blue) and peroxisomes (in green) that are related to the lipid perturbations reported in this study (increased or decreased levels, as indicated by upward or downward arrows, respectively) in plasma and/or liver (the green star indicates changes in liver only). The lightning bolt indicates the proposed sites of pathway perturbations. Beyond OXPHOS deficiency, LRPPRC-dependent mitochondrial dysfunction results in major perturbations of lipid metabolism. Here we confirm and extend our previous observations of an important dysregulation of mitochondrial FA β-oxidation (12, 15), as suggested by the accumulation of ACs of various chain length, especially LCACs, MCACs, and hydroxylated ACs. This dysregulation is likely to result in cytosolic FA overflow, which favors tissue triglyceride (TG) accumulation, but also FA elongation, which in turn promotes the synthesis of VLCFAs, which are substrates for peroxisomal β-oxidation (shown in green). The accumulation in VLCACs in liver tissues suggests, however, a mismatch between VLCFA formation and their peroxisomal oxidation, which may be reduced as suggested by decreased Acox1 (downward red arrow) expression in liver. The presence of additional perturbations in peroxisomal metabolism is also reflected by changes in livers and plasma of (i) odd-numbered carbon chain ACs (increased), which may result from impaired phytanic acid oxidation, as well as (ii) lower levels of DHA and conjugated bile acids. Lastly, this is also reflected by the lower circulating levels of plasmalogens, which may exert a positive feedback (red dashed arrow) on Far1 expression (upward red arrow), and thereby result in enhanced hepatic plasmalogen biosynthesis (suggested by higher Agps expression; upward red arrow) and tissue levels.

Similar articles

Cited by

References

    1. Debray FG, Lambert M, Mitchell GA. Disorders of mitochondrial function. Curr Opin Pediatr. 2008;20(4):471–482. doi: 10.1097/MOP.0b013e328306ebb6. - DOI - PubMed
    1. Lightowlers RN, Taylor RW, Turnbull DM. Mutations causing mitochondrial disease: What is new and what challenges remain? Science. 2015;349(6255):1494–1499. doi: 10.1126/science.aac7516. - DOI - PubMed
    1. Lightowlers RN, Chrzanowska-Lightowlers ZM. Human pentatricopeptide proteins: only a few and what do they do? RNA Biol. 2013;10(9):1433–1438. doi: 10.4161/rna.24770. - DOI - PMC - PubMed
    1. Manna S. An overview of pentatricopeptide repeat proteins and their applications. Biochimie. 2015;113:93–99. doi: 10.1016/j.biochi.2015.04.004. - DOI - PubMed
    1. Mootha VK, et al. Identification of a gene causing human cytochrome c oxidase deficiency by integrative genomics. Proc Natl Acad Sci USA. 2003;100(2):605–610. doi: 10.1073/pnas.242716699. - DOI - PMC - PubMed

Publication types

MeSH terms