

Understanding Calcium-Mediated Adhesion of Nanomaterials in Reservoir Fluids by Insights from Molecular Dynamics Simulations
- PMID: 31341192
- PMCID: PMC6656760
- DOI: 10.1038/s41598-019-46999-8
Understanding Calcium-Mediated Adhesion of Nanomaterials in Reservoir Fluids by Insights from Molecular Dynamics Simulations
Abstract
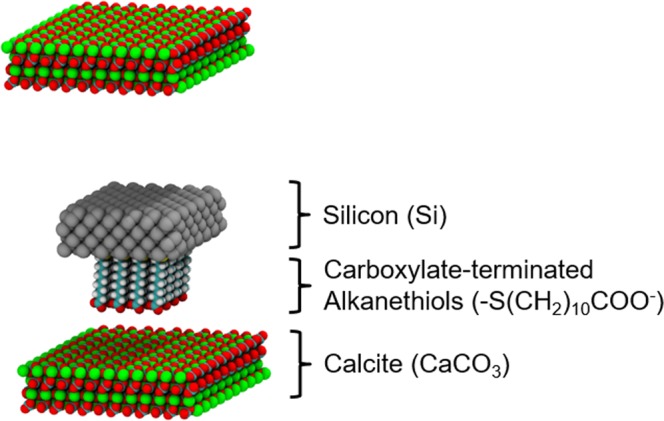
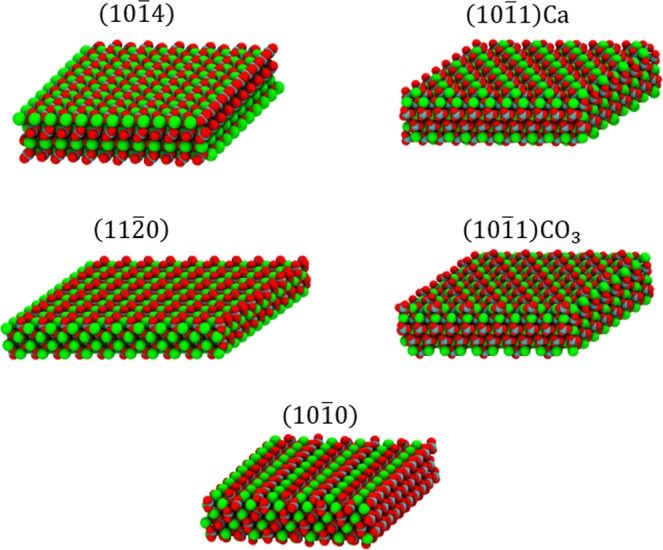
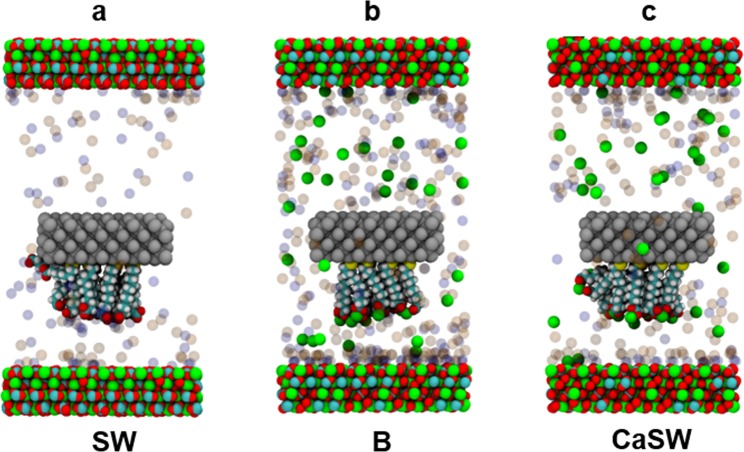
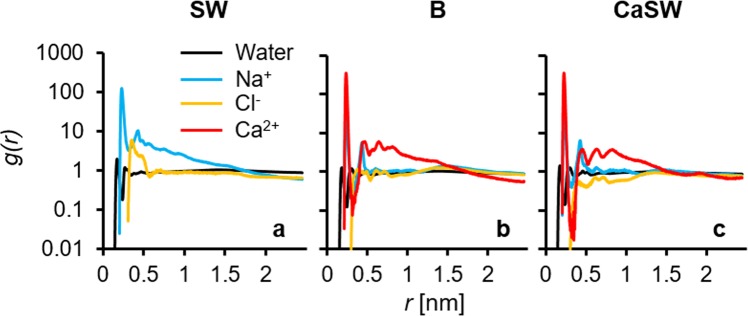
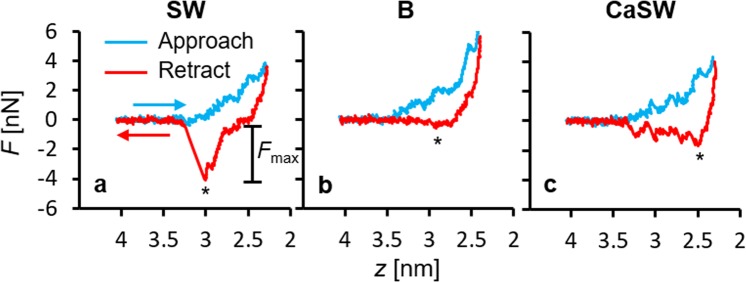
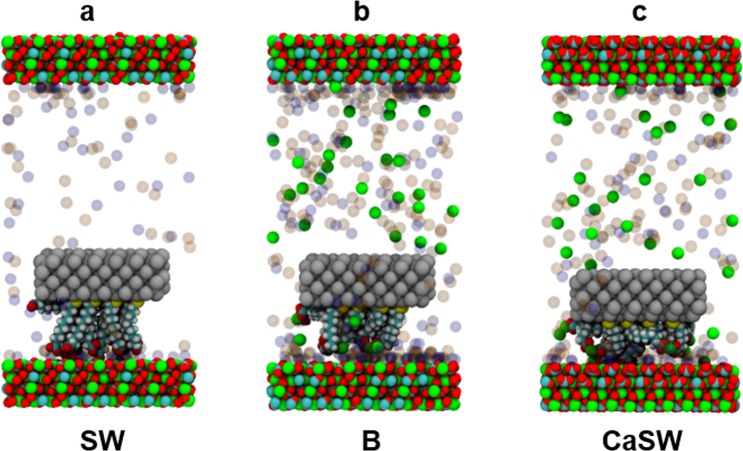
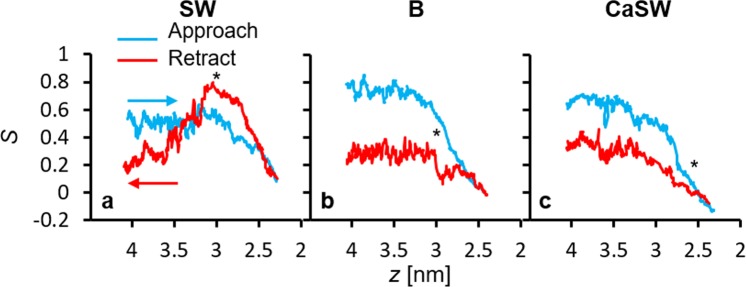
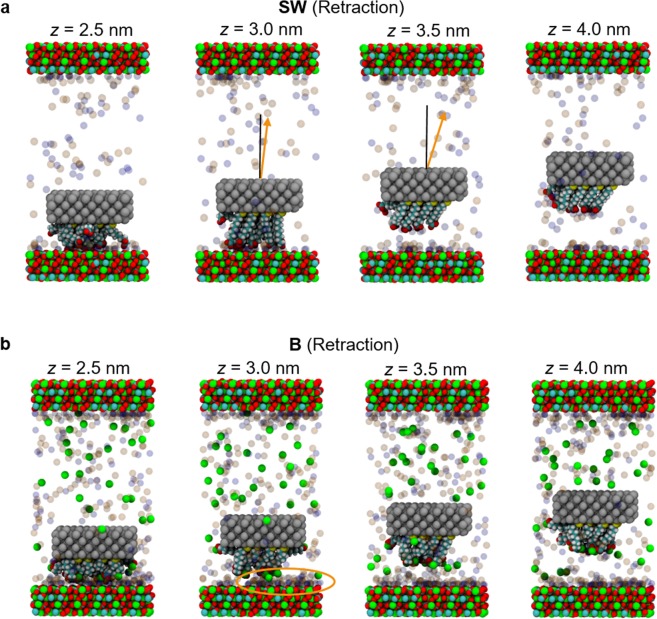
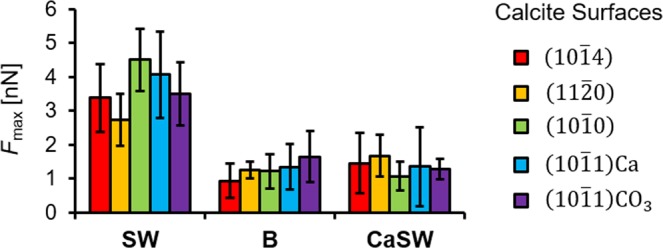
Interest in nanomaterials for subsurface applications has grown markedly due to their successful application in a variety of disciplines, such as biotechnology and medicine. Nevertheless, nanotechnology application in the petroleum industry presents greater challenges to implementation because of the harsh conditions (i.e. high temperature, high pressure, and high salinity) that exist in the subsurface that far exceed those present in biological applications. The most common subsurface nanomaterial failures include colloidal instability (aggregation) and sticking to mineral surfaces (irreversible retention). We previously reported an atomic force microscopy (AFM) study on the calcium-mediated adhesion of nanomaterials in reservoir fluids (S. L. Eichmann and N. A. Burnham, Sci. Rep. 7, 11613, 2017), where we discovered that the functionalized and bare AFM tips showed mitigated adhesion forces in calcium ion rich fluids. Herein, molecular dynamics reveal the molecular-level details in the AFM experiments. Special attention was given to the carboxylate-functionalized AFM tips because of their prominent ion-specific effects. The simulation results unambiguously demonstrated that in calcium ion rich fluids, the strong carboxylate-calcium ion complexes prevented direct carboxylate-calcite interactions, thus lowering the AFM adhesion forces. We performed the force measurement simulations on five representative calcite crystallographic surfaces and observed that the adhesion forces were about two to three fold higher in the calcium ion deficient fluids compared to the calcium ion rich fluids for all calcite surfaces. Moreover, in calcium ion deficient fluids, the adhesion forces were significantly stronger on the calcite surfaces with higher calcium ion exposures. This indicated that the interactions between the functionalized AFM tips and the calcite surfaces were mainly through carboxylate interactions with the calcium ions on calcite surfaces. Finally, when analyzing the order parameters of the tethered functional groups, we observed significantly different behavior of the alkanethiols depending on the absence or presence of calcium ions. These observations agreed well with AFM experiments and provided new insights for the competing carboxylate/calcite/calcium ion interactions.
Conflict of interest statement
The authors declare no competing interests.
Figures
Similar articles
-
Calcium-Mediated Adhesion of Nanomaterials in Reservoir Fluids.Sci Rep. 2017 Sep 14;7(1):11613. doi: 10.1038/s41598-017-11816-7. Sci Rep. 2017. PMID: 28912550 Free PMC article.
-
Adhesive forces between two cleaved calcite surfaces in NaCl solutions: The importance of ionic strength and normal loading.J Colloid Interface Sci. 2018 Dec 15;532:605-613. doi: 10.1016/j.jcis.2018.08.027. Epub 2018 Aug 10. J Colloid Interface Sci. 2018. PMID: 30114650
-
Investigation of the effects of ions on short-range non-DLVO forces at the calcite/brine interface and implications for low salinity oil-recovery processes.J Colloid Interface Sci. 2019 Sep 15;552:295-311. doi: 10.1016/j.jcis.2019.05.049. Epub 2019 May 17. J Colloid Interface Sci. 2019. PMID: 31132632
-
The role of macromolecules in the formation of kidney stones.Urolithiasis. 2017 Feb;45(1):57-74. doi: 10.1007/s00240-016-0948-8. Epub 2016 Dec 2. Urolithiasis. 2017. PMID: 27913854 Free PMC article. Review.
-
Probing bacterial interactions: integrated approaches combining atomic force microscopy, electron microscopy and biophysical techniques.Micron. 2005;36(4):293-320. doi: 10.1016/j.micron.2004.11.005. Epub 2005 Feb 17. Micron. 2005. PMID: 15857770 Review.
Cited by
-
Ca2+ Ions Decrease Adhesion between Two (104) Calcite Surfaces as Probed by Atomic Force Microscopy.ACS Earth Space Chem. 2021 Oct 21;5(10):2827-2838. doi: 10.1021/acsearthspacechem.1c00220. Epub 2021 Oct 4. ACS Earth Space Chem. 2021. PMID: 34712891 Free PMC article.
-
Controlling water-mediated interactions by designing self-assembled monolayer coatings.Sci Rep. 2021 Apr 19;11(1):8459. doi: 10.1038/s41598-021-87708-8. Sci Rep. 2021. PMID: 33875723 Free PMC article.
References
-
- Kanj, M. Y., Rashid, M. & Giannelis, E. P. Industry first field trial of reservoir nanoagents. In SPE Middle East Oil and Gas Show and Conference. (Society of Petroleum Engineers, 2011).
-
- Kosynkin, D. & Alaskar, M. Oil industry first interwell trial of reservoir nanoagent tracers. In SPE Annual Technical Conference and Exhibition. (Society of Petroleum Engineers, 2016).
-
- Berlin JM, et al. Engineered nanoparticles for hydrocarbon detection in oil-field rocks. Energy Environ. Sci. 2011;4:505–509. doi: 10.1039/C0EE00237B. - DOI
-
- Hwang C-C, et al. Highly stable carbon nanoparticles designed for downhole hydrocarbon detection. Energy Environ. Sci. 2012;5:8304–8309. doi: 10.1039/c2ee21574h. - DOI
-
- Javadpour F, Nicot J-P. Enhanced CO2 storage and sequestration in deep saline aquifers by nanoparticles: commingled disposal of depleted uranium and CO2. Transport Porous Med. 2011;89:265–284. doi: 10.1007/s11242-011-9768-z. - DOI
LinkOut - more resources
Full Text Sources
Medical
Miscellaneous
