. 2019 Jul 24;9(1):10745.
doi: 10.1038/s41598-019-47353-8.

Terbium ion as RNA tag for slide-free pathology with deep-ultraviolet excitation fluorescence

Affiliations

Terbium ion as RNA tag for slide-free pathology with deep-ultraviolet excitation fluorescence

Yasuaki Kumamoto et al. Sci Rep. .

Abstract

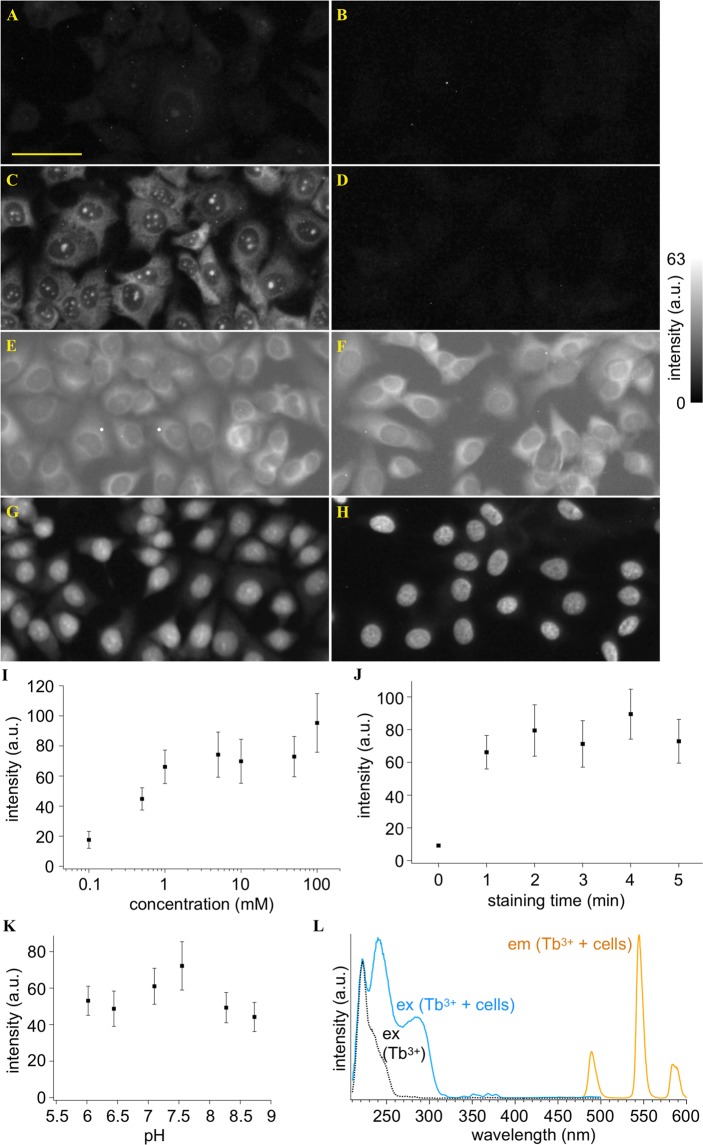
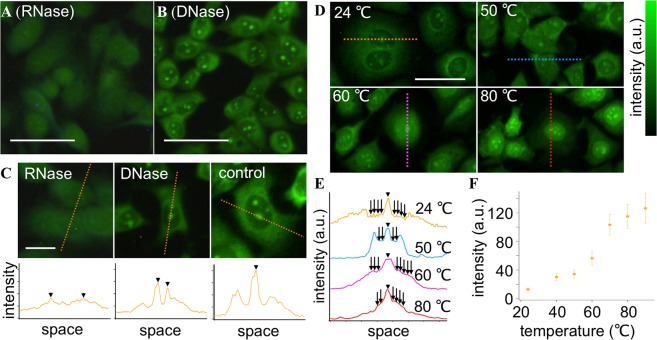
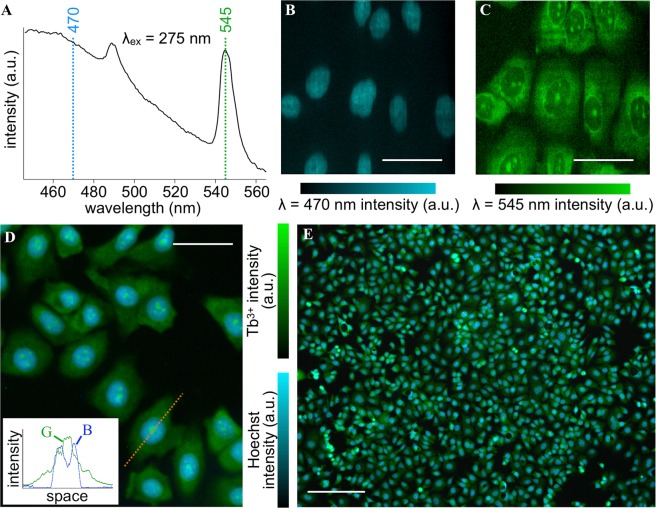
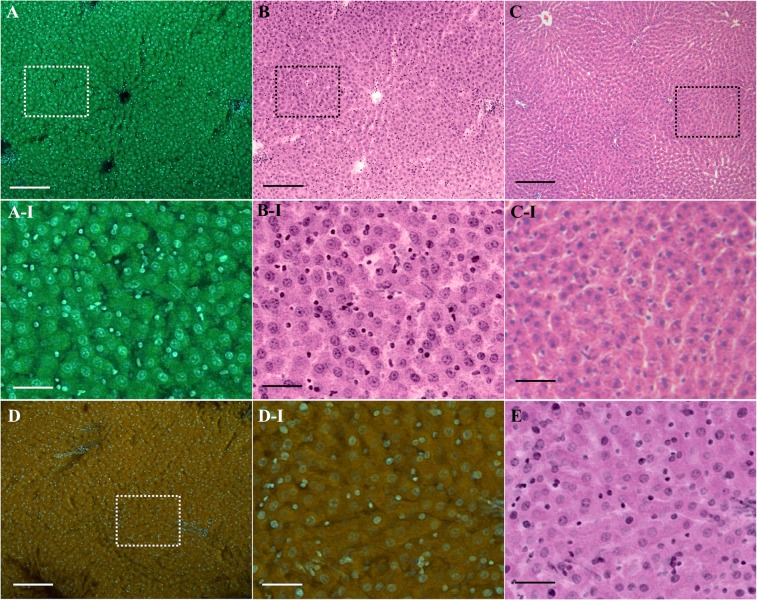
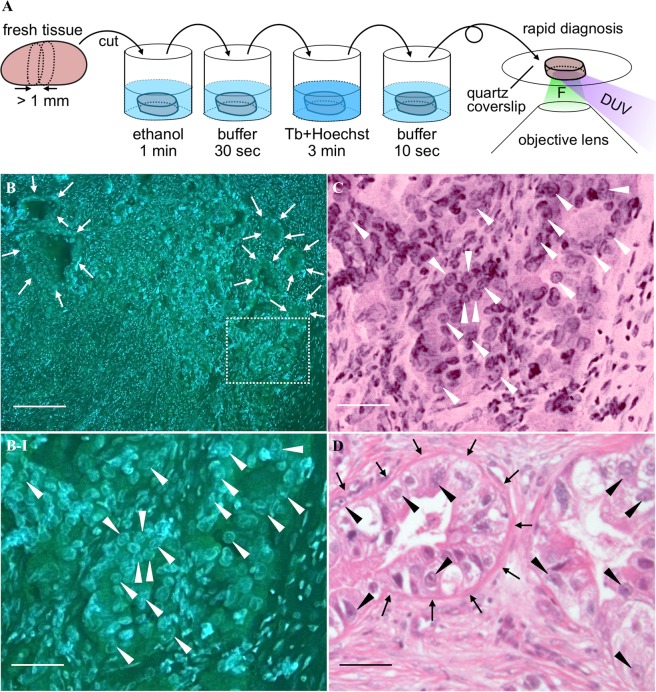
Deep-ultraviolet excitation fluorescence microscopy has enabled molecular imaging having an optical sectioning capability with a wide-field configuration and its usefulness for slide-free pathology has been shown in recent years. Here, we report usefulness of terbium ions as RNA-specific labeling probes for slide-free pathology with deep-ultraviolet excitation fluorescence. On excitation in the wavelength range of 250-300 nm, terbium ions emitted fluorescence after entering cells. Bright fluorescence was observed at nucleoli and cytoplasm while fluorescence became weak after RNA decomposition by ribonuclease prior to staining. It was also found that the fluorescence intensity at nucleoplasm increased with temperature during staining and that this temperature-dependent behavior resembled temperature-dependent hypochromicity of DNA due to melting. These findings indicated that terbium ions stained single-stranded nucleic acid more efficiently than double-stranded nucleic acid. We further combined terbium ions and DNA-specific dyes for dual-color imaging. In the obtained image, nucleolus, nucleoplasm, and cytoplasm were distinguished. We demonstrated the usefulness of dual-color imaging for rapid diagnosis of surgical specimen by showing optical sectioning of unsliced tissues. The present findings can enhance deep-ultraviolet excitation fluorescence microscopy and consequently expand the potential of fluorescence microscopy in life sciences.


Conflict of interest statement

T.T. received research grant from Terasaki Electric Co., Ltd. Y.K., T.M. and T.T. filed the patent related to this study; applicant, status, and application number are Kyoto Prefectural Public University Corporation, pending, and 2018-218828, respectively. Names of inventors are Tetsuro Takamatsu, Yasuaki Kumamoto, Tatsuya Matsumoto, Shujiro Hamano, Seiji Maehara, and Shigeyuki Fukai. Methods for fluorescence staining by Tb3+ and DNA-specific dyes are summarized in the patent. H.T. declare no potential conflict of interest.

Figures

Figure 1
Figure 1
DUV-excitation fluorescence of MCF-7 cells stained with and without Tb3+. (AG) Fluorescence images of the cells treated with (A) a Tb3+ solution of H2O, (B) an H2O solution without Tb3+, (C) a Tb3+ solution of D2O, and (D) a D2O solution without Tb3+. For comparison, fluorescence images of the cells stained with (E) Rhodamine B, (F) eosin Y, (G) PI, and (H) Hoechst 33342 are also shown. Scale bar corresponds to 50 µm. All the images were converted to 8-bits grayscale images from the RGB images measured with an RGB camera. Maximal values of brightness in (DH) were adjusted so that difference in the fluorescence intensity distributions could be easily found. Brightness in (AC) were adjusted to be the same as that in (D) so that the remarkably high fluorescence intensity of Tb3+ in D2O could be recognized. (IK) Dependencies of fluorescence intensity on (I) Tb3+ concentration, (J) treatment period, and (K) solution pH. Squares and error bars indicate means and standard deviations of fluorescence intensity for 100 cells under each condition. (L) Excitation and emission spectra of the cells immersed in the 10 mM Tb3+ solution of D2O, as well as an excitation spectrum of the 10 mM Tb3+ solution of D2O. The excitation wavelength was 285 nm. The emission wavelength detected for measuring the excitation spectra was adjusted to 546 nm. The Tb3+ concentration, treatment period, and solution pH were 50 mM, 5 min, and 7, respectively, unless noted.
Figure 2
Figure 2
Cytochemical and spectroscopic analyses for revealing Tb3+-stained molecules in the cells. (A,B) DUV-excitation fluorescence images of cells treated with (A) RNase and (B) DNase and subsequently stained with Tb3+. (C) Line profiles of the Tb3+ fluorescence intensity for RNase-treated, DNase-treated, and non-treated (control) cells. (DF) Temperature-dependent Tb3+ staining results. Representative fluorescence images of the cells stained with Tb3+ at 24, 50, 60, and 80 °C are shown in (D). Brightness was adjusted for all the images so that fluorescence distribution can be clearly seen. Line profiles of raw data (meaning the fluorescence images without the brightness adjustment) are shown in (E). Arrowheads indicate nucleoli. Arrows indicate nucleus regions. The nucleoplasm intensity was analyzed for 100 cells at each temperature and the results are shown in (F). Error bars indicate standard deviations. The excitation wavelength was 285 nm. The Tb3+ concentration, treatment period, and solution pH were adjusted to 50 mM, 5 min, and 7, respectively, unless noted. Scale bars in (A,B,D) and (C) correspond to 20 and 50 µm, respectively.
Figure 3
Figure 3
Dual-color fluorescence imaging of the cells stained with Tb3+ and Hoechst. (A) Representative fluorescence spectra of the cells stained with Hoechst + Tb3+. The excitation wavelength was 275 nm. (B,C) Representative images reconstructed with intensity at (B) λ = 470 nm (Hoechst) and (C) λ = 545 nm (Tb3+), as results of fluorescence hyperspectral imaging. (D,E) Wide-field imaging of the cells stained with Hoechst + Tb3+. The excitation wavelength was 285 nm. A zoom-in and large field-of-view images are shown in (D,E), respectively. Line profiles are shown in the inset of (D). G and B indicate green and blue channels of the color camera, respectively. The Tb3+ concentration, treatment period, and solution pH were adjusted to 50 mM, 5 min, and 7, respectively. Scale bars in (B–D) and (E) correspond to 50 and 200 µm, respectively. The concentration of Hoechst was 10 µg/ml.
Figure 4
Figure 4
Unsliced tissue imaging with a wide-field DUV-excitation fluorescence microscope. (A) An adult rat liver tissue stained with the D2O solution containing Tb3+ (50 mM) and Hoechst (20 µg/ml). The excitation wavelength, treatment period, and solution pH were adjusted to 285 nm, 3 min, and 7, respectively. The virtual H&E images generated from the fluorescence images shown in (A). (C) An H&E stain image of an adult rat liver. (D) For comparison, the fluorescence image measured with the conventional staining protocol using Hoechst 33342 and Rhodamine B is shown. The regions indicated in (AD) by dotted squares are magnified in (A-ID-I) respectively. (E) The virtual H&E image corresponding to (D-I). Scale bars correspond to 200 and 50 µm for the large field-of-view (AD) and magnified (A-I,B-I,C-I,D-I,E) images, respectively. For the fluorescence images shown in (A,D,A-I,D-I) unsharp masking was applied. The correspondent original images are shown in Fig. S2. The relatively large cells are hepatocytes, while the small cells seen in the fluorescence and virtual H&E images can be sinusoidal cells such as epithelial cells, Kupffer cells, and stellate cells.
Figure 5
Figure 5
Preclinical demonstration of DUV-excitation fluorescence microscopy with Tb3+ and Hoechst for intraoperative rapid diagnosis of lymph node metastasis. (A) A schematic view representing the protocol of intraoperative rapid diagnosis of a surgical specimen, drawn by Y.K. Because the lymph node is less contaminated by blood, the tissue is not rinsed before the ethanol treatment, unlike the staining protocol presented in Methods, so that the treatment time is shorten. F: fluorescence. (B) A cancer-metastasized lymph node stained with the D2O solution containing Tb3+ (50 mM) and Hoechst (20 µg/ml). The excitation wavelength, treatment period, and solution pH were adjusted to 285 nm, 3 min, and 7, respectively. The region indicated by the dotted square is magnified in (B-I). (C) The virtual H&E image corresponding to (B-I). (D) H&E image of the correspondent lymph node sample. Scale bars correspond to 200 and 50 µm for the large field-of-view (B) and magnified (B-I,C,D) images, respectively. For the images shown in (B,B-I) unsharp masking was applied. The correspondent original images are shown in Fig. S2. Arrows indicate boundaries between gland-like structures, which do not exist in non-metastasized lymph nodes, and normal lymph node structures, such as lymphocytes. Arrows indicate the nuclei where nucleoli are found as green-fluorescent particles.

References

    1. Klar TA, Jakobs S, Dyba M, Egner A, Hell SW. Fluorescence microscopy with diffraction resolution barrier broken by stimulated emission. Proc. Natl. Acad. Sci. USA. 2000;97:8206–8210. doi: 10.1073/pnas.97.15.8206. - DOI - PMC - PubMed
    1. Betzig E, et al. Imaging intracellular fluorescent proteins at nanometer resolution. Science. 2006;313:1642–1645. doi: 10.1126/science.1127344. - DOI - PubMed
    1. Fujita K, Kobayashi M, Kawano S, Yamanaka M, Kawata S. High-resolution confocal microscopy by saturated excitation of fluorescence. Phys. Rev. Lett. 2007;99:228105. doi: 10.1103/PhysRevLett.99.228105. - DOI - PubMed
    1. Denk W, Strickler JH, Webb WW. Two-photon laser scanning fluorescence microscopy. Science. 1990;248:73–76. doi: 10.1126/science.2321027. - DOI - PubMed
    1. Huisken J, Swoger J, Del Bene F, Wittbrodt J, Stelzer EH. Optical sectioning deep inside live embryos by selective plane illumination microscopy. Science. 2004;305:1007–1009. doi: 10.1126/science.1100035. - DOI - PubMed

Publication types