. 2019 Aug;572(7769):402-406.
doi: 10.1038/s41586-019-1426-6. Epub 2019 Jul 24.

Intercellular interaction dictates cancer cell ferroptosis via NF2-YAP signalling

Affiliations

Intercellular interaction dictates cancer cell ferroptosis via NF2-YAP signalling

Jiao Wu et al. Nature. 2019 Aug.

Erratum in

Abstract

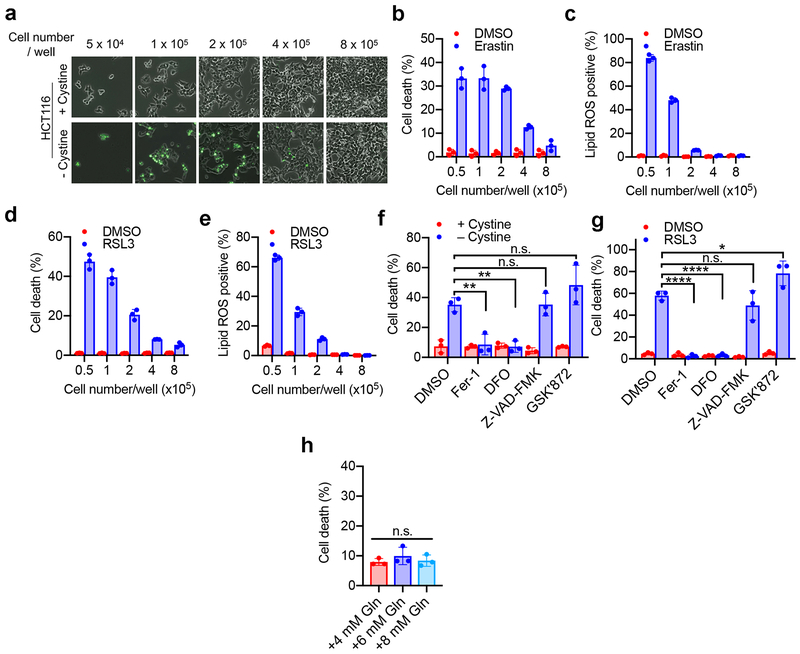
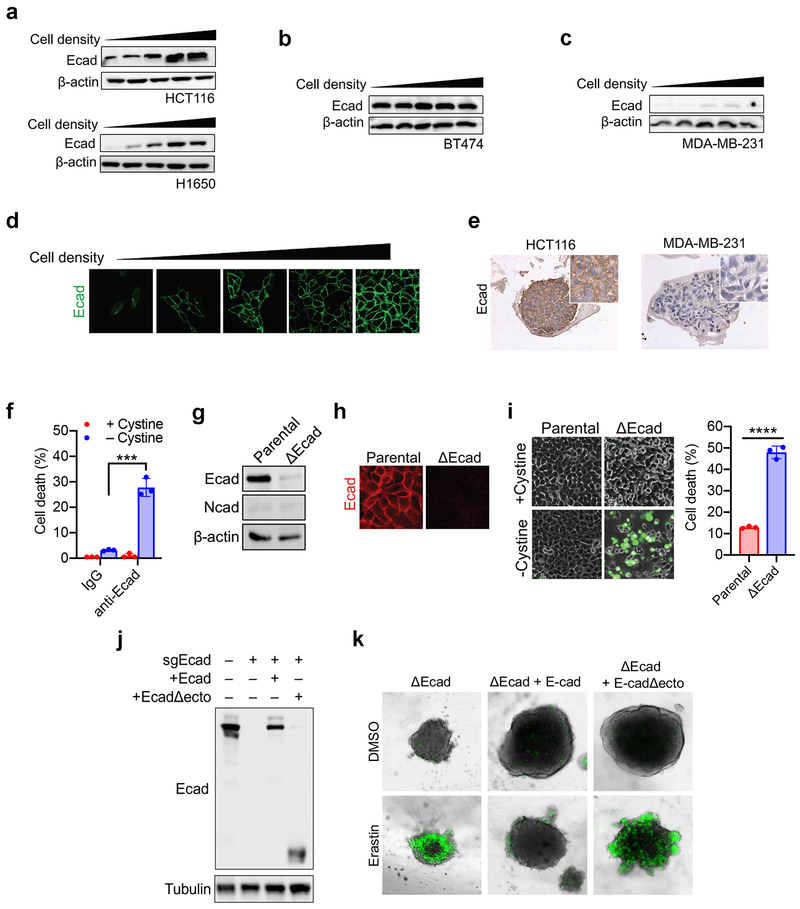
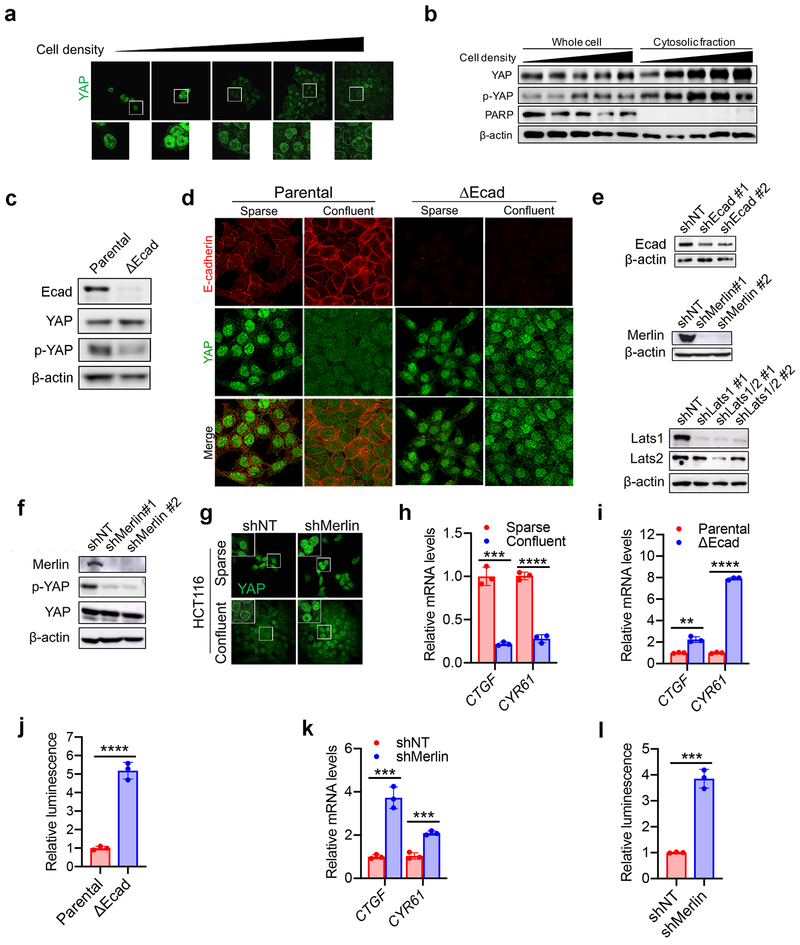
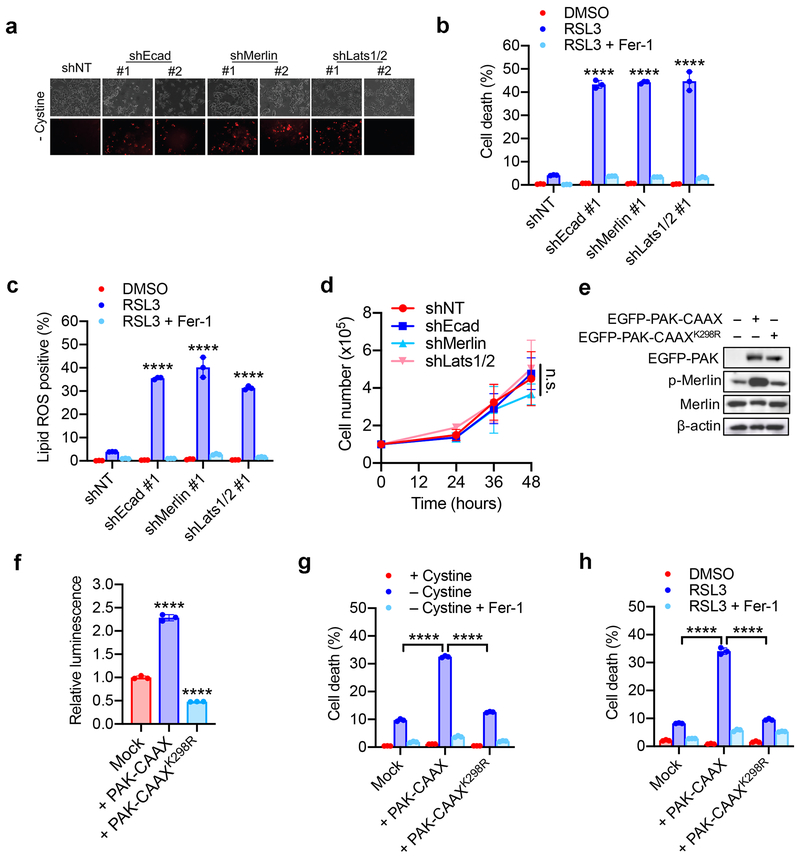
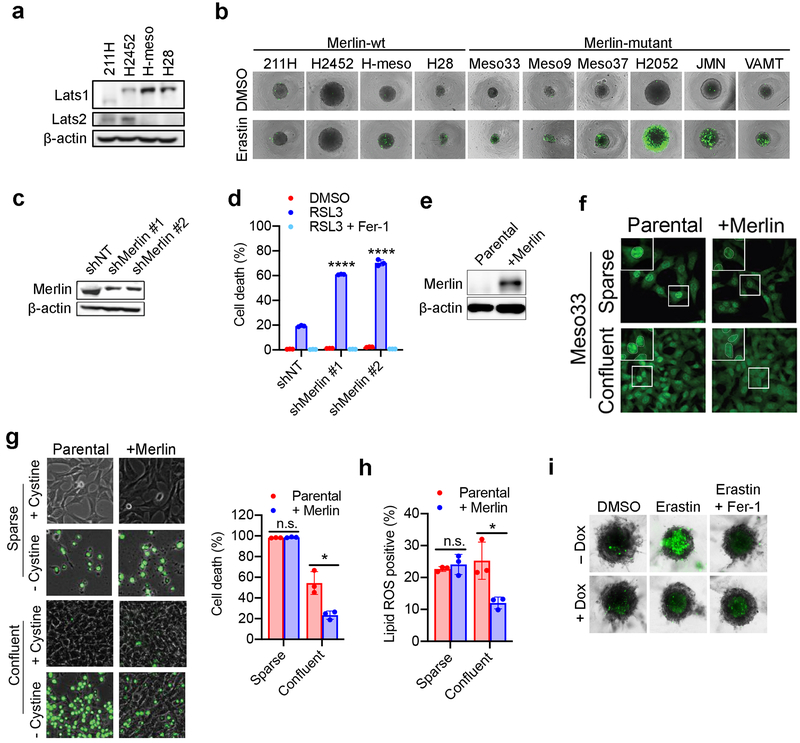
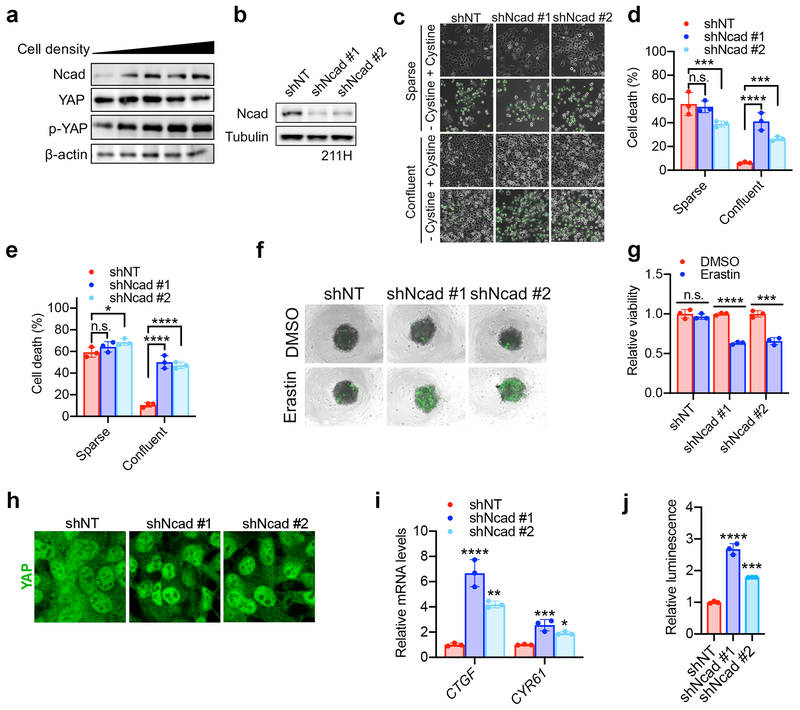
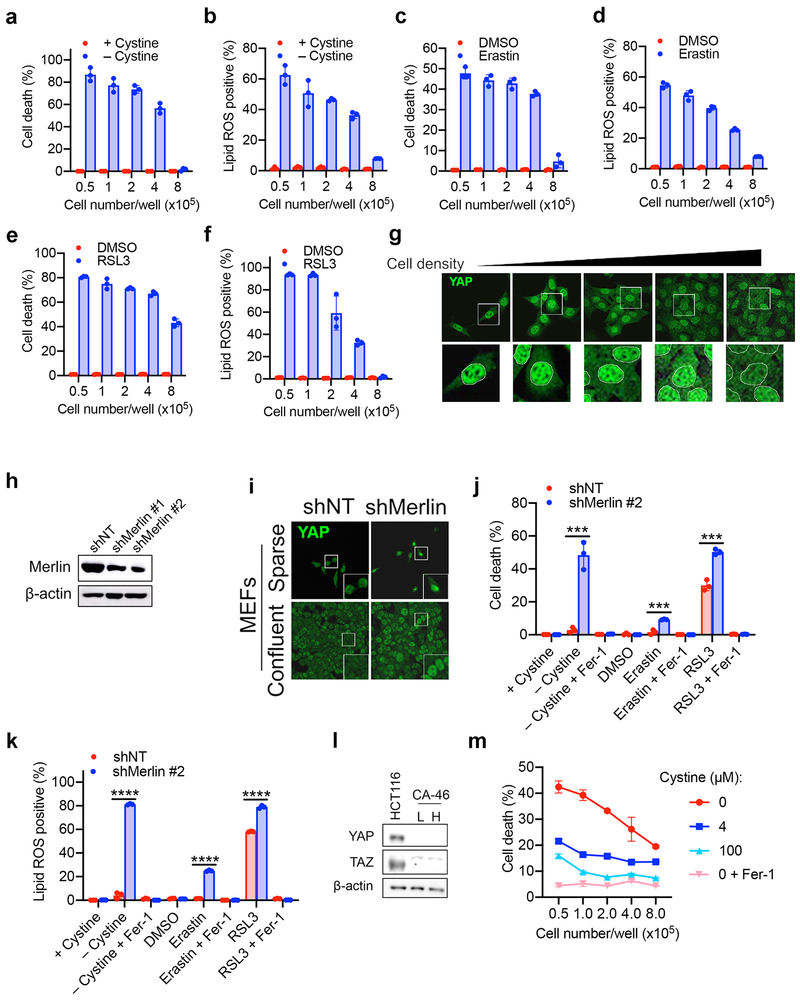
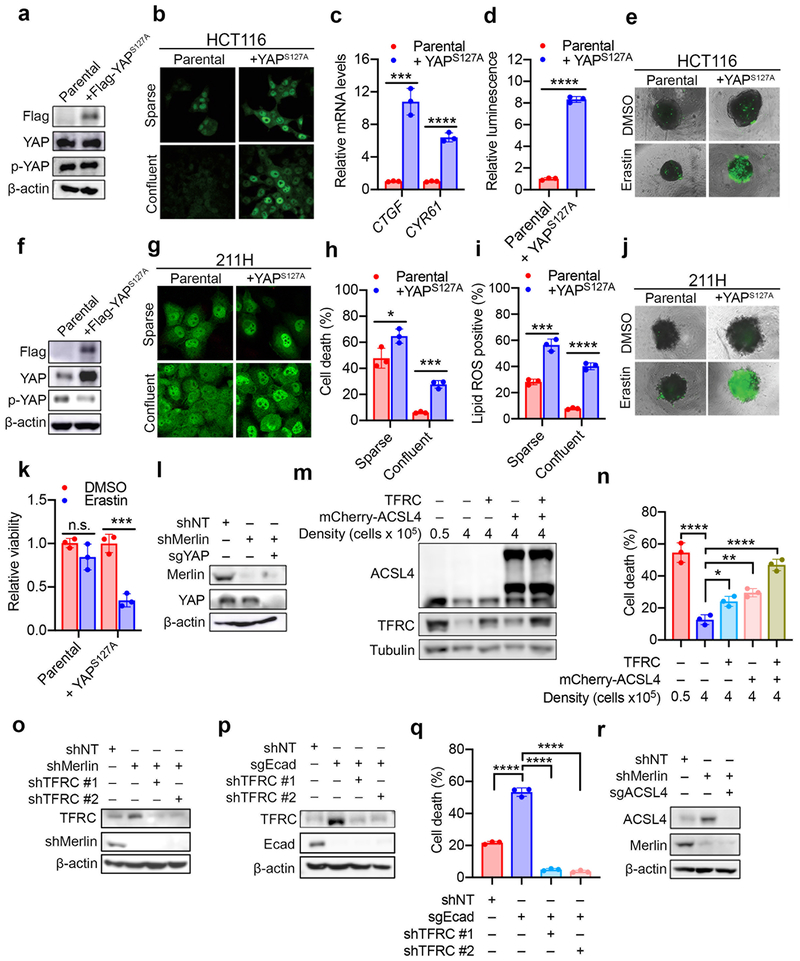
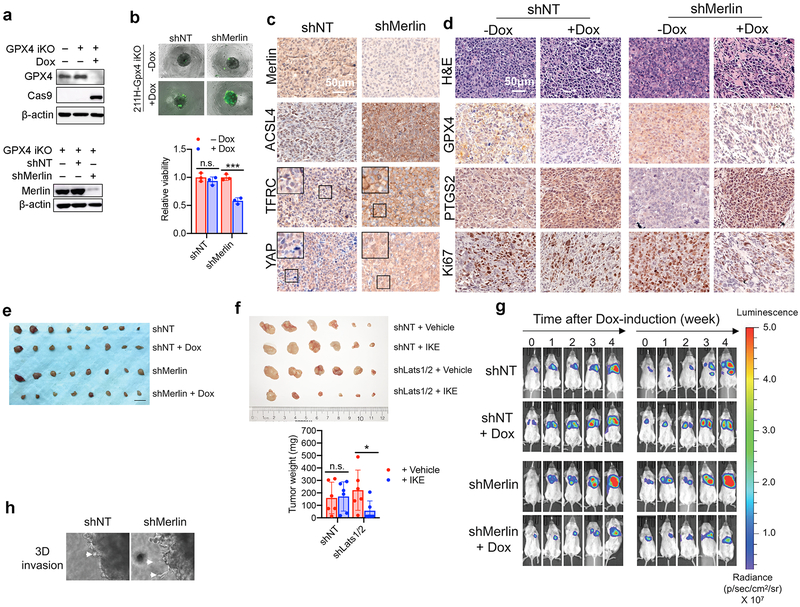
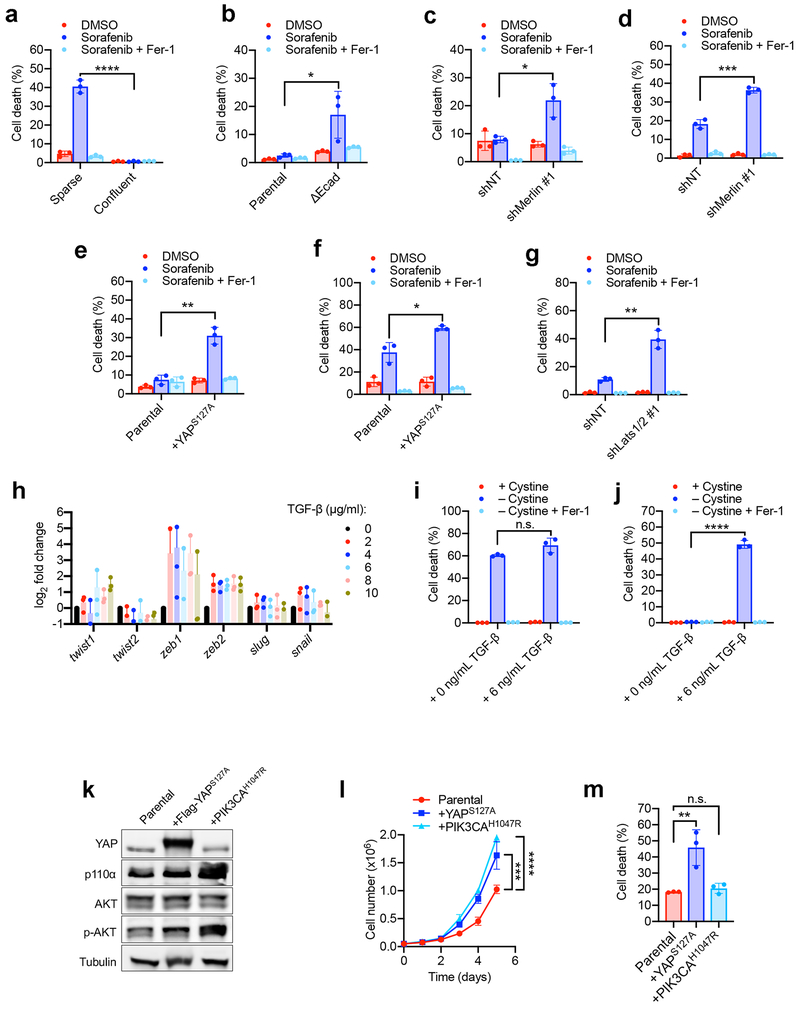
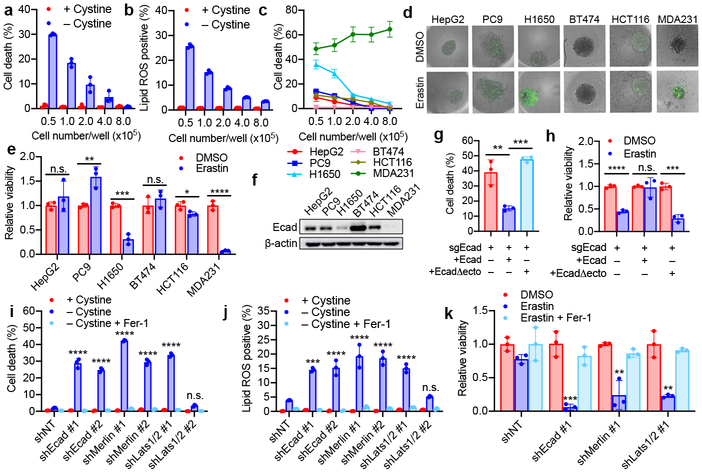
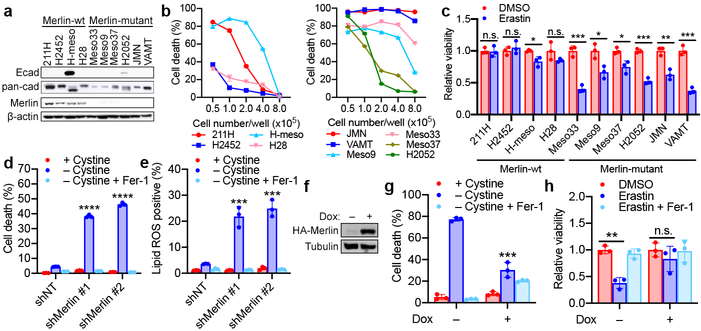
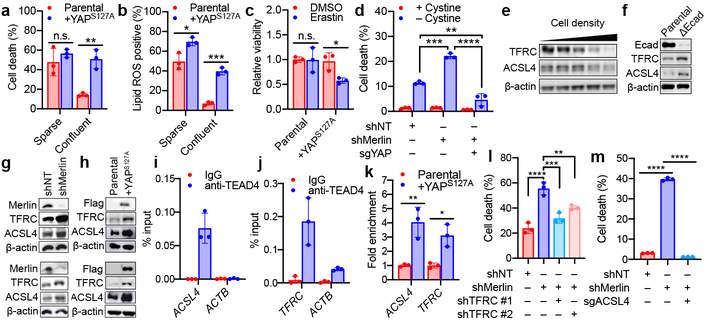
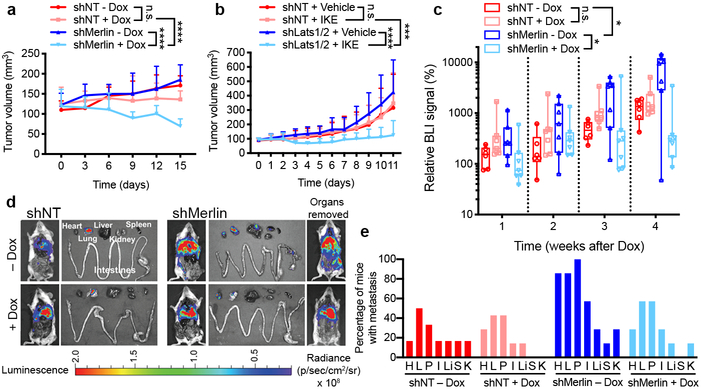
Ferroptosis, a cell death process driven by cellular metabolism and iron-dependent lipid peroxidation, has been implicated in diseases such as ischaemic organ damage and cancer1,2. The enzyme glutathione peroxidase 4 (GPX4) is a central regulator of ferroptosis, and protects cells by neutralizing lipid peroxides, which are by-products of cellular metabolism. The direct inhibition of GPX4, or indirect inhibition by depletion of its substrate glutathione or the building blocks of glutathione (such as cysteine), can trigger ferroptosis3. Ferroptosis contributes to the antitumour function of several tumour suppressors such as p53, BAP1 and fumarase4-7. Counterintuitively, mesenchymal cancer cells-which are prone to metastasis, and often resistant to various treatments-are highly susceptible to ferroptosis8,9. Here we show that ferroptosis can be regulated non-cell-autonomously by cadherin-mediated intercellular interactions. In epithelial cells, such interactions mediated by E-cadherin suppress ferroptosis by activating the intracellular NF2 (also known as merlin) and Hippo signalling pathway. Antagonizing this signalling axis allows the proto-oncogenic transcriptional co-activator YAP to promote ferroptosis by upregulating several ferroptosis modulators, including ACSL4 and TFRC. This finding provides mechanistic insights into the observations that cancer cells with mesenchymal or metastatic property are highly sensitive to ferroptosis8. Notably, a similar mechanism also modulates ferroptosis in some non-epithelial cells. Finally, genetic inactivation of the tumour suppressor NF2, a frequent tumorigenic event in mesothelioma10,11, rendered cancer cells more sensitive to ferroptosis in an orthotopic mouse model of malignant mesothelioma. Our results demonstrate the role of intercellular interactions and intracellular NF2-YAP signalling in dictating ferroptotic death, and also suggest that malignant mutations in NF2-YAP signalling could predict the responsiveness of cancer cells to future ferroptosis-inducing therapies.


Figures

Extended Data Figure 1.
Extended Data Figure 1.. Intercellular contact suppresses ferroptosis.
a. Cystine starvation-induced ferroptosis in HCT116 cells cultured with different cell density. HCT116 cells were seeded into 6-well plates at the indicated density. After 24 h, cells were treated with normal media or cystine-free media for 30 h and stained with SYTOX Green. Phase contrast and fluorescent images are overlayed. b. HCT116 cells with different cell density were treated with 30 μM erastin. Cell death was quantified by SYTOX Green staining followed by flow cytometry (after 30 h of erastin treatment). Data are plotted as mean ± s.d.; n = 3 biological replicates. c. Cells were treated as described in (b). Lipid ROS production was assessed by C11-BODIPY staining followed by flow cytometry (after 24 h of erastin treatment). Data are plotted as mean ± s.d.; n = 3 biological replicates. d. Cell death in HCT116 cells cultured with indicated cell density and treated with 5 μM RSL3 for 24 h. Data are plotted as mean ± s.d.; n = 3 biological replicates. e. Lipid ROS in HCT116 cells cultured with indicated cell density and treated with 5 μM RSL3 for 16 h. Data are plotted as mean ± s.d.; n = 3 biological replicates. f. HCT116 cells were seeded at a density of 5 × 10⁴ cells/well and grown for 24 hours. Cells were washed in PBS and cultured in cystine-free media with the indicated treatments for 30 h. Fer-1: Ferrostatin-1, 1 µM; DFO: iron chelator deferoxamine, 50 µg/ml; Z-VAD-FMK: pan-caspase inhibitor, 20 µM; GSK’872: RIPK3 inhibitor, 10 µM. Data are plotted as mean ± s.d.; n = 3 biological replicates. P-values were acquired by one-way ANOVA, n.s., p=0.9999, 0.1995 (from left to right in the figure), ** p=0.0070, 0.0050. g. HCT116 cells were seeded at a density of 5 × 10⁴ cells/well and grown for 24 hours. Cells were then treated with 5 µM RSL3 and the indicated inhibitors for 24 hours before measuring cell death. Inhibitor concentrations used as described in (f). Data are plotted as mean ± s.d.; n = 3 biological replicates. P-values were acquired by one-way ANOVA, n.s., p=0.4989, * p=0.0366, **** p<0.0001. h. HCT116 cells were seeded at a density of 8 × 10⁵ cells/well, grown for 24 hours, and treated with cystine-free media containing the indicated amounts of glutamine for 30 h. Cell death was measured by SYTOX Green staining coupled with flow cytometry. Data are plotted as mean ± s.d.; n = 3 biological replicates. P-value was acquired by one-way ANOVA, n.s., p=0.5156.
Extended Data Figure 2.
Extended Data Figure 2.. E-cadherin-mediated intercellular interaction regulates ferroptosis in a density-dependent manner.
a. Ecad expression increases with cell density in HCT116 (top) and H1650 (bottom) cells. b. BT474 cells express high Ecad regardless of cell density. c. MDA231 cells express low Ecad regardless of cell density. d. Immunofluorescence of Ecad at increasing cell density in HCT116 cells. e. Tumour spheroids generated from HCT116 or MDA231 cells were fixed, sectioned, and stained for Ecad expression by immunohistochemistry. f. HCT116 cells were treated with either α-IgG or α-Ecad antibody that blocks dimerisation. These cells were subjected to cystine starvation for 30 h. Cell death was measured by PI staining coupled with flow cytometry. Data are plotted as mean ± s.d.; n = 3 biological replicates. P-values were acquired by two-tailed t-test, *** p=0.0003. g. Expression of Ecad and Ncad in HCT116 cells following CRISPR-Cas9-mediated Ecad knockout (ΔEcad). h. Ecad knockout in HCT116 cells was further confirmed by immunofluorescence. i. Cell death measurement of ΔEcad and the parental cell line seeded at a density of 4 × 10⁵ cells/well after 30 h of cystine starvation. Data are plotted as mean ± s.d.; n = 3 biological replicates. P-values were acquired by two tailed t-test, **** p<0.0001. j. Western blot confirming reconstitution of Ecad or ectodomain-truncated Ecad (EcadΔecto) into ΔEcad HCT116 cells. k. ΔEcad cells or ΔEcad cells re-expressing full length Ecad or EcadΔecto were cultured into spheroids and treated with erastin for 30 h, followed by SYTOX Green staining to monitor cell death.
Extended Data Figure 3.
Extended Data Figure 3.. Cell density, E-cadherin, and Merlin converge on the transcriptional co-regulator YAP.
a. HCT116 cells were cultured at different cell density. YAP localisation was assessed by immunofluorescence. Images below are enlarged to show localisation. b. The levels of p-YAP (S127) and YAP in whole cell or cytosolic fractions of HCT116 cells cultured at different density were analysed by Western blot. PARP was used as a marker for nuclear protein. c. The levels of Ecad, YAP and p-YAP in parental and ΔEcad HCT116 cells were analysed by Western blot. d. Immunofluorescence of YAP (green) and Ecad (red) in parental and ΔEcad HCT116 cells. e. Western blots confirming knockdown efficiency of Ecad (shEcad), Merlin (shMerlin), or Lats1/2 (shLats1/2) in HCT116 cells. f. Expression levels of Merlin, p-YAP, YAP and β-actin in HCT116 shNT and shMerlin cells were analysed by Western blot. g. Knockdown of Merlin in HCT116 cells induced the nuclear accumulation of YAP in dense cell cultures, as assessed by immunofluorescence. h. HCT116 cells were seeded at 1 × 10⁵ (sparse) or 8 × 10⁵ (confluent) and grown for 24 hours. RNA was purified and mRNA of the canonical YAP targets, CTGF and CYR61, was measured by qPCR. Data are plotted as mean ± s.d.; n = 3 biological replicates. P-values were acquired by two-tailed t-test, *** p=0.0002, **** p<0.0001. i. Parental and ΔEcad HCT116 cells were plated at high density and transcription levels of CTGF and CYR61 were measured by qPCR. Data are plotted as mean ± s.d.; n = 3 biological replicates. P-values were acquired by two-tailed t-test, ** p=0.0013, **** p<0.0001. j. Luciferase assay for YAP/TEAD transcriptional activity in HCT116 and ΔEcad cells using the 8xGTIIC-luciferase reporter. Data are plotted as mean ± s.d.; n = 3 biological replicates. P-values were acquired by two-tailed t-test, **** p<0.0001. k. HCT116 cells harboring non-targeting hairpins or hairpins targeting Merlin were plated at high density and transcription levels of CTGF and CYR61 were measured by qPCR. Data are plotted as mean ± s.d.; n = 3 biological replicates. P-values were acquired by two-tailed t-test, *** p=0.0007, 0.0005. l. YAP/TEAD activity in HCT116 shNT and shMerlin cells was measured using the 8xGTIIC-luciferase reporter. Data are plotted as mean ± s.d.; n = 3 biological replicates. P-values were acquired by two-tailed t-test, *** p=0.0002.
Extended Data Figure 4.
Extended Data Figure 4.. The Hippo pathway links cell density and intercellular contact to ferroptosis.
a. Confluent cells were subjected to cystine starvation for 30 h. Dead cells were stained by PI. b. HCT116 cells expressing shNT, shEcad, shMerlin, or shLats1/2 as indicated were treated with 5 µM RSL3 with or without 2 µM Fer-1. Cell death was measured at 18 h. Data are plotted as mean ± s.d.; n = 3 biological replicates. P-values were acquired by one-way ANOVA, **** p<0.0001. c. Cells were treated as described in (b). Lipid ROS was assessed at 12 h after treatment. Data are plotted as mean ± s.d.; n = 3 biological replicates. P-values were acquired by one-way ANOVA, **** p<0.0001. d. Cumulative cell growth curve expressed as the total cell count of shEcad, shMerlin and shLats1/2 HCT116 cells. Data are plotted as mean ± s.d.; n = 3 biological replicates. P-value was acquired by two-way ANOVA, n.s., p=0.9497. e. HCT116 cells were transfected with EGFP-PAK containing a prenylation (CAAX) motif (thus constitutively active), or an inactive mutant form of PAK (K298R). Expression and phosphorylation of Merlin was assayed by Western blot. f. HCT116 cells expressing activated or inactive PAK were transfected with the 8xGTIIC-luciferase reporter, and YAP/TEAD activity was measured by luminescence. Data are plotted as mean ± s.d.; n = 3 biological replicates. P-values were acquired by one-way ANOVA, **** p<0.0001. g. HCT116 cells expressing activated or inactive PAK were plated at high density and treated with cystine-free media with or without 1 µM Ferrostatin-1 for 30 h. Data are plotted as mean ± s.d.; n = 3 biological replicates. P-values were acquired by one-way ANOVA, **** p<0.0001. h. Cells were prepared as described in (g) and treated with DMSO or 5 µM RSL3 with or without 1 µM Ferrostatin-1. Cell death was measured at 24 h. Data are plotted as mean ± s.d.; n = 3 biological replicates. P-values were acquired by one-way ANOVA, **** p<0.0001.
Extended Data Figure 5.
Extended Data Figure 5.. Merlin expression correlates with sensitivity to ferroptosis in mesothelioma cell lines.
a. Expression of Lats1/2 was tested in the indicated mesothelioma cell lines by Western blot. b. Spheroids were treated with 10 μM erastin for 24 h before SYTOX Green staining. c. Western blot confirming knockdown efficiency of Merlin in MSTO-211H cells. d. Confluent MSTO-211H cells expressing shNT or shMerlin as indicated were treated with 1 µM RSL3, with or without 2 µM Fer-1. Cell death (left, 24 h after treatment) and lipid ROS production (right, 16 h) were measured. Data are plotted as mean ± s.d.; n = 3 biological replicates. P-values were acquired by one-way ANOVA, **** p<0.0001. e. Merlin-mutant Meso33 cells were reconstituted with wild type Merlin. Expression of Merlin was confirmed by Western blot. f. Localisation of YAP (green) under sparse or confluent conditions in Meso33 cells expressing wild type Merlin was determined by immunofluorescence. g. Meso33 cells expressing wild type Merlin were cultured under sparse or confluent conditions and stimulated with cystine-free media. Cell death was measured by SYTOX Green staining coupled with flow cytometry after 24 h of treatment. Data are plotted as mean ± s.d.; n = 3 biological replicates. P-values were acquired by two-tailed t-test, n.s., p=0.1874, * p=0.0104. h. Meso33 cells expressing wild type Merlin were cultured as described in (g). Lipid ROS was measured after 16 h of cystine starvation. Data are plotted as mean ± s.d.; n = 3 biological replicates. P-values were acquired by two-tailed t-test, n.s., p=0.4860, * p=0.0201. i. Meso33 spheroids harbouring Dox-inducible Merlin expression were grown in the presence or absence of Dox for 72 h, at which point 10 µM erastin was added. After 24 h, spheroids were stained with SYTOX Green for cell death.
Extended Data Figure 6.
Extended Data Figure 6.. N-cadherin suppresses ferroptosis in MSTO-211H cells in a density-dependent manner.
a. 211H cells were cultured at different cell density, and the levels of Ncad, p-YAP and total YAP were analysed by Western blot b. 211H cells were infected with lentiviruses expressing Ncad shRNA (shNcad). Knockdown efficiency of Ncad was confirmed by Western blot. c. shNT or shNcad 211H cells, cultured sparse or confluent as indicated, were subjected to cystine starvation for 24 h, at which point cell death was monitored by SYTOX Green staining. d. Flow cytometric quantification of cell death in (c). Data are plotted as mean ± s.d.; n = 3 biological replicates. P-values were acquired by one-way ANOVA, n.s., p=0.8426, *** p=0.0056, 0.0015, **** p<0.0001. e. shNT or shNcad 211H cells, cultured sparse or confluent as indicated, were treated with 1 µM RSL3 for 16 h, at which point cell death was measured by SYTOX Green staining followed by flow cytometry. Data are plotted as mean ± s.d.; n = 3 biological replicates. P-values were acquired by one-way ANOVA, n.s., p=0.3012, * p=0.0315, **** p<0.0001. f. Spheroids generated from shNT and shNcad 211H cells were treated with 10 μM erastin for 24 h. Cell death within the spheroids was determined by SYTOX Green staining. g. Cell viability of spheroids described in (f) was assayed by measuring cellular ATP levels. Data are plotted as mean ± s.d.; n = 3 biological replicates. P-values were acquired by two-tailed t-test, n.s., p=0.4365, *** p=0.0006, **** p<0.0001. h. shNT or shNcad 211H cells were plated at high density and YAP localisation was assessed by immunofluorescence. i. shNT or shNcad MSTO-211H cells were plated at high density and transcription levels of CTGF and CYR61 were measured by qPCR. Data are plotted as mean ± s.d.; n = 3 biological replicates. P-values were acquired by one-way ANOVA, * p=0.0108, ** p=0.0016, *** p=0.0007, p=**** p<0.0001. j. Luciferase assay for YAP/TEAD activity in shNT or shNcad 211H cells was measured by 8xGTIIC-luciferase reporter assay. Data are plotted as mean ± s.d.; n = 3 biological replicates. P-values were acquired by one-way ANOVA, *** p=0.0002, **** p<0.0001.
Extended Data Figure 7.
Extended Data Figure 7.. Ferroptosis can be regulated by the Hippo pathway in non-epithelial cells.
a. Mouse embryonic fibroblasts (MEFs) were cultured at the indicated density and treated with normal media or cystine free media. Cell death was measured at 12 h. Data are plotted as mean ± s.d.; n = 3 biological replicates. b. Cells were treated as described in (a) and lipid ROS was measured at 8 h. c. MEFs treated with 1 µM erastin at the indicated densities were measured for cell death at 12 h. d. Cells were treated as described in (c) and lipid ROS was measured at 8 h. e. MEFs treated with 1 µM RSL3 at the indicated densities were measured for cell death at 8 h. f. Cells were treated as described in (e) and lipid ROS was measured at 5 h. g. Immunofluorescence probing for YAP localisation in MEFs seeded at increasing density. Images below are enlarged to show localisation. h. Hairpins targeting Merlin were infected into MEFs, and knockdown efficiency was assessed by Western blot. i. Immunofluorescence testing YAP localisation following Merlin knockdown in MEFs. j. RNAi depletion of Merlin in confluent MEFs led to increased cell death upon cystine starvation, erastin (1 µM, 12 h) or RSL3 (1 µM, 8 h) treatment, which was blocked by Ferrostatin-1 (2 µM). Data are plotted as mean ± s.d.; n = 3 biological replicates. P-values were acquired by two-tailed t-test, *** p=0.0007, 0.0007, 0.0006. k. Cells were treated as described in (j) and lipid ROS was assessed at 8 h (cystine starvation, erastin) or 5 h (RSL3). Data are plotted as mean ± s.d.; n = 3 biological replicates. P-values were acquired by two-tailed t-test, **** p<0.0001. l. Western blot probing for YAP and TAZ in CA-46 Burkitt lymphoma cells. m. Cell death measurement of CA-46 cells treated as indicated after 24 h.
Extended Data Figure 8.
Extended Data Figure 8.. YAP regulates ferroptosis.
a. Western blot confirming expression of YAPS127A in HCT116 cells. b. YAP localisation in HCT116 cells expressing YAPS127A was assessed by immunofluorescence. c. Transcriptional levels of CTGF and CYR61 were measured by qPCR in HCT116 cells expressing YAPS127A. Data are plotted as mean ± s.d.; n = 3 biological replicates. P-values were acquired by two-tailed t-test, *** p=0.0005, **** p<0.0001. d. YAP/TEAD activity in HCT116 cells expressing YAPS127A was measured by 8xGTIIC-luciferase reporter assay. Data are plotted as mean ± s.d.; n = 3 biological replicates. P-value was acquired by two-tailed t-test, **** p<0.0001. e. Spheroids generated from parental HCT116 cells and YAPS127A-overexpressing cells were treated with 15 μM erastin for 30 h, followed by SYTOX Green staining. f. 211H cells were infected with retroviral vectors encoding the Flag-YAPS127A mutant. Levels of Flag-YAP, YAP, and p-YAP were analysed by Western blot. g. Localisation of YAP (green) was determined by immunofluorescence in 211H cells expressing constitutively active YAP. h. Parental and YAPS127A-overexpressing 211H cells were cultured under sparse or confluent conditions and cell death was induced by cystine starvation. Cell death was measured after 24 h of treatment. Data are plotted as mean ± s.d.; n = 3 biological replicates. P-values were acquired by two-tailed t-test, * p=0.0354, *** p=0.0003. i. Cells were cultured as described in (h) and lipid ROS was measured after 16 h of cystine starvation. Data are plotted as mean ± s.d.; n = 3 biological replicates. P-values were acquired by two-tailed t-test, *** p=0.0006, **** p<0.0001. j. Spheroids generated from parental 211H cells and YAPS127A-overexpression cells were treated with 10 μM erastin for 24 h. Cell death was measured by SYTOX staining. k. Cells were cultured as described in (j) and cell viability within spheroids was measured by cellular ATP levels. Data are plotted as mean ± s.d.; n = 3 biological replicates. P-values were acquired by two-tailed t-test, n.s., p=0.1534, *** p=0.0009. l. YAP was knocked out by CRISPR-Cas9 in shMerlin HCT116 cells. m. HCT116 cells were transduced with retroviral particles containing mCherry-ACSL4, transfected with TFRC, or both. Expression was assayed by Western blot. Two bands were detected for mCherry-ACSL4, representing the full-length mCherry-ACSL4 and that with mCherry tag truncated. n. HCT116 cells treated as described in (m) were plated at the indicated density and treated with 2 µM RSL3 for 24 h. Cell death was measured by SYTOX Green staining coupled with flow cytometry. Data are plotted as mean ± s.d.; n = 3 biological replicates. P-values were acquired by one-way ANOVA, * p=0.0158, ** p=0.0012, **** p<0.0001. o. Western blot confirming knockdown of TFRC in HCT116 shMerlin cells. p. Western blot confirming knockdown of TFRC in HCT116 ΔEcad cells. q. Cells described in panel p were treated with media containing or lacking cystine for 30 h. Cell death was measured by SYTOX Green staining. Data are plotted as mean ± s.d.; n = 3 biological replicates. P-values were acquired by one-way ANOVA, **** p<0.0001. r. Western blot of HCT116 cells with CRISPR-Cas9-mediated ACSL4 knockout and shMerlin.
Extended Data Figure 9.
Extended Data Figure 9.. Merlin and Lats1/2 regulate cancer cell sensitivity to ferroptosis in vivo.
a. Western blot confirming knockout of GPX4 in 211H cells following treatment with 1 µg/ml Dox for 5 days (top). These cells were then infected with the indicated hairpins (bottom). b. Spheroids formed by shNT-GPX4-iKO or shMerlin-GPX4-iKO 211H cells were treated with or without Dox for 5 days. Cell death and cell viability within the spheroids were determined by SYTOX staining (top) and cellular ATP measurement (bottom). Data are plotted as mean ± s.d.; n = 3 biological replicates. P-values were acquired by two-tailed t-test, n.s., p=0.3523, *** p=0.0007. c. shNT-GPX4-iKO cells and shMerlin-GPX4-iKO cells were subcutaneously injected into nude mice. The effect of Merlin knockdown on xenografted tumours was validated by immunohistochemical (IHC) staining of Merlin, ACSL4, TFRC, and YAP, all counter-stained with haematoxylin (blue), on sections of tumours bearing shNT and shMerlin as indicated. Inset images are enlarged to show TFRC expression at plasma membranes and increase in nuclear localisation of YAP. d. shNT-GPX4-iKO cells and shMerlin-GPX4-iKO cells were subcutaneously injected into nude mice and fed with Dox diet or normal diet (n = 8 per group). Representative images of haematoxylin and eosin (H&E) staining and IHC staining for GPX4, PTGS2, and Ki67, all counter-stained with haematoxylin (blue), were taken from sections of xenografted tumours, bearing shNT or shMerlin and with or without Dox diet (to induce GPX4 knockout) as indicated. e. Images of resected MSTO-211H subcutaneous tumours (scale bar = 1 cm). f. HCT116 shNT or shLats1/2 cells were injected subcutaneously and treated wih or without IKE. Tumors were resected and weighed. Top, images of resected HCT116 shNT or shLats1/2 tumors. Bottom, mass of resected tumors. Data are plotted as mean ± s.d.; n =6 mice per group. P-values were acquired by two-tailed t-test, n.s., p=0.8677, * p=0.0486. g. Representative bioluminescent imaging (BLI) showing the tumour growth of indicated cells in an orthotopic model of mesothelioma in NOD/SCID mice. Dox treatment started when average total flux reached 108 photons per second (time-point 0). h. Tumour spheroids of 211H cells expressing shNT or shMerlin were grown in Matrigel, and invasion was monitored. In the representative images, arrows show protrusions extruded from the main body of spheroids.
Extended Data Figure 10.
Extended Data Figure 10.. The Hippo pathway as a potential biomarker for predicting cancer cell sensitivity to ferroptosis.
a. HCT116 cells were seeded at a density of 0.5 × 10⁵ cells/3.5 cm2 well (sparse) or 4 × 10⁵ cells/3.5 cm2 well (confluent) and grown for 24 h. Cells were then treated with DMSO, 10 µM sorafenib, or 10 µM sorafenib and 2 µM Fer-1 as indicated. Data are plotted as mean ± s.d.; n = 3 biological replicates. P-value was acquired by two-tailed t-test, **** p<0.0001. b. ΔEcad or the parental HCT116 cells were seeded at 4 × 10⁵ cells/3.5 cm2 well and grown for 24 h. Cells were then treated with 10 µM sorafenib and 2 µM Fer-1 as indicated. Data are plotted as mean ± s.d.; n = 3 biological replicates. P-value was acquired by two-tailed t-test, * p=0.0394. c. HCT116 shNT or shMerlin cells were seeded at high density and treated with 10 µM sorafenib and 2 µM Fer-1 as indicated. Data are plotted as mean ± s.d.; n = 3 biological replicates. P-value was acquired by two-tailed t-test, * p=0.0167. d. 211H shNT or shMerlin cells were seeded at high density and treated with 10 µM sorafenib and 2 µM Fer-1 as indicated. Data are plotted as mean ± s.d.; n = 3 biological replicates. P-value was acquired by two-tailed t-test, *** p=0.0004. e. HCT116 cells expressing YAPS127A or the parental cells were seeded at high density and treated with 10 µM sorafenib and 2 µM Fer-1 as indicated. Data are plotted as mean ± s.d.; n = 3 biological replicates. P-value was acquired by two-tailed t-test, ** p=0.0014. f. 211H cells expressing YAPS127A or the parental cells were seeded at high density and treated with 10 µM sorafenib and 2 µM Fer-1 as indicated. Data are plotted as mean ± s.d.; n = 3 biological replicates. P-value was acquired by two-tailed t-test, * p=0.0143. g. HCT116 shNT or shLats1/2 cells were seeded at high density and treated with 10 µM sorafenib and 2 µM Fer-1 as indicated. Data are plotted as mean ± s.d.; n = 3 biological replicates. P-value was acquired by two-tailed t-test, ** p=0.0017. h. NF639 cells, derived from mouse mammary tumours containing MMTV-neu, were treated with various concentrations of TGF-β for 48 h. Expression of a panel of EMT-related genes was assayed by qPCR as indicated. Data are plotted as mean ± s.d.; n = 3 biological replicates. i. NF639 cells were treated with or without 6 ng/µL TGF-β for 48 h, at which point they were plated at low density (0.8 cells x 105/3.5 cm2 well), grown overnight, and treated with media containing or lacking cystine, or lacking cystine with 1 µM ferrostatin-1 for 12 h. Cell death was measured by SYTOX green staining coupled with flow cytometry. Data are plotted as mean ± s.d.; n = 3 biological replicates. P-value was acquired by two-tailed t-test, n.s., p = 0.0777. j. NF639 cells were plated at a high density of 3.2 × 10⁵ cells/3.5 cm2 well, grown overnight, and treated as described in (b). Data are plotted as mean ± s.d.; n = 3 biological replicates. P-value was acquired by two-tailed t-test; **** p<0.0001. k. 211H cells were infected with YAPS127A or the activated mutant PIK3CAH1047R. Lysates were probed for overexpression and phosphorylated AKT (S473) to confirm the activity of PIK3CAH1047R. l. 50,000 cells were seeded in 3.5 cm2 plates and grown for a total of 5 days. Cells were counted daily. Data are plotted as mean ± s.d.; n = 3 biological replicates. P-values were acquired by two-way ANOVA, *** p=0.0007, **** p<0.0001. m. Cells were seeded at high density (8 × 10⁵ cells / 3.5 cm2 well) and treated with cystine starvation media for 24 hours before cell death analysis by flow cytometry. Data are plotted as mean ± s.d.; n = 3 biological replicates. P-values were acquired by one-way ANOVA, n.s., p=0.8838, ** p=0.0041.
Figure 1.
Figure 1.. E-cadherin and the Hippo pathway regulate ferroptosis in a cell density-dependent manner.
a-b, HCT116 cells were seeded with indicated density in 6-well plates and cultured for 24 h. (a) Ferroptosis was measured after cystine starvation for 30 h, by SYTOX Green staining followed by flow cytometry. (b) Lipid ROS was quantified after 24 h of cystine starvation (C11-BODIPY staining followed by flow cytometry). Data plot: mean ± s.d.; n = 3 biological replicates (same in later panels). c, 6 cell lines were seeded as indicated and treated with cystine starvation for 30 h for ferroptosis measurement. d-e, Spheroids generated from indicated cell lines were cultured for 72 h and treated with 15 μM erastin for 30 h. SYTOX Green stained dead cells (d); ATP assay measured viability (e). P-values (two tailed t-test): n.s. p=0.3757 and 0.3572 (from left to right), * p = 0.0323, ** p = 0.0086, *** p = 0.0004, **** p < 0.0001. f, Western blot of Ecad in indicated cell lines. Image represents three experiments; see Supplementary Fig. 1 for raw image (same for all other blots). g, Cystine starvation-induced ferroptosis in ΔEcad HCT116 cells and ΔEcad cells expressing full-length or ectodomain-truncated (Δecto) Ecad. P-values (one-way ANOVA): ** p=0.0025, *** p=0.0005. h, Viability of spheroids generated from indicated cells with erastin measurement. P-values (two-tailed t-test): n.s., p=0.8683, *** p=0.0004, **** p<0.0001. i, ferroptosis of HCT116 cells with indicated treatment. Fer-1, 2 µM ferrostatin-1. P-values (one-way ANOVA): n.s., p=0.6880, **** p<0.0001. Note shLats1/2#2 did not knockdown Lats2 (Extended Data Fig. 3e) and thus failed to sensitise ferroptosis. j, Lipid ROS measurement of cells as in (i). P-values (one-way ANOVA): n.s., p=0.9383, *** p=0.0001, **** p<0.0001. k, Viability of spheroids generated from HCT116 cells with indicated treatment. P-values (one-way ANOVA): ** p=0.0012, 0.0010, *** p=0.0002.
Figure 2.
Figure 2.. Merlin mediates cell density-dependent inhibition of ferroptosis in mesothelioma cells.
a, Western blot assessing Ecad, pan-cadherin, and Merlin expression in a panel of mesothelioma cell lines cultured at high confluence. b, Merlin-wt (left) or Merlin-mutant (right) mesothelioma cells were seeded at the indicated densities. Cell death was measured after 24 h of cystine starvation. Data are plotted as mean ± s.d.; n = 3 biological replicates. c, Spheroids grown from the indicated cell lines were treated with 10 μM erastin for 24 h before viability measurement. Data are plotted as mean ± s.d.; n = 3 biological replicates. P-values were acquired by two-tailed t-test, n.s. p=0.8860, 0.4981, 0.1474, * p=0.0203, 0.0180, 0.0162, ** p=0.0033, *** p=0.0005, 0.0001, 0.0003. d, Confluent cells were treated with media lacking cystine with or without Fer-1 for 24 h. Data are plotted as mean ± s.d.; n = 3 biological replicates. P-values were acquired by one-way ANOVA, **** p<0.0001. e, Lipid ROS measurement after 18 h of treatment. Data are plotted as mean ± s.d.; n = 3 biological replicates. P-values were acquired by one-way ANOVA, *** p=0.0005, 0.0002. f, Western blot confirming expression of Merlin in Meso33 cells containing Dox-inducible Merlin following 48 h of treatment with 1 µg/ml Dox. g, Cells in the presence or absence of Dox were treated with cystine starvation for 12 h. Data are plotted as mean ± s.d.; n = 3 biological replicates. P-values were acquired by two-tailed t-test, *** p=0.0003. h, Spheroids were grown in the presence or absence of Dox for 72 h, at which point 10 µM erastin was added. After 24 h, viability was measured. Data are plotted as mean ± s.d.; n = 3 biological replicates. P-values were acquired by two-tailed t-test, n.s., p=0.3393, ** p=0.0010.
Fig. 3.
Fig. 3.. The transcriptional regulatory activity of YAP promotes ferroptosis.
a, Cells were cultured as indicated. Cell death was measured after 24 h of cystine starvation. Data plot: mean ± s.d.; n = 3 biological replicates (same for other panels). P-values (two-tailed t-test): n.s., p=0.3525, ** p=0.0031. b, Lipid ROS was measured after 16 h of cystine starvation. P-values (two-tailed t-test): * p=0.0202, *** p=0.0001. c, Spheroids generated from parental HCT116 cells and YAPS127A-overexpressing cells were treated as indicated for viability measurement. P-values (two-tailed t-test): n.s., p=0.9571, * p=0.0200. d, Ferroptosis of indicated cells. P-values (one-way ANOVA): ** p=0.0043, *** p=0.0004, **** p<0.0001. e, 211H cells were seeded at increasing density and expression of TFRC and ACSL4 were assessed. f, TFRC and ACSL4 in parental and ΔEcad HCT116 cells. g, TFRC and ACSL4 in shNT/shMerlin HCT116 (top) or 211H (bottom) cells. h, TFRC and ACSL4 in HCT116 (top) and 211H (bottom) cells expressing YAPS127A. i, TEAD4 binding to the ACSL4 promoter in 211H cells was assessed by ChIP analysis using control immunoglobulin G (IgG) and an anti-TEAD4 antibody. Values are percent of input. qPCR primers were designed based on TEAD4 binding peak regions depicted in the ENCODE TEAD4 ChIP-seq datasets. j, TEAD4 binding to the promoter region of TFRC was analysed as described in (i). k, ChIP monitoring the occupancy of TEAD4 on ACSL4 and TFRC promoters in parental or YAPS127A-overexpressing 211H cells. The enrichment was calculated based upon qPCR relative to the IgG control. P-values (two-tailed t-test): * p=0.0103, ** p=0.0079. l, Cell death measurement in cells treated with cystine starvation and indicated shRNAs. P-values (one-way ANOVA): ** p=0.0072, *** p=0.0004, **** p<0.0001. m, Cell death measurement in cells treated with cystine starvation, and indicated shRNA and/or sgRNA, for 30 h. P-values (one-way ANOVA): **** p<0.0001.
Fig. 4.
Fig. 4.. Merlin dictates GPX4 dependency in murine models of mesothelioma.
a, Growth curves of tumours derived from GPX4iKO-shNT or GPX4iKO-shMerlin 211H cells injected subcutaneously into nude mice fed with doxycycline diet or normal diet (n = 8 per group). Data are plotted as mean ± s.d.; P-values were acquired by two-way ANOVA, n.s., p=0.6776 **** p<0.0001. b, The indicated HCT116 cells were injected subcutaneously into nude mice (n = 6 per group). Tumours were grown to a volume of 90 mm3, at which point 50 mg/kg imidazole ketone erastin (IKE) was administered intraperitoneally daily for 12 days. Data are plotted as mean ± s.d.; P-values were acquired by two-way ANOVA, n.s., p=0.9808, *** p=0.0001, **** p<0.0001. For knockdown efficiency of Lats1/2, see Extended Data Fig. 3e. c, GPX4iKO-shNT or GPX4iKO-shMerlin 211H were orthotopically injected into the pleural cavity of mice. Relative BLI signal (photons per second) percentage change versus time-point 0; n = 6 (shNT-Dox) or 7 mice for each group. Data are plotted as box and whisker plots, with a line at the median value. Boxes represent the interquartile range, and whiskers represent the range of values. P-values were acquired by two-way ANOVA, n.s., p=0.1545, * p=0.0237, 0.0287. d, Bioluminescence imaging in excised organs, and in mouse bodies before and after organs were removed. e, Percentage of mice in each group with metastases in excised organs. shNT-Dox: n=6; shNT+Dox, shMerlin-Dox, shMerlin-Dox: n=7. H, heart. L, lung. P, peritoneum. I, intestines/mesenteric lymph nodes. Li, liver. S, spleen. K, kidneys.

Comment in

  • Cancer-cell death ironed out.
    Fennell D. Fennell D. Nature. 2019 Aug;572(7769):314-315. doi: 10.1038/d41586-019-02218-y. Nature. 2019. PMID: 31406306 No abstract available.

References

    1. Stockwell BR et al. Ferroptosis: A Regulated Cell Death Nexus Linking Metabolism, Redox Biology, and Disease. Cell 171, 273–285, doi:10.1016/j.cell.2017.09.021 (2017). - DOI - PMC - PubMed
    1. Gao M & Jiang X To eat or not to eat-the metabolic flavor of ferroptosis. Curr Opin Cell Biol 51, 58–64, doi:10.1016/j.ceb.2017.11.001 (2018). - DOI - PMC - PubMed
    1. Yang WS et al. Regulation of ferroptotic cancer cell death by GPX4. Cell 156, 317–331, doi:10.1016/j.cell.2013.12.010 (2014). - DOI - PMC - PubMed
    1. Gao M et al. Role of Mitochondria in Ferroptosis. Mol Cell 73, 354–363 e353, doi:10.1016/j.molcel.2018.10.042 (2019). - DOI - PMC - PubMed
    1. Jiang L et al. Ferroptosis as a p53-mediated activity during tumour suppression. Nature 520, 57–62, doi:10.1038/nature14344 (2015). - DOI - PMC - PubMed

Publication types

MeSH terms