. 2019 Aug;572(7767):120-124.
doi: 10.1038/s41586-019-1414-x. Epub 2019 Jul 24.

Single-cell analysis of cardiogenesis reveals basis for organ-level developmental defects

Affiliations

Single-cell analysis of cardiogenesis reveals basis for organ-level developmental defects

T Yvanka de Soysa et al. Nature. 2019 Aug.

Abstract

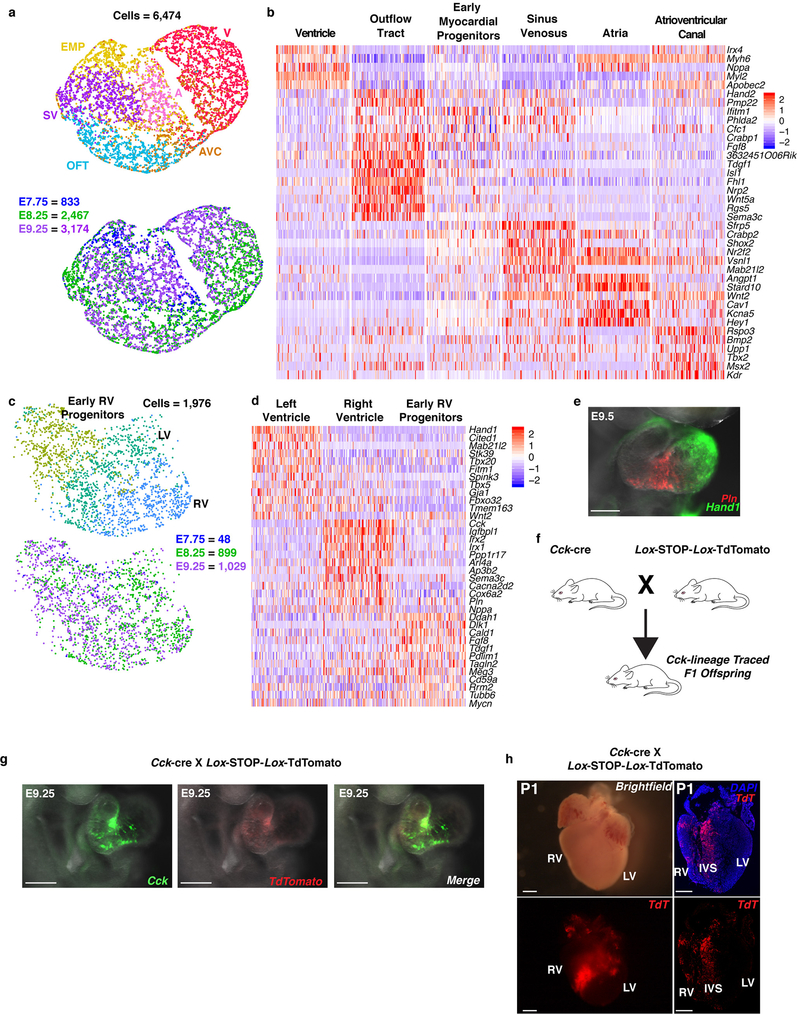
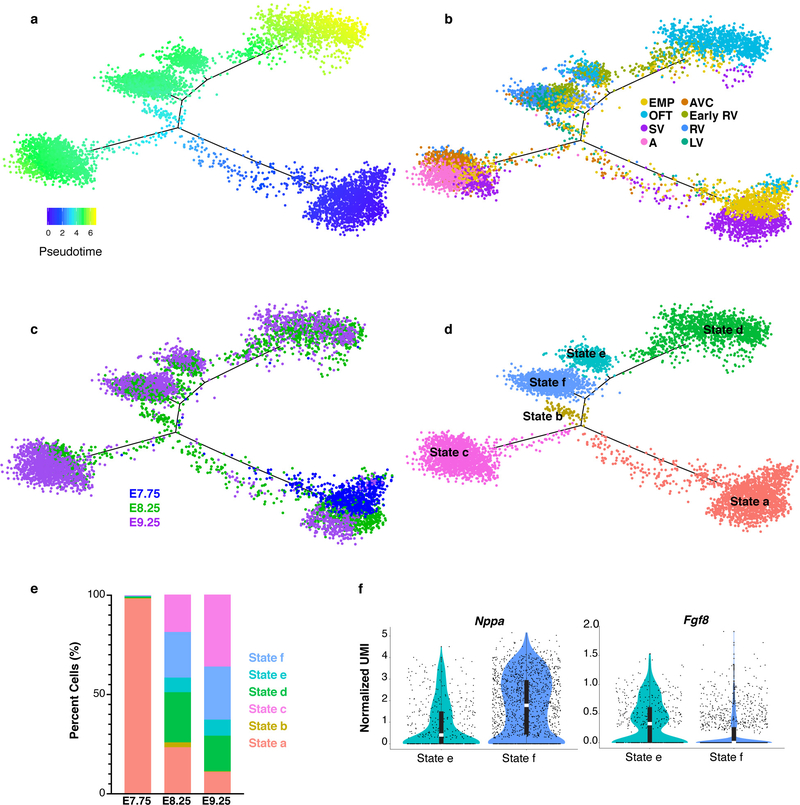
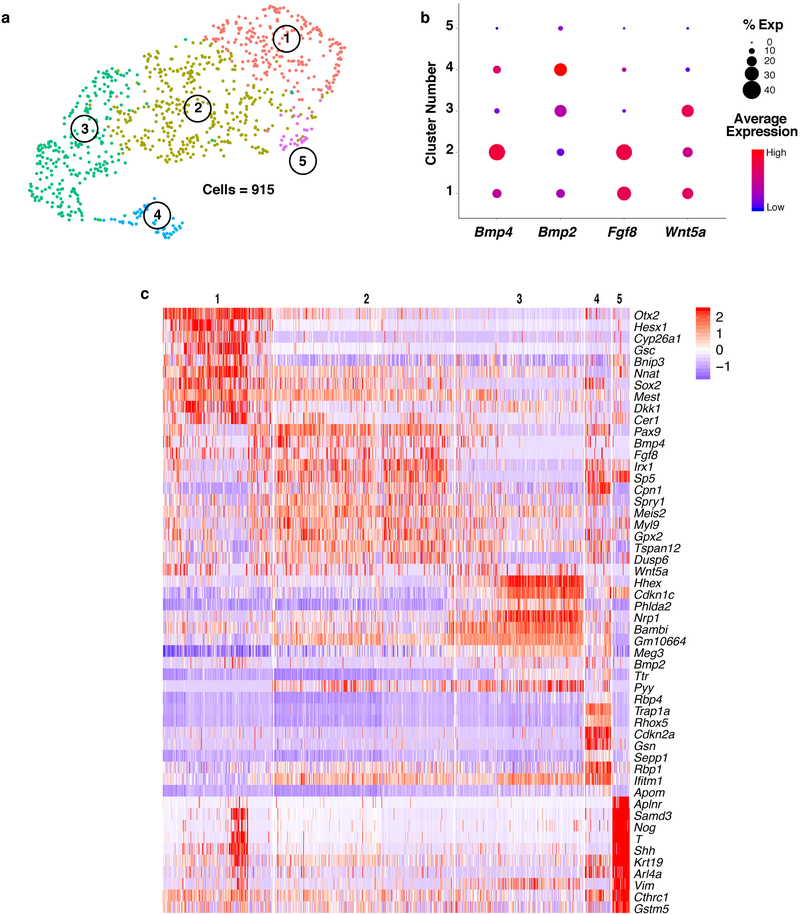
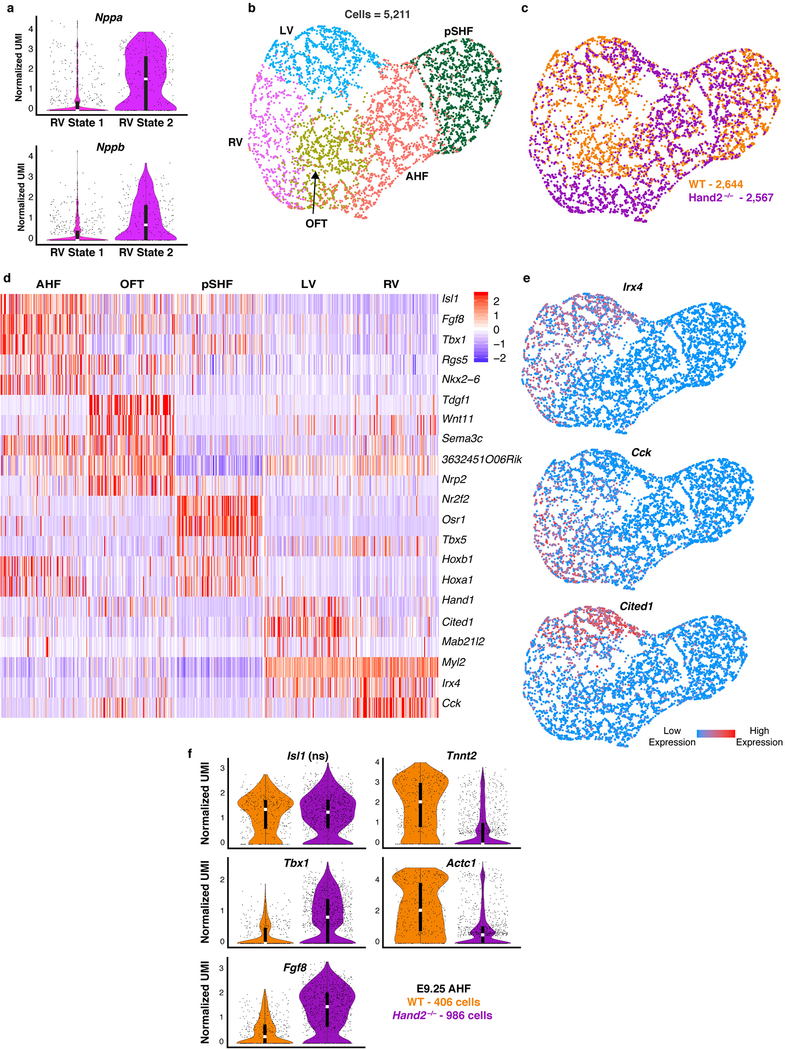
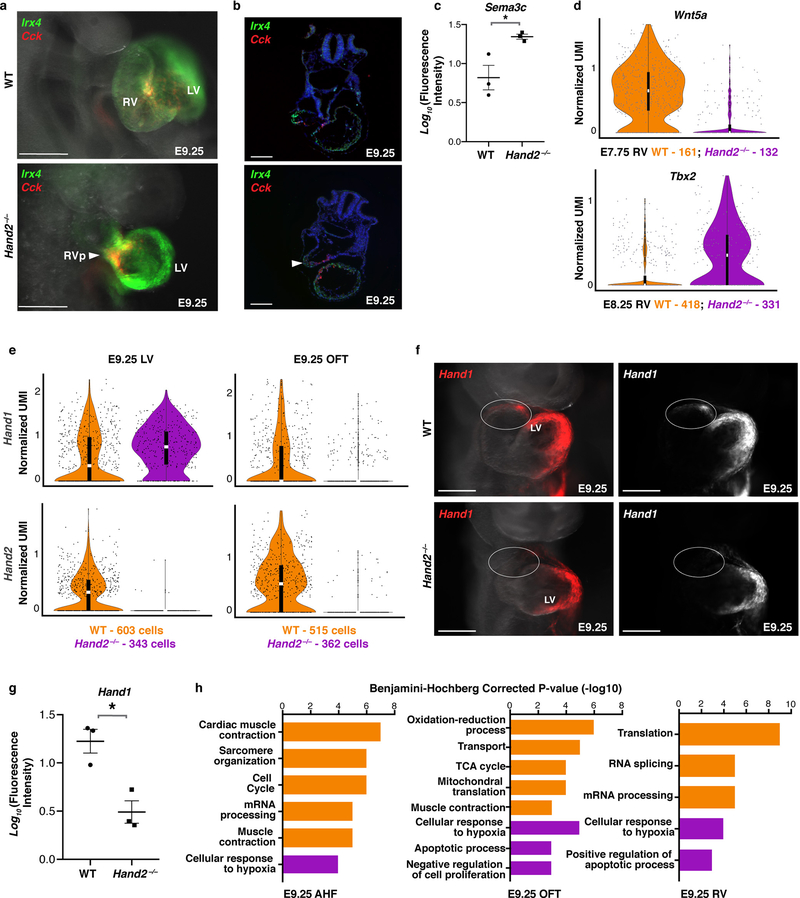
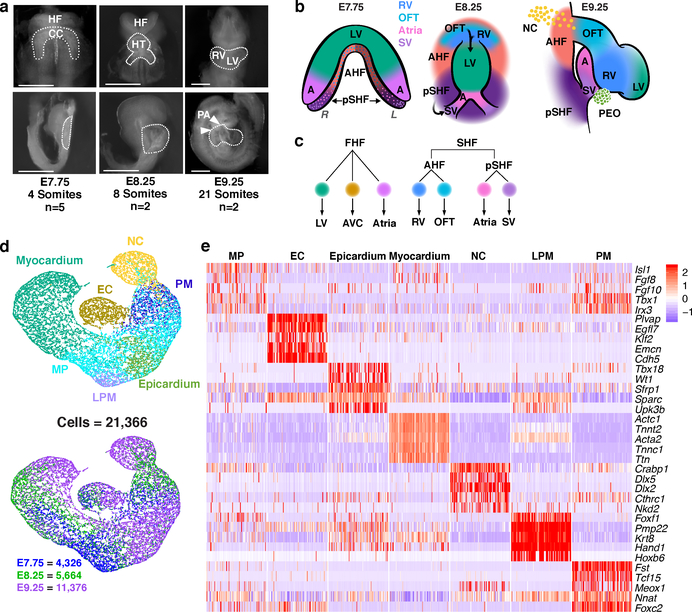
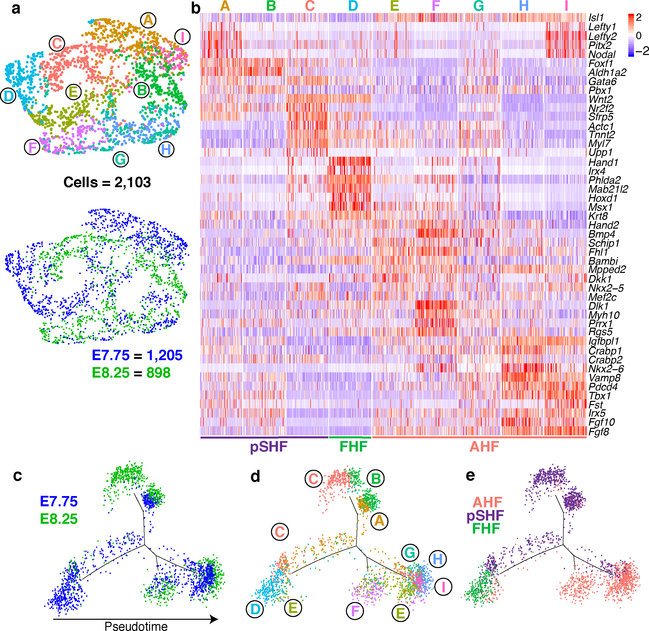
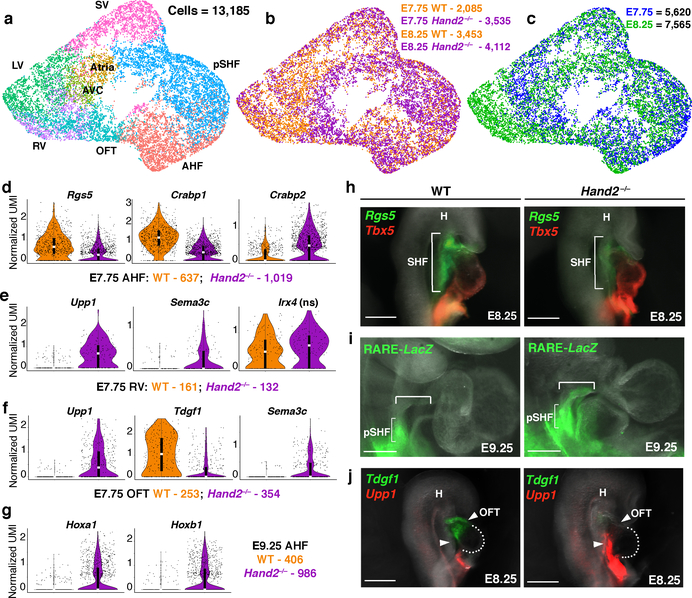
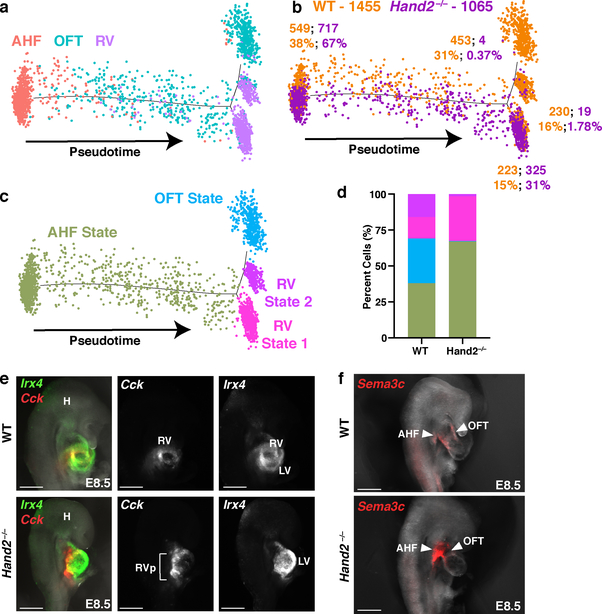
Organogenesis involves integration of diverse cell types; dysregulation of cell-type-specific gene networks results in birth defects, which affect 5% of live births. Congenital heart defects are the most common malformations, and result from disruption of discrete subsets of cardiac progenitor cells1, but the transcriptional changes in individual progenitors that lead to organ-level defects remain unknown. Here we used single-cell RNA sequencing to interrogate early cardiac progenitor cells as they become specified during normal and abnormal cardiogenesis, revealing how dysregulation of specific cellular subpopulations has catastrophic consequences. A network-based computational method for single-cell RNA-sequencing analysis that predicts lineage-specifying transcription factors2,3 identified Hand2 as a specifier of outflow tract cells but not right ventricular cells, despite the failure of right ventricular formation in Hand2-null mice4. Temporal single-cell-transcriptome analysis of Hand2-null embryos revealed failure of outflow tract myocardium specification, whereas right ventricular myocardium was specified but failed to properly differentiate and migrate. Loss of Hand2 also led to dysregulation of retinoic acid signalling and disruption of anterior-posterior patterning of cardiac progenitors. This work reveals transcriptional determinants that specify fate and differentiation in individual cardiac progenitor cells, and exposes mechanisms of disrupted cardiac development at single-cell resolution, providing a framework for investigating congenital heart defects.


Figures

Extended Data Figure 1:
Extended Data Figure 1:. Novel genes associated with CHD are enriched in specific cardiac populations.
a, UMAP plot of all captured cell populations colored by cluster and b, embryonic stage of collection. c, UMAP feature plot showing expression of marker genes used to identify and remove endoderm (Epcam), ectoderm (Sox2) and blood (Hbb-y) cell populations. Statistics for differential gene expression tests were applied to n = 36, 777 cells. d, UMAP plot of all mesodermal and neural crest populations captured at E7.75, E8.25 and E9.25 colored by cluster identity from Fig. 1d. e, Expression of Flt4 and Upp1 in Endocardium/Endothelium population. f, Expression of Rrad, Ank3 and Prkaa2 in sub-populations of the Myocardium. Statistics for differential gene expression tests were applied to n = 21,366 cells. MP, multipotent progenitors; EC, endocardium/endothelial cells; PM, paraxial mesoderm; LPM, lateral plate mesoderm.
Extended Data Figure 2:
Extended Data Figure 2:. Focused analyses of cardiac populations.
Schema of progressive subdivisions of broadly clustered cell populations from Fig. 1d that are discussed in the manuscript.
Extended Data Figure 3:
Extended Data Figure 3:. Spatial validation of marker gene expression by in situ hybridization.
a, Ventral view of Tdgf1 and Tnnt2 expression in the cardiac crescent (CC), right lateral views of Wnt5a and Bmp4 in the outflow tract (OFT), Mab21l2 and Shox2 in the sinus venosus (SV), and Hoxa1 and Hoxb1 in the posterior second heart field (pSHF) by in situ hybridization at days indicated that informed assignment of population identities in Extended Data Figure 4d and 5a. b, Expression of Tbx1 in the second heart field (SHF) and pharyngeal arches (PA) and novel unannotated gene 3632451O06Rik in the OFT at E8.25 and E9.25. c, Expression of Rgs5 and Isl1 in the SHF, Hand2 in the SHF and OFT and Tbx18 in the proepicardial organ (PEO) of E9.25 embryos. Scale bars indicate 200 μm unless otherwise noted. d, In situ hybridization of mRNA expression of Isl1, Fgf8 and Hoxb1 at E8.25 and Nr2f2 at E9.25 in right lateral histologic sections. n=2 independent embryos per gene for all panels. Scale bars indicate 50 μm. HF, head fold; HT, heart tube; H, head.
Extended Data Figure 4:
Extended Data Figure 4:. Heterogeneity in endocardium/endothelium and multipotent progenitor populations.
a, UMAP plot of reclustered Endocardium/Endothelium population colored by cluster and embryonic stage of collection. b, Violin plot of markers indicating distinct subpopulations of endocardium/endothelial cells. Summary statistics reported in violin plots: the center white line represents median gene expression and the central black rectangle spans the first quartile to the third quartile of the data distribution. The whiskers above or below the box indicate value at 1.5x interquartile range above the third quartile or below the first quartile. Statistics for differential gene expression tests were applied to n=2,199 cells. c, UMAP plot of reclustered multipotent progenitor populations colored by cluster and embryonic stage of collection. d, Heatmap showing curated list of marker genes that identify pSHF, AHF and branchiomeric muscle progenitors. Scale indicates Z-scored expression values. Statistics for differential gene expression tests were applied to n=5,376 cells. HE, hemato- endothelial progenitors; EC, endocardial/endothelial cells; EndMT, endothelial-mesenchymal transition cells; AHF, anterior heart field; pSHF, posterior second heart field.
Extended Data Figure 5:
Extended Data Figure 5:. Focused analyses of myocardial populations and spatial validation of right ventricle markers.
a, UMAP plot of reclustered “Myocardium” population colored by cluster and embryonic stage of collection. b, Heatmap of highly and uniquely expressed genes in myocardial subpopulations. Scale indicates Z-scored expression values. Statistics for differential gene expression tests were applied to n=6,474 cells. c, UMAP plot of reclustered ventricle populations colored by cluster and embryonic stage of collection. d, Heatmap showing curated list of genes that identify left ventricle (LV), right ventricle (RV) and early RV progenitors. Scale indicates Z-scored expression values. Statistics for differential gene expression tests were applied to n=1,976 cells. e, mRNA expression of left ventricle marker Hand1 (green) and Pln (red) in frontal view of the E9.5 heart showing enrichment in right ventricle region by whole mount in situ hybridization. n=2 independent embryos per gene, Scale bar, 200 μm. f, Breeding scheme for lineage-tracing Cck expressing cells. g, mRNA expression of endogenous Cck and TdTomato driven by Cck-cre transgene at E9.25 in right oblique view of the heart. n=2 independent embryos per gene; scale bar, 200 μm. h, Expression of TdTomato in whole-mount and sectioned postnatal day 1 (P1) heart from Ai14xCck-cre lineage-traced mice showing location of progeny of Cck-expressing cells. Left panels show brightfield view (top) or TdTomato (bottom) of whole-mount P1 heart; right panels show sections of TdTomato and DAPI (top) or TdTomato alone (bottom) in P1 heart section. n=2 independent embryos. Scale bar, 100 μm. EMP, early myocardial progenitors; SV, sinus venosus; A, atria; AVC, atrioventricular canal; OFT, outflow tract; V, ventricle; RV, right ventricle; LV, left ventricle; IVS, interventricular septum.
Extended Data Figure 6:
Extended Data Figure 6:. Pseudotemporal ordering of myocardium populations.
Pseudotime trajectory of myocardium populations colored by a, pseudotime value, b, cluster identity, c, embryonic stage of collection and d, cell state. Pseudotime trajectory analysis was applied to n=6,474 cells. e, Percentage of cells in each state that were captured at E7.75, E8.25 or E9.25. f, Violin plots showing expression of Nppa and Fgf8 in State e and State f from pseudotime trajectory in (d). Statistics for differential gene expression tests were applied to n = 455 cells from each state. Bonferroni correction adjusted p-value < 1×10⁻⁴ (Wilcoxon rank sum test, two-sided). Summary statistics reported in violin plots: the center white line represents median gene expression and the central black rectangle spans the first quartile to the third quartile of the data distribution. The whiskers above or below the box indicate value at 1.5x interquartile range above the third quartile or below the first quartile.
Extended Data Figure 7:
Extended Data Figure 7:. Endoderm populations adjacent to the cardiac crescent.
a, UMAP plot of endoderm populations captured at E7.75 colored by cluster. b, DotPlot highlighting expression patterns of known and novel endodermal secreted factors, Fgf8, Bmp4, Bmp2, and Wnt5a. The size of the dot indicates the percentage of cells expressing that gene within a cluster (% exp), while the color encodes the average expression level of that gene within a cluster. c, Expression heatmap of the top ten marker genes of each endodermal population and secreted factors from (b). Scale indicates Z-scored expression values. Statistics for differential gene expression tests were applied to n = 915 cells.
Extended Data Figure 8:
Extended Data Figure 8:. Transcriptional perturbation in Hand2-null embryos.
a, Heatmap of marker genes of populations from Fig. 3a. Statistics for differential gene expression tests were applied to n = 13,185 cells. b, Heatmap of differentially expressed genes between WT and Hand2-null OFT and c, RV cells captured at E7.75 and E8.25. Statistics were applied to n = 253 OFT cells/genotype at E7.75, n = 276 OFT cells/genotype at E8.25, n= 132 RV cells/genotype at E7.75, and n=331 RV cells/genotype at E8.25. Scale indicates Z-scored expression values. d, Quantification of fluorescence signal for indicated genes in Fig. 3h–j and Extended Data Fig. 8f. n=3 independent embryos per genotype. The mean +/− s.e.m is indicated. Two-tailed t-test. *P<0.05 and **P<0.01. e, Violin plots showing expression of Smyd1 and Sema3c in WT and Hand2-null E8.25 AHF cells. f, Expression of Hoxb1 in WT and Hand2-null embryos at E9.25 by whole mount in situ hybridization in right lateral view. Arrowheads indicate expanded anterior Hoxb1 expression in Hand2-null embryos. Scale bar, 500 μm. n=3 independent experiments with similar results. g, Proportion of WT and Hand2-null cells from each population captured at E7.75. n = 5 WT embryos and n = 3 Hand2-null embryos. The mean +/− s.e.m is indicated. Two-tailed t-test. *P<0.05 and **P<0.01. h, Violin plots showing expression of Nppa and Nppb in E8.25 WT and Hand2-null RV cells. All genes in a, b, c, e, h have a Bonferroni correction adjusted p-value < 1×10⁻⁴ (Wilcoxon rank sum test, two-sided). Violin plot summary statistics: center white line represents median gene expression and central black rectangle spans the first to third quartile of the data distribution. The whiskers indicate value at 1.5x interquartile range above the third quartile or below the first quartile.
Extended Data Figure 9:
Extended Data Figure 9:. Right ventricle cells are present in Hand2-null embryos at E9.25.
a, Violin plots showing expression of Nppa and Nppb in RV State 1 and 2 from Fig. 4c. Bonferroni correction adjusted p-value < 1×10⁻⁴ (Wilcoxon rank sum test, two-sided). Statistics for differential gene expression tests were applied to n = 251 cells from each State b, UMAP plot of subset of cardiac populations captured at E9.25 colored by cluster and c, genotype. d, Curated list of highly and uniquely enriched genes in cardiac populations at E9.25. Scale indicates Z-scored expression values. e, UMAP feature plot showing expression domains of Irx4, Cited1, and Cck indicating presence of LV and RV at E9.25. Statistics for differential gene expression tests for d and e were applied to n=5,211 cells. f, Violin plots of genes differentially expressed in WT vs Hand2-null AHF cells captured at E9.25. Bonferroni correction adjusted p-value < 1×10⁻⁴ (Wilcoxon rank sum test, two-sided). Isl1 is shown to indicate equivalent expression, and thus AHF identity, in WT and Hand2-null cells. ns, not significant. Violin plot summary statistics: center white line represents median gene expression and the central black rectangle spans the first quartile to the third quartile of the data distribution. The whiskers indicate value at 1.5x interquartile range above the third quartile or below the first quartile. RV, right ventricle; LV, left ventricle; OFT, outflow tract; AHF, anterior heart field; pSHF, posterior second heart field.
Extended Data Figure 10:
Extended Data Figure 10:. Right ventricle cell migration is impaired in Hand2-null embryos.
a, Whole-mount in situ hybridization for Irx4 and Cck in right lateral view and b, transverse sections at E9.25 indicating presence of RV cells in Hand2 mutants (arrowheads). n=2 independent experiments with similar results. Scale bar, 200 μm. c, Quantification of Sema3c fluorescence signal in Fig. 4h. n=3 replicate embryos per genotype. The mean +/− s.e.m indicated. Two-tailed t-test. *P<0.05. d, Violin plots of Wnt5a and Tbx2 expression in WT and Hand2-null RV cells at E7.75 and E8.25, respectively and e, Hand1 and Hand2 expression in LV and OFT cells at E9.25. All genes in d, e have a Bonferroni correction adjusted p-value < 1×10⁻⁴ (Wilcoxon rank sum test, two-sided). Violin plot summary statistics: center white line represents median gene expression and central black rectangle spans the first to third quartile of the data distribution. Whiskers indicate value at 1.5x interquartile range above the third quartile or below the first quartile. RV, right ventricle; RVp, right ventricle progenitors; LV, left ventricle; OFT, outflow tract; AHF, anterior heart field. f, In situ hybridization for Hand1 in WT and Hand2-null embryos at E9.25 in frontal view. n=3 independent experiments with similar results. g, Quantification of Hand1 fluorescent signal in the OFT. n=3 replicated embryos per genotype. The mean +/− s.e.m is indicated. Two-tailed t-test. *P<0.05. h, GO biological process terms of differentially expressed genes in WT and Hand2-null AHF (n = 406 cells per genotype), OFT (n = 362 cells per genotype) or RV (n = 227 cells per genotype) cells at E9.25, as determined with DAVID v6.8. Significant functional enrichment was statistically determined using a modified Fisher’s exact test (EASE score) followed by Benjamini-Hochberg correction for multiple comparisons, with 0.01 as a P-value cut-off.
Figure 1:
Figure 1:. Single-cell RNA-seq reveals heterogeneity of cardiogenic regions during early embryonic development.
a, Representative images of mouse embryos at E7.75, E8.25 and E9.25 used for cell collection, with micro-dissected regions indicated, in frontal view (top) and right sagittal view (bottom). Scale bar, 200 μm. Single-cell experiments were repeated with n=5 biologically independent embryos at E7.75, and n=2 biologically independent embryos at E8.25 and E9.25; similar results were obtained for embryos collected at the same developmental stage. b, Spatial organization of captured cardiac cell populations at each stage: frontal view at E7.75 and E8.25; right sagittal view at E9.25. Darker shaded region on left side of SHF at E7.75 indicates left-right asymmetric patterning. c, Lineage relationships between myocardial subtypes and progenitor domains d, UMAP plot of all captured mesodermal and neural crest populations colored by cluster identity and embryonic stage of collection. e, Expression heatmap of 5 marker genes of broadly defined populations. Statistics for differential gene expression tests were applied to n = 21, 366 cells. Data are shown for 100 cells subsampled from each population. Scale indicates Z-scored expression values. HF, head folds; CC, cardiac crescent; HT heart tube; RV, right ventricle; LV, left ventricle; PA, pharyngeal arches; FHF, first heart field; SHF, second heart field; AHF, anterior heart field; pSHF, posterior second heart field; NC, neural crest cells; OFT, outflow tract; AVC, atrioventricular canal; SV, sinus venosus; A, Atria; PEO, proepicardial organ containing epicardial cells. MP, multipotent progenitors; EC, endocardium/endothelial cells; PM, paraxial mesoderm; LPM, lateral plate mesoderm.
Figure 2:
Figure 2:. Analysis of cardiac progenitor cell populations reveals early specification dynamics of myocardial subtypes.
a, UMAP plot of AHF and pSHF subclusters colored by cluster identity and embryonic stage of collection. b, Expression of indicated highly and uniquely expressed genes in subpopulations from (a). Scale indicates Z-scored expression values. Pseudotime trajectory of CPCs colored by c, embryonic stage of collection, d, population identity and e, AHF, pSHF or FHF origin.
Figure 3:
Figure 3:. Transcriptional dysregulation in Hand2-null embryos reveals ectopic retinoic acid signaling with posteriorization of AHF-derivatives.
a, UMAP plot of WT and Hand2-null cells colored by cluster, b, genotype and c, embryonic stage of collection. Violin plots showing expression of genes in WT and Hand2-null AHF, RV and OFT cells at E7.75 (d-f) and AHF cells at E9.25 (g). ns, not significant. All genes represented have a Bonferroni correction adjusted p-value < 1×10⁻⁴ (Wilcoxon rank sum test, two-sided). h, mRNA in situ hybridization for expression of Rgs5 and Tbx5 at E8.25. i, Expression of lacZ transgene driven by retinoic acid response element (RARE) validated at E9.25 by whole-mount in situ hybridization focused on cardiac region. Bracketed region indicates ectopic RARE activity in Hand2-null embryos compared to WT. j, mRNA in situ hybridization for expression of Tdgf1 and Upp1 at E8.25. All scale bars, 200 μm. n=3 independent experiments with similar results for h, i and j, shown in right lateral views. pSHF, posterior second heart field; SHF, second heart field; H, head; OFT, outflow tract. Violin plot summary statistics: center white line represents median gene expression and central black rectangle spans the first quartile to the third quartile of the data distribution. The whiskers indicate value at 1.5x interquartile range above the third quartile or below the first quartile.
Figure 4:
Figure 4:. Hand2 loss disrupts outflow tract myocardial cell specification as well as right ventricle myocardial cell differentiation and migration.
a, Pseudotime trajectory of AHF, OFT and RV cells at E8.25 colored by cluster identity, b, genotype and c, cell state. n = 2 biologically independent embryos per genotype. Numbers in b indicate absolute number of cells of each genotype in each cell state. Percentages indicate proportions of cells per genotype in each state, graphically represented in (d). e, Expression of Cck and Irx4 by in situ hybridization in right lateral view to localize RV cells at E8.5 and corresponding fluorescence image for Cck or Irx4 expression alone. n=2 independent experiments with similar results. Scale bar, 200 μm. f, Expression of Sema3c to localize AHF cells and derivatives at E8.5 in right lateral view. n = 3 independent experiments with similar results. Scale bar, 200 μm. H, head; RV, right ventricle; RVp, right ventricle progenitors; LV, left ventricle; AHF, anterior heart field; OFT, outflow tract.

References

    1. Srivastava D Making or breaking the heart: from lineage determination to morphogenesis. Cell 126, 1037–48 (2006). - PubMed
    1. Okawa S, Nicklas S, Zickenrott S, Schwamborn JC & del Sol A A generalized gene-regulatory network model of stem cell differentiation for predicting lineage specifiers. Stem Cell Reports 7, 307–315 (2016). - PMC - PubMed
    1. Okawa S & del Sol A A computational strategy for predicting lineage specifiers in stem cell subpopulations. Stem Cell Res. 15, 427–434 (2015). - PubMed
    1. Srivastava D et al. Regulation of cardiac mesodermal and neural crest development by the bHLH transcription factor, dHand. Nat. Genet 16, 154–160 (1997). - PubMed
    1. Jin SC et al. Contribution of rare inherited and de novo variants in 2,871 congenital heart disease probands. Nat. Genet 49, 1593–1601 (2017). - PMC - PubMed

Substances