. 2019 Aug;572(7768):205-210.
doi: 10.1038/s41586-019-1432-8. Epub 2019 Jul 24.

De novo design of bioactive protein switches

Affiliations

De novo design of bioactive protein switches

Robert A Langan et al. Nature. 2019 Aug.

Abstract

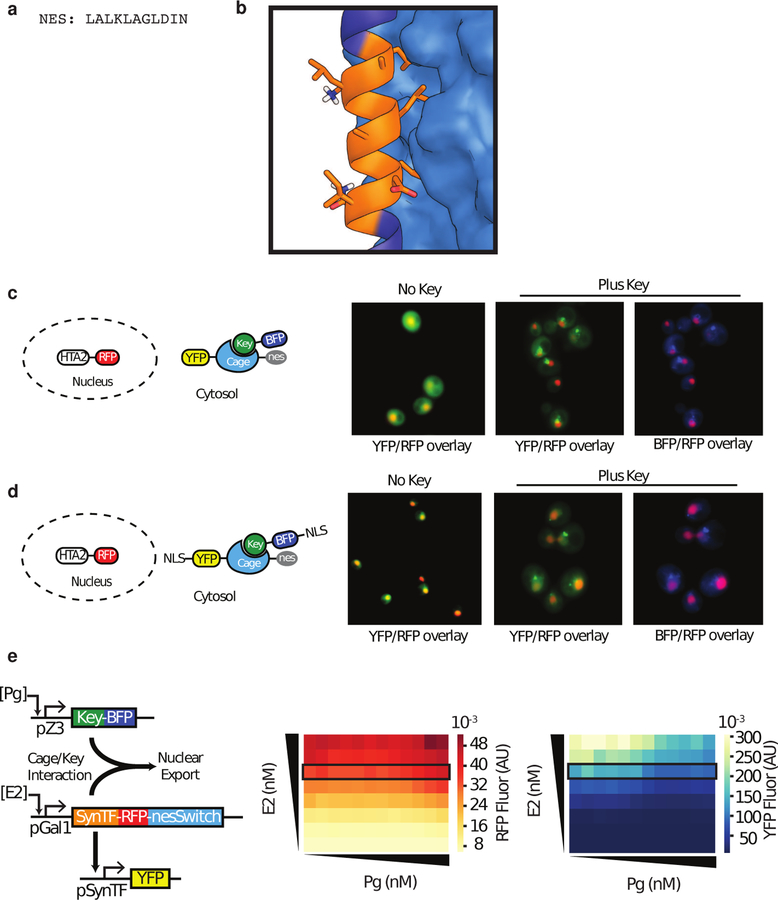
Allosteric regulation of protein function is widespread in biology, but is challenging for de novo protein design as it requires the explicit design of multiple states with comparable free energies. Here we explore the possibility of designing switchable protein systems de novo, through the modulation of competing inter- and intramolecular interactions. We design a static, five-helix 'cage' with a single interface that can interact either intramolecularly with a terminal 'latch' helix or intermolecularly with a peptide 'key'. Encoded on the latch are functional motifs for binding, degradation or nuclear export that function only when the key displaces the latch from the cage. We describe orthogonal cage-key systems that function in vitro, in yeast and in mammalian cells with up to 40-fold activation of function by key. The ability to design switchable protein functions that are controlled by induced conformational change is a milestone for de novo protein design, and opens up new avenues for synthetic biology and cell engineering.


Conflict of interest statement

Competing Interests: RAL, SEB, DB, WRPN, and MJL have filed a provisional patent describing the design, composition, and function of LOCKR switches, keys, and scaffolds; RAL, AHN, SEB, MJL, DB, and HE-S have filed a provisional patent application describing the design, composition, and function of degronLOCKR constructs; DB, RAL, SEB, and MJL hold equity in Lyell Immunopharma, Inc. DB holds equity in Sana Biotechnology.

Figures

Extended Data Figure 1:
Extended Data Figure 1:. Biophysical data from LOCKR design.
a) Size Exclusion Chromatography for the Monomer, Truncation, and LOCKR designs on Superdex 75. Peaks indicated by vertical dashed lines represent monomeric protein used in downstream characterization and functional assays. SEC repeated three times with similar results. b) Circular dichroism spectroscopy to determine protein stability upon heating and chemical denaturant, guanidinium chloride. Top row: full wavescan at 25°C (blue), 75°C (orange), 95°C (red), then cooled to 25°C (cyan). Middle row: guanidinium chloride melts also shown overlapped in Figure 1d. Bottom row: fraction folded was converted to equilibrium constant, then to ΔGunfolding value. The linear unfolding region, marked by vertical lines in middle row, was fit to determine the ΔGfolding for each design. Repeated four times with similar results. c) SAXS spectra (black) referenced in Figure 1e fit to Rosetta design models (red) using FoXS with chi-values referenced in the upper right.
Extended Data Figure 2:
Extended Data Figure 2:. GFP pulldown assay finds mutations for LOCKR.
Different putative LOCKR constructs were adhered via 6x-His tag to a Ni coated 96-well plate, Key-GFP was applied, and excess washed. Resulting mean fluorescence values represent Key-GFP bound to LOCKR constructs. The truncation was used as a positive control, since the Key binds to the open interface. The monomer as a negative control since it does not bind the Key. Error bars represent the standard deviation of three technical replicates, because Key-GFP was not purified from bacterial lysate leading to minor technical variability.
Extended Data Figure 3:
Extended Data Figure 3:. Caging Bim-related sequences.
a) Three Bcl2 binding sequences were grafted onto the Latch. aBcl2 is a single helix from a designed Bcl2 binder (pdb: 5JSN) where non Bcl2-interacting residues were reverted back to the standard LOCKR Latch sequence, shown as dashes. pBim is the partial Bim sequence where only Bcl2-interacting residues are grafted onto the Latch. Bim is the full consensus sequence of the BH3 domain. b) LOCKR (left) with the Latch in dark blue. The helical Bim sequence is taken from the Bim/Bcl2 interaction and grafted onto the Latch c) Left: Bcl2 (tan) binding to Bim (orange) from pdb:2MV6 with pBim residues shown as sticks. Center: a well caged graft where important binding residues are caged. Right: a poor graft where Bcl2 binding residues are exposed and polar surface residues are against the Cage interface. d) Tuning BimLOCKR. aBcl2, pBim, and Bim were caged to varying degrees of success. Early versions of the switch, with aBcl2 and pBim did not efficiently cage Bcl2 binding in the off state. They also only weakly bound the Key leading to small dynamic range. The Cage and Key was extended by 5, 9, and 18 residues in an attempt to provide a larger interface to tightly hold the Latch in the off state and provide a larger interface for Key binding to increase the dynamic range of activation. Mutations on the Latch, identified in Extended Data 2, and providing toeholds for Key binding were the two strategies employed to tune the switch. In graphs, “off” refers to 250–310 nM switch an absence of Key while “on” refers to excess Key added. The height of the bar graph shows the Req as measured by Bio-layer interferometry.
Extended Data Figure 4:
Extended Data Figure 4:. Validation of model in Figure 1a.
a) Measurement of Bim:Bak affinity. Bio-layer interferometry (BLI) at three concentrations gives on and off rates for Bim:Bak binding, yielding the constants shown on right. Mean shown with standard deviation of four technical replicates to account for variablility in drift on the BLI instrument. b) BLI measurement of BimLOCKRa (400 nM) binding to Bcl2 (gold), BclB (yellow), and Bak (lighter yellow - BimLOCKR at 1 μM) as Key is added to solution. Normalized due to differences in Rmax for Bcl2 and BclB on the tip. c) BLI measurement of BimLOCKRa binding to Keya immobilized on the tip. Open circles are with no Bcl2 present, gold points are with Bcl2 present at 500 nM.
Extended Data Fig 5:
Extended Data Fig 5:. Caging cODC sequences.
a) Three variations of the cODC degron to Cage. Variations meant to tune Kopen by removing the destabilizing proline (noPro) and minimizing mutations to the Latch (CA only). b) Predicted models of the full and noPro cODC sequences (orange) threaded onto the Latch (dark blue). Thread position chosen such that the cysteine residue needed for degradation is sequestered against the Cage (light blue). Proline highlighted in red in the full cODC mutated to an isoleucine in the noPro variant. c) Comparing the stability of YFP fused to cODC variants caged in Switcha to an empty Switcha and to bimSwitcha. The dual-inducible system from Fig 3a was used to express the various YFP-Switcha fusions (solid lines and dots) via pGAL1 and E2, and Keya-BFP via pZ3 and Pg. YFP (Venus) alone, YFP fused to the WT cODC (cODC) or YFP fused to the proline removed cODC (cODC noPro), were also expressed using pGal1 and E2 (dashed lines). Cells were induced with a saturating dose of E2 (50 nM) and Pg was titrated in from 0–200 nM. Fluorescence was measured at steady-state using a flow cytometer; data represent mean ± s.d. of three biological replicates. Lines connecting data are a guide to the eye. A moderate decrease in YFP fluorescence was observed as a function of Pg for the full cODC variant, whereas only a small decrease was observed for the proline removed and CA only. No decrease in fluorescence was observed as a function of Key induction for YFP alone, empty Switcha, or bimSwitcha. d) Tuning toehold lengths of degronLOCKRa. The dual-inducible system from Fig 3a was used to express the various YFP-Switcha fusions via pGal1 and E2, and Keya-BFP via pZ3 and Pg. YFP fused to the proline-removed cODC (cODC no Pro) was also expressed using pGal1 and E2 (dashed line). Cells were induced with a saturating dose of E2 (50 nM) and Pg was titrated in from 0–200 nM. Fluorescence was measured at steady-state using a flow cytometer; data represent mean ± s.d. of three biological replicates. Lines connecting data are a guide to the eye. (Left) cODC variants alone to show dynamic range of Full cODC. (Right) Extending toehold on proline-removed version from 9 to 12 and 16aa. Proline-removed with 12aa toehold shows the greatest dynamic range of all the Switches tested.
Extended Data Figure 6:
Extended Data Figure 6:. YFP (a) and BFP (b) expression corresponding to Fig 3b.
0–50nM E2 and 0–200nM Pg were used to induce expression of YFP-degronSwitcha and Keya (Full-length or truncated)-BFP, respectively. Fluorescence was measured at steady-state using a flow cytometer. Heatmaps depict mean fluorescence and are a representative sample of three biological replicates. E2 dose (50nM) depicted in Fig 3b is indicated with the black rectangle on the heatmaps. YFP fluorescence was normalized to the maximum fluorescence (50nM E2, 0nM Pg). BFP expression was not dependent on expression of the Switch, suggesting the Key does not co-degrade with the Switch.
Extended Data Figure 7:
Extended Data Figure 7:. degronLOCKRa-d orthogonality.
All combinations of pTDH3-YFP-degronSwitch and pTDH3-Key-CFP were tested. Fluorescence was measured at steady-state using a flow cytometer. YFP fluorescence was averaged across three biological replicates. Percentage degradation was calculated by subtracting the mean YFP-degronSwitch fluorescence with the given Key-CFP coexpressed from the YFP-degronSwitch fluorescence without any Key expressed and normalizing by the YFP-degronSwitch fluorescence without any Key expressed. degronSwitcha is activated strongly by Keya and weakly by Keyb. degronSwitchc is activated strongly by Keyc and weakly by Keyb. Because degronSwitcha and degronSwitchc are not activated by Keyc and Keya respectively, we consider these two to be an orthogonal pair.
Extended Data Figure 8:
Extended Data Figure 8:. Comparison of different degronSwitch variants in HEK293T cells.
Fluorescence of RFP-degronSwitch variants in the presence and absence of Key-BFP were measured using flow cytometry. Original symmetric design was compared against a new asymmetric design. Two toehold lengths were tested for each variant. Data in bar graph represents geometric mean ± s.d. of three biological replicates. Histograms are depicted for a representative sample. Asymmetric cage with a t8 toehold demonstrates the largest dynamic range.
Extended Data Figure 9:
Extended Data Figure 9:. YFP and RFP expression for synTF (a) and dCas9-VP64 (b)
assay corresponding to Fig 4 as a function of E2 (0–125 nM) and Pg (0–100 nM). YFP fluorescence represents transcriptional output of either synTF or dCas9-VP64 and RFP fluorescence represents fluorescence of either synTF or dCas9-VP64. Fluorescence was measured at steady-state using flow cytometry. Heatmaps depict mean fluorescence and are a representative sample of three biological replicates. E2 dose (31.25nM) depicted in Fig 5 is indicated with the black rectangle on the heatmaps.
Extended Data Figure 10:
Extended Data Figure 10:. Design and characterization of nesLOCKR.
a) NES used in this report. b) The NES (orange) caged on the helical Latch (dark blue, cartoon) with hydrophobic residues sequestered against the Cage (light blue, surface) c) (Left) Schematic of cytosolic YFP-nesSwitcha and Key-BFP with nuclear marker HTA2-RFP. (Right) YFP fluorescence shows the expected cytosolic distribution when YFP-nesSwitcha is expressed with no NLS (left) but punctae of YFP fluorescence is observed when both YFP-nesSwitcha and Key-BFP are expressed in the cytosol, which we assume is due to aggregation of the nesSwitcha. Key-BFP fluorescence is co-localized to YFP-nesSwitcha fluorescence. d) (Left) Schematic of NLS-YFP-nesSwitcha with Key-BFP-NLS with nuclear marker HTA2-RFP. (Right) YFP-nesSwitcha is localized to the nucleus when expressed with the strong (SV40) NLS. When Key-BFP is expressed with a moderately strong NLS, the same pattern of cytosolic YFP punctae formation is observed as when Key-BFP is expressed without a NLS (Figure 5b), indicating that uncaging of the NES is independent of NLS on Key-BFP localization. Key-BFP-NLS fluorescence is co-localized to NLS-YFP-nesSwitcha fluorescence e) YFP and RFP expression for synTF assay corresponding to Fig 5c as a function of E2 (0–125 nM) and Pg (0–500 nM). Fluorescence was measured at steady-state using flow cytometry. Heatmaps depict mean fluorescence and are a representative sample of three biological replicates. E2 dose (31.25nM) depicted in Fig 5c is indicated with the black rectangle on the heatmaps.
Figure 1.
Figure 1.. Design of the LOCKR system.
a, The Switch, composed of a Cage (cyan) and Latch (blue) with a functional motif (orange), has a thermodynamic transition to the open state able to bind Key (green) or Target (yellow). b, Numerical solutions of the model in (a) for different values of KLT (1 nM, left; 50 nM, right) and Kopen (0.1, red; 0.001, orange; 1e-5, green; 1e-7, blue; 1e-9, purple) with KCK fixed at 1 nM. c, Conversion of 5L6HC3 to monomeric frameworks. In LOCKR (right), the double mutant V223S/I238S allows the Key to bind. d, Guanidinium chloride denaturation of trimer (dark blue), monomer (cyan), truncated five-helix framework (red), and LOCKR (green) monitoring mean residue ellipticity (MRE) at 222 nm. Repeated 3 times with similar results. e, Small-angle X-ray scattering (SAXS) Kratky plots for the monomeric frameworks are similar to that of the input trimer, with the greatest deviation for the five-helix framework. Colors continued from (d). f, Key-GFP was added to monomeric frameworks immobilized onto a plate via a hexahistidine tag; after washing, binding was measured by GFP fluorescence (mean of n=3 technical replicates, error bars indicate s.d).
Figure 2.
Figure 2.. BimLOCKR design and activation.
a, Bio-layer interferometry (BLI) measurement of BimLOCKR (250 nM) binding to immobilized Bcl2 in the presence and absence of 5 µM Key. Bim is tightly caged in the absence of Key; introduction of the toehold (right) allows key to outcompete Latch leading to Bcl2 binding. b, BLI measurement of Key-dependent binding of 250 nM BimLOCKR to Bcl2. Purple is 3 µM Key, then a three-fold dilution of the Key through blue, cyan, green, yellow, and orange; control without Key in red. c, Bcl2 binding by BimLOCKR as a function of Key concentration. BLI data was fit for the different length Keys to obtain equilibrium sensor response. BLI experiments (b,c) repeated three times with similar results. d, Bcl2 binding of BimSwitcha (dark blue), BimSwitchb (blue), and BimSwitchc (light blue) designs in response to cognate Key, measured by BLI and normalized to Rmax. Repeated twice with similar results. e, Bcl2 binding in BLI experiments for each Switch at 250 nM, Key at 5 µM; data points are average Rmax of two replicates.
Figure 3.
Figure 3.. Testing functionality of degronLOCKR in live cells.
a, Dual-induction system used in S. cerevisiae to test degronLOCKR function. b, Dose response of YFP-degronSwitcha and Keya-BFP at 50nM E2 as a function of Pg induction. YFP, normalized to no Pg; BFP normalized to max Pg. Lines connecting data are a guide to the eye. c, Dynamics of degronLOCKR using an automated flow cytometry platform. Cells were grown to steady-state at 50nM E2 then induced with Pg to express Keya-BFP at t0hrs. Lines represent moving average taken over three data points. d, Dose response of orthogonal degronLOCKRs as a function of Pg. YFP-degronSwitcha and RFP-degronSwitchc were expressed constitutively in the same cell with either Keya-BFP (left) or Keyc-BFP (right) expressed using Pg. YFP-degronSwitcha, RFP-degronSwitchc and either Keya-BFP or Keyc-BFP were normalized to no Pg (RFP, YFP) or max Pg (BFP). Lines connecting data are a guide to the eye. e, Asymmetric RFP-degronSwitcha was expressed in HEK293T cells with and without Key. Flow cytometry distribution of RFP fluorescence for a representative sample indicates decreased RFP expression in the presence of Key. Geometric mean of RFP expression is quantified in the bar plot. Data in all panels represent mean ± s.d. of three biological replicates.
Figure 4.
Figure 4.. Controlling gene expression using degronLOCKR in yeast.
a, (Left) Dual-induction system used to determine the effect of degronLOCKRa on a synthetic transcription factor (synTF). (Right) Dose response of YFP, SynTF-RFP-degronSwitcha and Keya-BFP-NLS at 31.25nM E2 as a function of Pg induction, normalized to no Pg (YFP, RFP) or max Pg (BFP). b, (Left) Dual-induction system used to determine the effect of degronLOCKRa on a dCas9-VP64 targeted to the pTet7x promoter. (Right) Dose response of YFP, dCas9-VP64-RFP-degronSwitcha and Keya-BFP-NLS at 31.25 nM E2 as a function of Pg induction, normalized to no Pg (YFP, RFP) or max Pg (BFP). Data in all panels represent mean ± s.d. of three biological replicates. Lines connecting data are a guide to the eye.
Figure 5.
Figure 5.. Controlling protein localization using nesLOCKR in yeast.
a, Key-induced nuclear export of NLS-YFP-nesSwitcha. The nucleus is marked by the histone HTA2-RFP. b, Fluorescence microscopy showing co-localization of NLS-YFP-nesSwitcha (green) with nuclear HTA2-RFP (red) fluorescence when no Keya-BFP is expressed (top), compared to a more diffuse NLS-YFP-nesSwitcha fluorescent signal observed outside of the nucleus when Keya-BFP is expressed (bottom). Images shown are representative of n=3 biological replicates. c, (Left) Dual-induction system used to determine the effect of nesLOCKRa on a synthetic transcription factor (synTF). (Right) Dose response of YFP, synTF-RFP-nesSwitcha and Keya-BFP at 31.25 nM E2 as a function of Pg induction, normalized to no Pg (RFP, YFP), maximum Pg (BFP). Data represent mean ± s.d. of three biological replicates. Lines connecting data are a guide to the eye.

References

    1. Huang P-S, Boyken SE & Baker D The coming of age of de novo protein design. Nature 537, 320–327 (2016). - PubMed
    1. Huang P-S et al. High thermodynamic stability of parametrically designed helical bundles. Science 346, 481–485 (2014). - PMC - PubMed
    1. Brunette TJ et al. Exploring the repeat protein universe through computational protein design. Nature 528, 580–584 (2015). - PMC - PubMed
    1. Rocklin GJ et al. Global analysis of protein folding using massively parallel design, synthesis, and testing. Science 357, 168–175 (2017). - PMC - PubMed
    1. Ambroggio XI & Kuhlman B Design of protein conformational switches. Curr. Opin. Struct. Biol 16, 525–530 (2006). - PubMed

Publication types

MeSH terms