. 2019 Aug;572(7767):74-79.
doi: 10.1038/s41586-019-1434-6. Epub 2019 Jul 24.

Resolving medulloblastoma cellular architecture by single-cell genomics

Affiliations

Resolving medulloblastoma cellular architecture by single-cell genomics

Volker Hovestadt et al. Nature. 2019 Aug.

Abstract

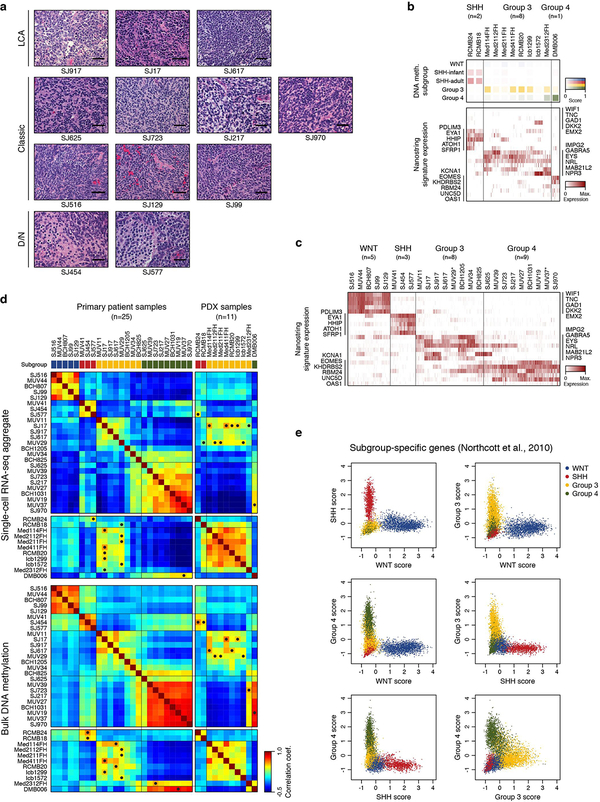
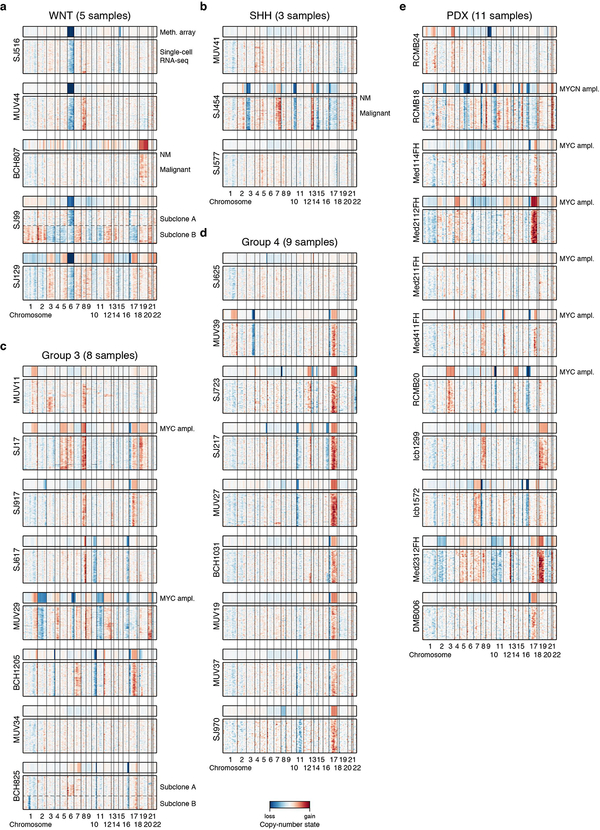
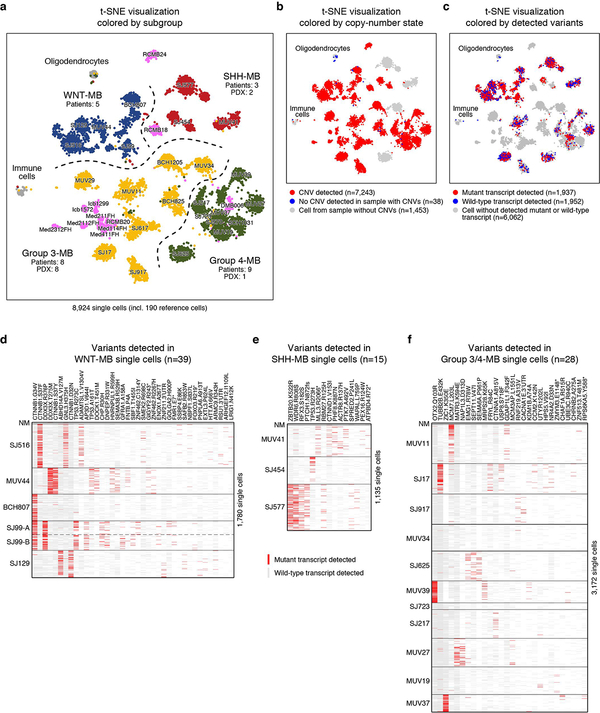
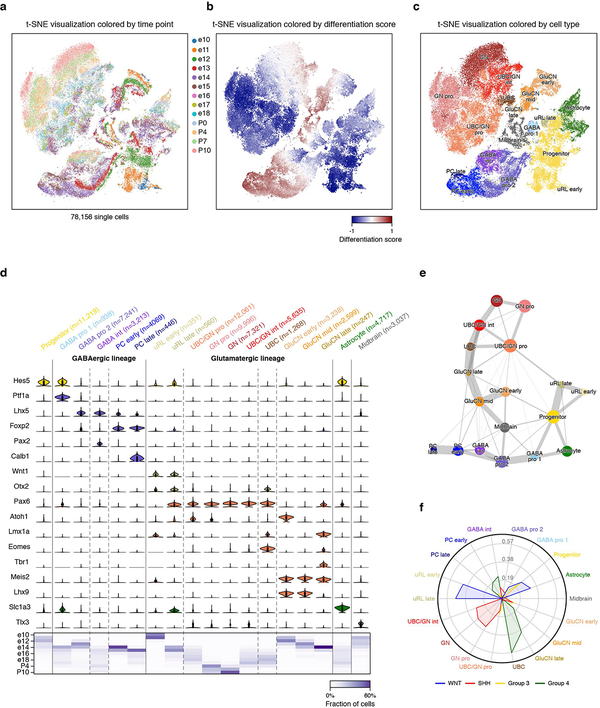
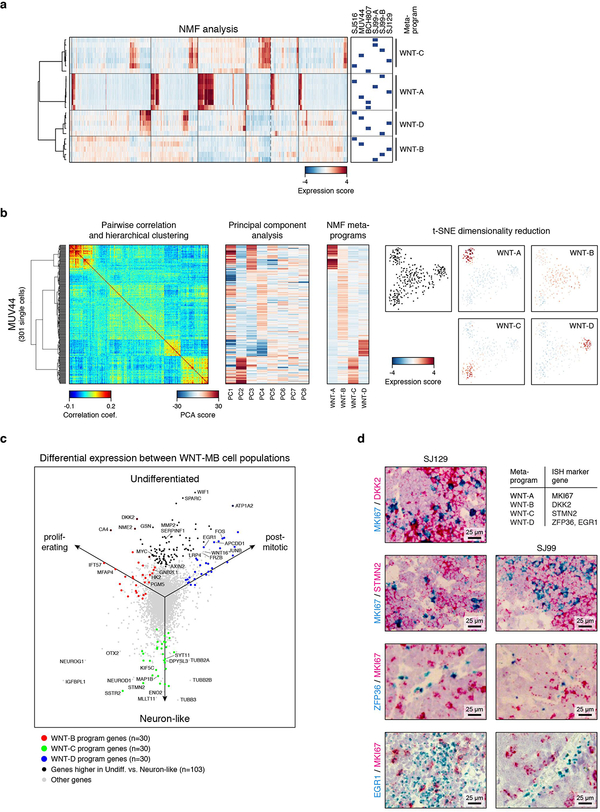
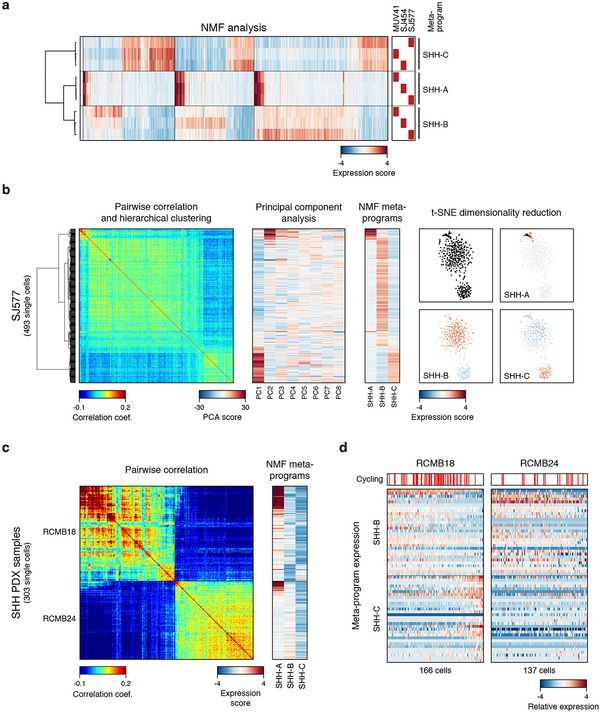
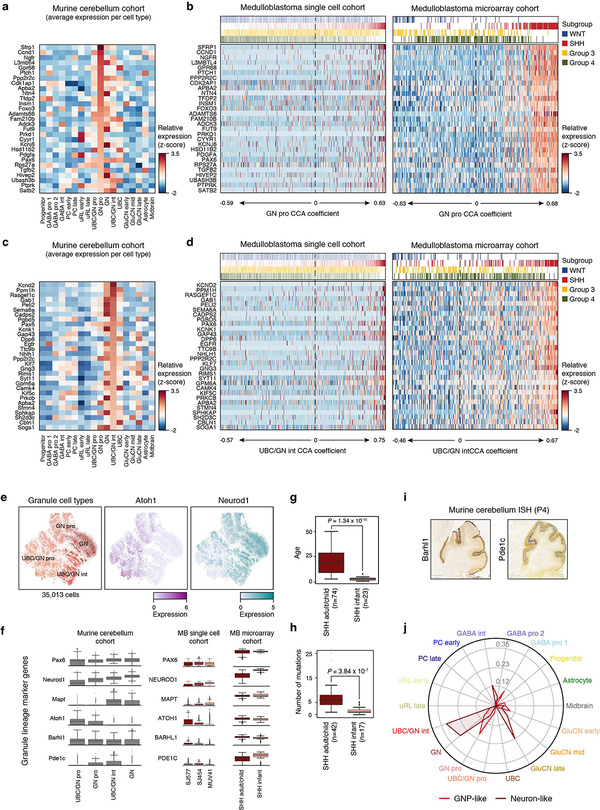
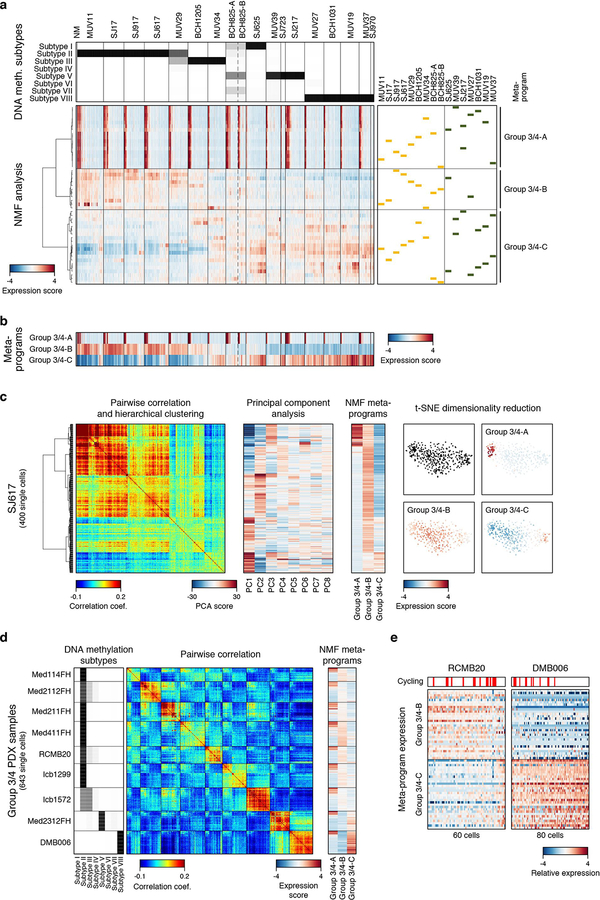
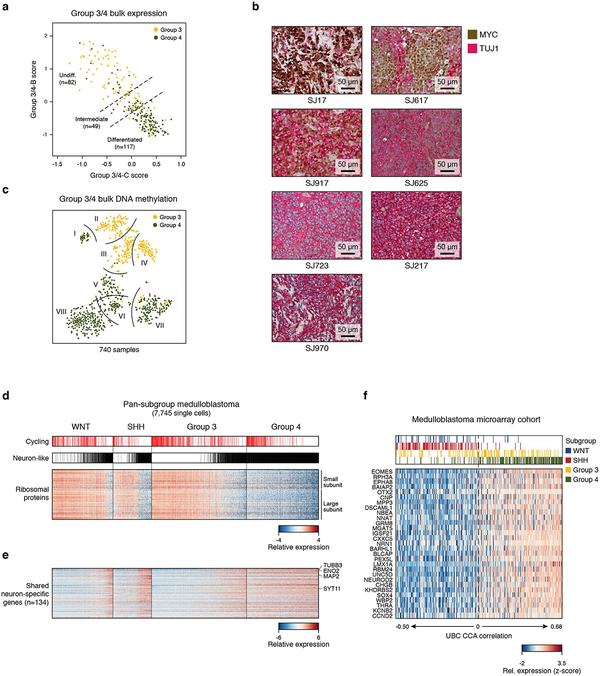
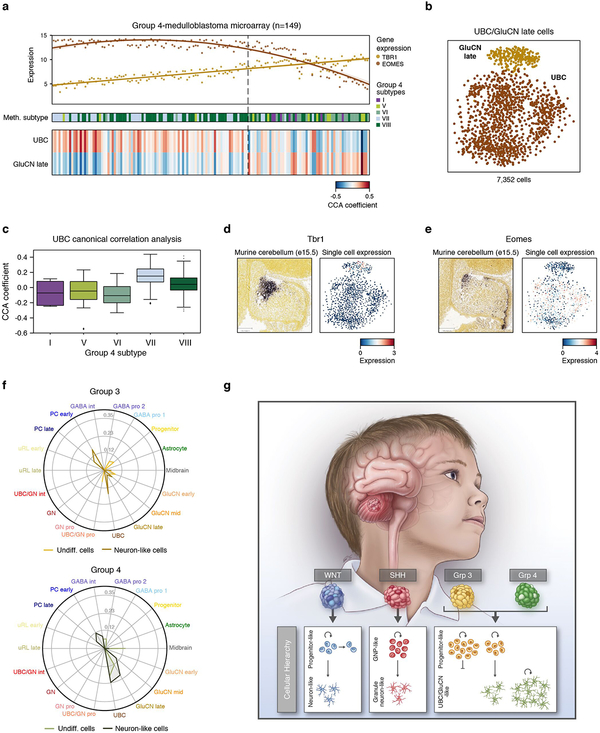
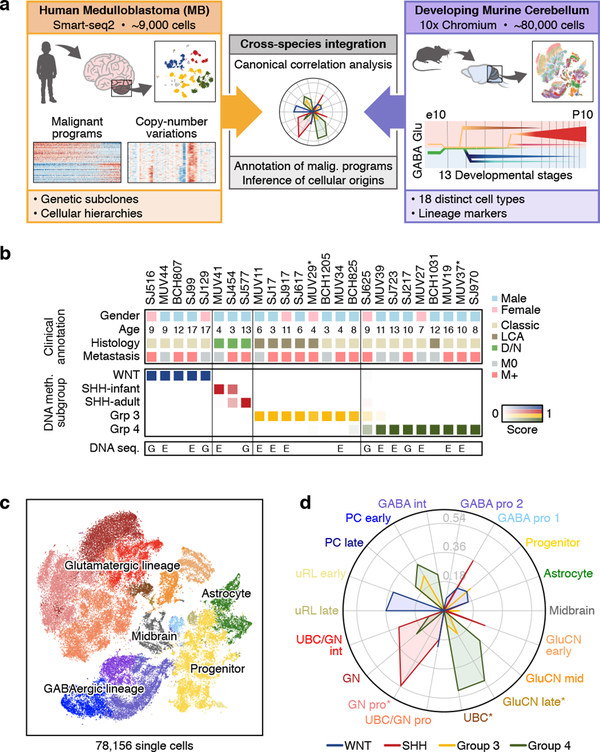
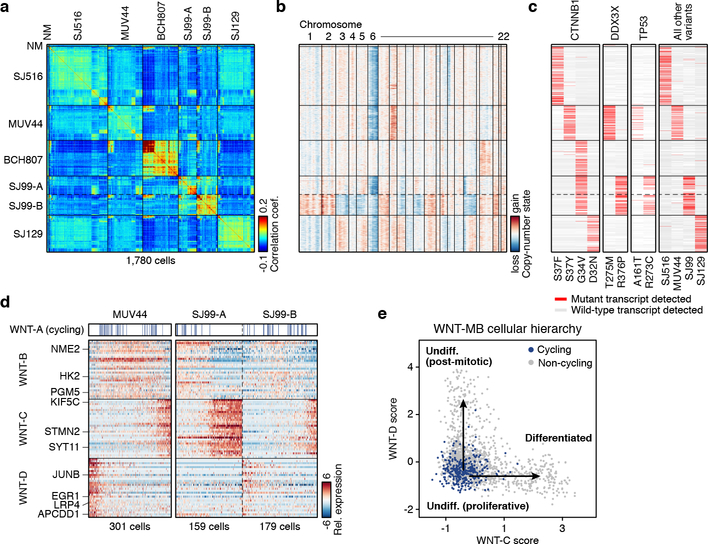
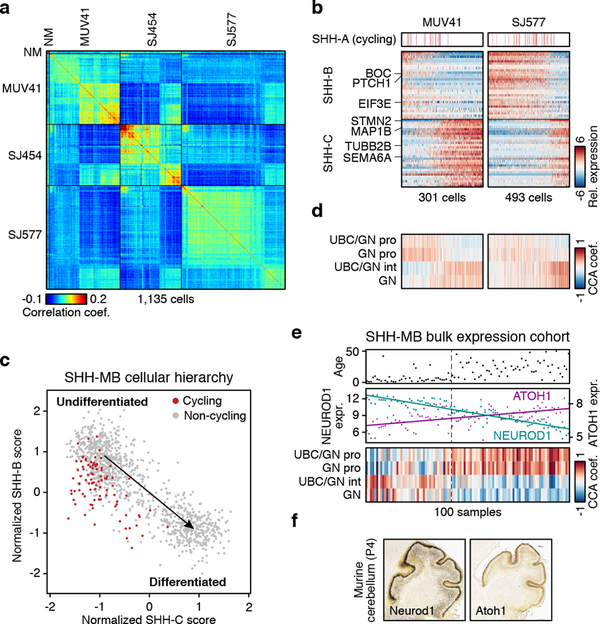
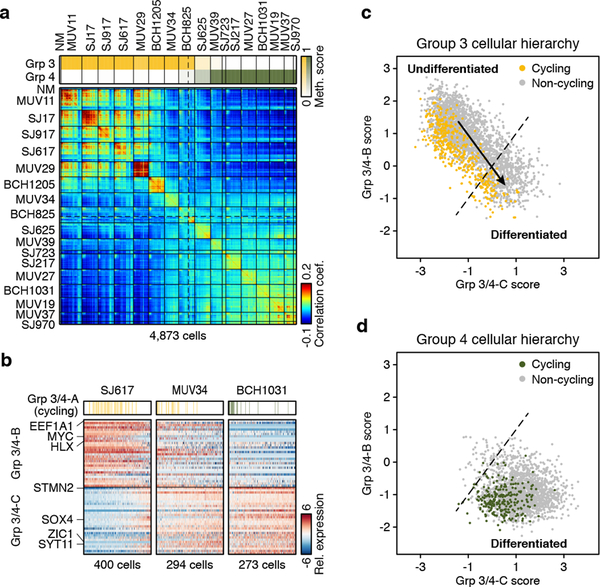
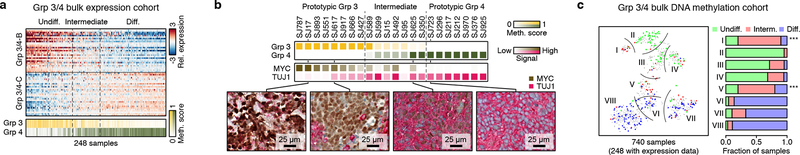
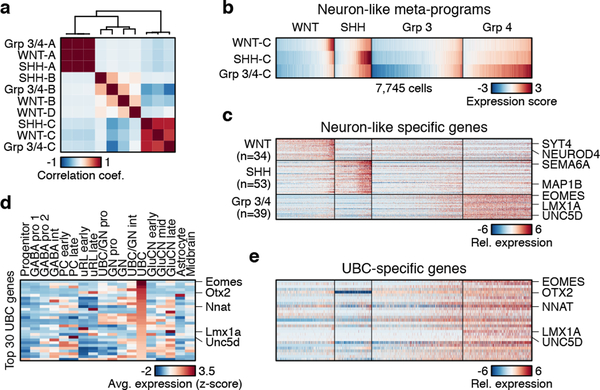
Medulloblastoma is a malignant childhood cerebellar tumour type that comprises distinct molecular subgroups. Whereas genomic characteristics of these subgroups are well defined, the extent to which cellular diversity underlies their divergent biology and clinical behaviour remains largely unexplored. Here we used single-cell transcriptomics to investigate intra- and intertumoral heterogeneity in 25 medulloblastomas spanning all molecular subgroups. WNT, SHH and Group 3 tumours comprised subgroup-specific undifferentiated and differentiated neuronal-like malignant populations, whereas Group 4 tumours consisted exclusively of differentiated neuronal-like neoplastic cells. SHH tumours closely resembled granule neurons of varying differentiation states that correlated with patient age. Group 3 and Group 4 tumours exhibited a developmental trajectory from primitive progenitor-like to more mature neuronal-like cells, the relative proportions of which distinguished these subgroups. Cross-species transcriptomics defined distinct glutamatergic populations as putative cells-of-origin for SHH and Group 4 subtypes. Collectively, these data provide insights into the cellular and developmental states underlying subtype-specific medulloblastoma biology.


Figures

ED Figure 1 |
ED Figure 1 |. Characteristics of the MB single-cell cohort.
a, Hematoxylin and eosin stained sections from all St. Jude single-cell samples (n=12). Tumours demonstrated large cell/anaplastic morphology (LCA, top), classic morphology (middle), or desmoplastic/nodular morphology (D/N, bottom). The scale bars represent 50 μm. b, Detailed characterization of the patient-derived xenograft (PDX) single-cell dataset. Subgroup prediction scores derived by DNA methylation profiling are indicated in the top panel (light shade: low probability, dark shade: high probability). The heatmap shows expression levels of previously described subgroup-specific marker genes in 946 PDX-derived single-cells. c, Heatmap shows expression levels of previously described subgroup-specific marker genes in 7,788 tumour-derived single-cells. d, Heatmaps show pairwise correlation of aggregated single-cell RNA-seq data (top) and bulk DNA methylation data (bottom) of all patient (n=25) and PDX (n=11) samples. For each PDX sample, the patient sample with the highest correlation coefficient is indicated by a black circle. e, Scatterplots show expression scores for published subgroup-specific gene sets for all single-cells in the patient cohort (n=7,788). Cells from WNT and SHH subgroups score only for their respective gene set. Some overlap is observed between cells from Group 3 and 4 subgroups and their respective gene sets, warranting the combined analysis of these subgroups in this study.
ED Figure 2 |
ED Figure 2 |. Copy-number analysis distinguishes malignant from non-malignant single-cells.
a-e, Heatmaps show single-cell RNA-seq-derived copy-number profiles of every cell in each sample (y-axis) along the genome (x-axis) for WNT (a), SHH (b), Group 3 (c) and Group 4 (d) patient MB as well as PDX (e). Copy-number profiles derived from array-based DNA methylation profiling from the same sample are shown above. Copy-number variations (CNVs) are observed in 21/25 patient tumor samples (all except MUV34, MUV41, SH577, and SJ625). Generally, we observe a high concordance between single-cell and DNA methylation array-derived copy number profiles. Genetic subclones at the level of broad copy-number changes are detected in samples SJ99 and BCH825. Cells without detected CNVs from samples that showed CNVs in the majority of cells (non-malignant cells; NM) are indicated for samples in which at least four non-malignant cells were detected (BCH807 and SJ454). Amplifications of the MYC and MYCN oncogenes detected by DNA methylation array are indicated.
ED Figure 3 |
ED Figure 3 |. Unsupervised clustering and detection of expressed SNVs in MB single-cells.
a, t-SNE visualization of the entire single-cell data set (n=8,924 cells). WNT (blue), SHH (red), Group 3 (yellow) and Group 4 (green) patient samples are indicated. Patient-derived xenograft (PDX) models are shown in pink. Non-neoplastic oligodendrocytes and immune cells are included for comparison. Generally malignant cells are expected to cluster by patient sample, whereas non-malignant cells are expected to cluster by cell type. Only few cells from different samples cluster with oligodendrocytes (n=22) or immune cells (n=6) and were classified as non-malignant. No additional clusters of cells from different samples were identified, indicating the absence of additional non-malignant cell populations in our dataset. b, Identical t-SNE visualization as in panel a, colored by copy-number state. CNVs were detected in most single-cells, facilitating their classification as malignant. A small number of cells did not show CNVs, even though CNVs were detected in the majority of cells from the respective sample (n=38). These cells were classified as non-malignant. Most cells with without CNVs clustered with normal oligodendrocytes (n=21), supporting their initial classification as non-malignant. Remaining cells without CNVs did not form clusters and likely represent poor quality cells. c, Identical t-SNE visualization as in panel (a), colored by detected mutant and wild-type transcripts. Cells classified as non-malignant are depleted for mutant transcripts (P < 0.01, Binomial test), supporting their initial classification. d, Heatmap shows detected mutant and wild-type transcripts for 39 variants (columns) in each cell (n=1,780, rows) of the WNT-MB dataset. If both mutant and wild-type transcripts are detected in a single cell, only the mutant transcript is shown. Variants were initially detected by genome sequencing and subsequently quantified in the scRNA-seq data. Sample BCH807 was not subjected to genome sequencing, and the CTNNB1 variant was manually detected by examining scRNA-seq alignments. Mutations are detected almost exclusively in single cells from samples in which they were detected by genome sequencing, illustrating the high specificity of single-cell variant detection. e, Heatmap shows mutant and wild-type transcripts for 15 variants in each cell (n=1,135, rows) of the SHH-MB dataset. Sample SJ454 was not subjected to genome sequencing, and the TP53 mutation was manually identified by examining scRNA-seq alignments. f, Heatmap shows mutant and wild-type transcripts for 28 variants in each cell (n=3,172, rows) of the Group 3/4-MB samples that were subjected to genome sequencing.
ED Figure 4 |
ED Figure 4 |. Single-cell mapping of murine cerebellar development.
a, b, c, Two-dimensional representation of the cerebellar (CB) single-cell RNA-seq data set by t-SNE. Each dot represents one cell. In (a), colors represent 13 different embryonic and early postnatal time points. In (b), colors indicate the differentiation score across the entire data set. In c, colors indicate cell types identified by Louvain clustering using the top 3,000 overdispersed genes. The main CB lineages were assigned based on published lineage markers. d, Annotation of 18 CB cell types based on the expression of lineage specific marker genes shown as violin plot. Violin plots represent kernel density estimation showing the distribution shape of the data. e, Lineage tree reconstruction using PAGA. The abstracted graph shows all cell types (nodes) as identified in panels (c) and (d). The size of the nodes is related to the number of cells in the defined cell type. The width of edges connecting cell types reflects the probability of the path. f, Radar plot showing CCA coefficients between each murine CB cell type and human MB subgroup single-cell RNA-seq.
ED Figure 5 |
ED Figure 5 |. Characterization of WNT-MB single-cell programs.
a, Expression scores for individual programs identified by unsupervised NMF analysis in each sample. Cells are ordered as in Figure 2a (n=1,780). Meta-programs WNT-A, WNT-B, WNT-C, and WNT-D were identified by hierarchical clustering of individual programs. b, Heatmaps show pairwise correlation (left), principal component analysis (PCA, center), and expression scores for NMF-derived meta-programs (right) for 301 cells from WNT-MB sample MUV44. The ordering of cells (rows) is maintained between the heatmaps. A two-dimensional representation of the same cells using t-SNE is shown on the far right (colored by expression scores for each meta-program). This analysis shows that the same programs and cell populations that are identified by the NMF analysis are also supported by PCA and t-SNE clustering. Furthermore, no additional programs and cell populations are identified (starting from PC5 components are less informative). c, Scatter plot shows isometric projection of average gene expression levels for cells with highest expression score for WNT-B (undifferentiated, proliferating), WNT-C (neuron-like), or WNT-D (undifferentiated, post-mitotic). WNT-B meta-program genes are indicated in red, WNT-C meta-program genes are indicated in green, and WNT-D meta-program genes are indicated in blue. Genes that are higher in both undifferentiated cell populations compared to neuron-like cells are indicated in black. d, Images show RNA in-situ hybridization experiments of five marker genes representative for the four WNT-MB meta-programs in two samples of the single-cell cohort. Results confirm expression of these genes independently of the scRNA-seq experiments.
ED Figure 6 |
ED Figure 6 |. Characterization of SHH-MB single-cell programs.
a, Expression scores for individual programs identified by unsupervised NMF analysis in each sample. Cells are ordered as in Figure 3a (n=1,135). Meta-programs SHH-A, SHH-B, and SHH-C were identified by hierarchical clustering of individual programs. b, Heatmaps show pairwise correlation (left), principal component analysis (PCA, center), and expression scores for NMF-derived meta-programs (right) for 493 cells from SHH-MB sample SJ577. The ordering of cells (rows) is maintained between the heatmaps. A two-dimensional representation of the same cells using t-SNE is shown on the far right (colored by expression scores for each meta-program). This analysis shows that the same programs and cell populations that are identified by the NMF analysis are also supported by PCA and t-SNE clustering. Furthermore, no additional programs and cell populations are identified (starting from PC3 components are less informative). c, Pairwise correlations between the expression profiles of 303 single-cells (rows, columns) from two SHH PDX samples (RCMB18 and RCMB24) (left panel). Expression scores for each of the NMF-derived meta-programs SHH-A, SHH-B, and SHH-C (columns) (right panel). Cells are ordered as in the left panel (rows). d, Heatmaps show the relative expression of the 60 genes representing the meta-programs SHH-B and SHH-C (rows), across 303 cells for RCMB18 and RCMB24. Cells are sorted by the difference between the two scores. Cells positive for the cell cycle program (SHH-A) are indicated by red bars. Similar cell populations as in the primary samples (undifferentiated GNP-like and differentiated neuron-like cells) are identified in RCMB18. No differentiated cells are identified RCMB24.
ED Figure 7 |
ED Figure 7 |. Cross-species mapping of SHH-MB origins.
a, Heatmap shows average expression levels of 30 GNP associated genes (rows) in cell types identified in the mouse CB dataset (columns). Genes are ordered by their relative expression in GNPs. b, The left panel shows the relative expression of orthologous genes in panel (a) in all cells from the single-cell cohort (n=7,745; columns). Cells are ordered by increasing GNP CCA cosine correlation coefficients. Cells expressing high levels of GNP associated genes are predominantly from SHH tumours. The right panel shows the relative expression of the same genes in the bulk microarray cohort (n=392). c-d, Heatmaps as in panels (a) and (b), but showing genes associated with the UBC/Granule intermediate cell type. e, Two-dimensional representation of GNPs/granule neurons from the cerebellar atlas by t-SNE. Each dot represents one cell (n=35,013). Colors represent the assigned cerebellar cell types (left panel), as well as the expression of Atoh1 and Neurod1 (middle and right panel). f, Boxplots of select granule lineage marker genes in the murine CB cohort (left panel), MB single-cell cohort (middle panel), and MB bulk microarray cohort (right panel). g, Boxplot of patient age associated with infant and adult/child subtypes of SHH-MB. h, Boxplot of the number of coding mutations associated with SHH-MB subtypes. The median is shown as a thick line; box limits are 25th and 75th percentiles; whiskers denote 1.5 times the interquartile range. i, In situ expression of Barhl1 (left panel) and Pde1c (right panel) at P4 during CB development (images obtained from the Allen Brain Atlas). j, Radar plot showing the CCA cosine correlation coefficients between each murine CB cell type and the MB single-cell cohort from cells scoring highest for meta-programs SHH-B (GNP-like cells) and SHH-C (Granule neuron-like cells).
ED Figure 8 |
ED Figure 8 |. Characterization of Group 3/4-MB single-cell programs.
a, Top panel shows Group 3/4 subtype prediction scores derived by DNA methylation profiling (light shade: low probability, dark shade: high probability). Expression scores for individual programs identified by unsupervised NMF analysis in each sample are indicated in the lower panel. Cells are ordered as in Figure 4a (n=4,873). Meta-programs Group 3/4-A, Group 3/4-B, and Group 3/4-D were identified by hierarchical clustering of individual programs. b, Expression scores across 4,873 single cells (columns) for each of the NMF-derived meta-programs Group 3/4-A, Group 3/4-B, and Group 3/4-C (rows). Cells are ordered as in panel (a). c, Heatmaps show pairwise correlation (left), principal component analysis (PCA, center), and expression scores for NMF-derived meta-programs (right) for 400 cells from Group 3-MB sample SJ617. The ordering of cells (rows) is maintained between the heatmaps. A two-dimensional representation of the same cells using t-SNE is shown on the far right (colored by expression scores for each meta-program). This analysis shows that the same programs and cell populations that are identified by the NMF analysis are also supported by PCA and t-SNE clustering. Furthermore, no additional programs and cell populations are identified (starting from PC4 components are less informative). d, Pairwise correlations between the expression profiles of 643 single cells (rows, columns) from nine patient-derived xenograft models (Med114FH, Med2112FH, Med211FH, Med411FH, RCMB20, Icb1299, Icb1572, Med2312FH, DMB006). Left panel shows Group 3/4 subtype prediction scores derived by DNA methylation profiling. Expression score for the NMF-derived meta-programs Group 3/4-A, Group 3/4-B, and Group 3/4-C (columns) are indicated in the right panel. e, Heatmaps show the relative expression of the 60 genes representing the meta-programs Group 3/4-B and Group 3/4-C (rows) across 140 cells for RCMB20 and DMB006. Cells are sorted by the difference between the two scores. Cells positive for the cell cycle program (Group 3/4-A) are indicated by red bars. Group 3 PDX samples are predominantly undifferentiated, with the exception of Med2312FH which is predominantly differentiated (classified by DNA methylation array as intermediate Group 3/4 sample). This parallels the high frequency of MYC amplifications in our Group 3 PDX cohort (5/8). Group 4 PDX sample DMB006 is also predominantly differentiated. These results are supportive of the cellular compositions detected in primary Group 3/4 samples.
ED Figure 9 |
ED Figure 9 |. Analysis of Group 3/4 intermediate samples and pan-subgroup comparison.
a, Scatterplot of the meta-program Group 3/4-C (x-axis) and Group 3/4-B (y-axis) expression scores for Group 3 and Group 4 bulk MBs (n=248; yellow and green dots, respectively). Samples that score similarly for both programs are classified as intermediate samples (n=49) b, Representative MYC and TUJ1 (encoded by TUBB3) IHC images of seven Group 3/4 samples. Four of these samples are shown at higher magnification in Figure 5b (SJ17, SJ617, SJ625, SJ723). c, Two-dimensional representation of 740 Group 3/4 MB samples analyzed by DNA methylation profiling using t-SNE. Eight subtypes are delineated by curved lines. Samples are colored by their predicted subgroup. d, Heatmap showing expression of transcripts coding for ribosomal proteins (n=75, rows). Cells positive for the cell cycle programs, and cells classified as neuron-like cells are indicated on top. Cells are ordered as in Figure 6b (n=7,745). e, Heatmap showing relative expression levels of genes that are specific to neuron-like cells and are shared between multiple subgroups (n=134, rows). Cells are ordered as in panel (e). f, Heatmap shows the relative expression of UBC-specific genes in Figure 6d (n=30; rows) in the bulk expression array cohort (n=392; columns). Samples are ordered by increasing CCA cosine correlation coefficient.
ED Figure 10 |
ED Figure 10 |. Cross-species mapping of Group 4-MB origins.
a, Top panel shows expression of TBR1 and EOMES in bulk Group 4-MB expression array data (n=149). Middle panel shows Group 3/4 DNA methylation-based subtype annotations for each sample. Bottom panel shows CCA scores from comparison of bulk MB expression data and UBCs and GluCN late populations from the cerebellar single-cell dataset. b, t-SNE visualization shows clustering of glutamatergic populations correlated with Group 4 MBs. c, Boxplot of CCA cosine correlation coefficients from comparison of bulk MB expression data and UBCs, according to Group 3/4 subtypes. The median is shown as a thick line; box limits are 25th and 75th percentiles; whiskers denote 1.5 times the interquartile range. d, e, Left panels show ISH data obtained from the Allen Brain Atlas for Tbr1 (d) and Eomes (e) in the developing murine cerebellum at the indicated time point. Right panels show the expression of Tbr1 (d) and Eomes (e) in the murine single-cell dataset according to the t-SNE structure shown in (b). f, Radar plot showing CCA cosine correlation coefficients between each murine CB cell type and Group 3-MB (upper panel) or Group 4-MB (lower panel) cells scoring highest for meta-programs Group 3/4-B or Group 3/4-C. g, Graphical summary of subgroup-specific cellular hierarchies identified in MB.
Figure 1 |
Figure 1 |. Integrated analysis of MB and cerebellar single-cell transcriptomes.
a, Summary of human MB and developing murine cerebellar scRNA-seq datasets. b, Clinical and molecular details of the MB single-cell cohort. Asterisks indicate recurrent MB samples (n=2/25). Samples subjected to whole-genome (G) or whole-exome (E) sequencing are indicated. c, t-SNE representation of the cerebellar scRNA-seq dataset. Colors represent assigned cerebellar cell types. d, Radar plot showing the CCA coefficients between each murine cerebellar cell type (n=18) and bulk human MB expression data. Asterisks indicate significant correlations (FDR corrected permutation test, P<0.05).
Figure 2 |
Figure 2 |. Intratumoural heterogeneity in WNT-MB.
a, Pairwise correlations between the expression profiles of all WNT-MB cells (n=1,780). Cells are ordered by hierarchical clustering within each sample or genetic subclone. NM, non-malignant. b, Single-cell derived CNVs by chromosome (columns). Cells are ordered as in panel (a). c, Mutant and wild-type transcripts detected in single cells. Cells are ordered as in panel (a). d, Relative expression of 90 genes representing WNT-MB meta-program (rows) across cells from MUV44 and SJ99. Cells positive for the cell cycle program (WNT-A) are indicated. e, Scatterplot of the WNT-C and WNT-D meta-program expression scores for all WNT-MB cells.
Figure 3 |
Figure 3 |. Age-associated developmental hierarchies in SHH-MB.
a, Pairwise correlations between the expression profiles of all SHH-MB cells (n=1,135). NM, non-malignant. b, Relative expression of 60 genes representing SHH-MB meta-program across cells from MUV41 and SJ577. Cells positive for the cell cycle program (SHH-A) are indicated. c, Scatterplot of the normalized SHH-B and SHH-C meta-program expression scores for all SHH-MB cells. d, CCA coefficients between SHH-MB single-cells and murine glutamatergic cell types. Cells are ordered as in panel (b). e, Patient age (upper panel), expression levels of ATOH1 and NEUROD1 (middle panel), and CCA coefficients between tumors and murine glutamatergic cell types (lower panel) for bulk SHH-MBs (n=100). f, Expression of Neurod1 (left panel) and Atoh1 (right panel) in the murine cerebellum (P4, postnatal day 4; data from the Allen Brain Atlas).
Figure 4 |
Figure 4 |. Malignant transcriptional programs within Group 3/4.
a, Pairwise correlations between the expression profiles of all Group 3/4-MB cells (n=4,873). NM, non-malignant. DNA Methylation-based subgroup prediction scores are indicated in the upper panel. b, Relative expression of 60 genes representing Group 3/4-MB meta-program from SJ617, MUV34, and BCH1031. Cells positive for the cell cycle program (Group 3/4-A) are indicated. c,d Scatterplots of the Group 3/4-B and Group 3/4-C meta-program expression scores for all Group 3 (c) and Group 4 (d) MB cells.
Figure 5 |
Figure 5 |. Cellular composition of Group 3/4-MBs.
a, Relative expression of 60 genes representing Group 3/4-MB meta-programs across bulk Group 3/4-MBs. DNA Methylation-based subgroup prediction scores are indicated in the lower panel. b, DNA Methylation-based subgroup prediction scores (top panel) and relative IHC-based expression levels of MYC and TUJ1 (encoded by TUBB3; middle panel) in 22 Group 3/4-MBs. Four representative IHC images are shown (bottom panel). c, t-SNE representation of bulk Group 3/4-MBs classified according to published DNA methylation subtypes, (n=740; left panel). Subtypes are delineated by curved lines. Samples are colored by differentiation state as defined in (a). Right panel shows quantification of undifferentiated, intermediate, or differentiated expression state per subtype. Asterisks indicate enrichment of intermediate samples (Fisher’s exact test, P<0.001).
Figure 6 |
Figure 6 |. Subgroup-specific transcriptional programs correlate with distinct neuronal lineages.
a, Pairwise correlation of expression scores of meta-programs defined separately in each subgroup and applied across cells from all subgroups. b, Expression scores for neuronal differentiation meta-programs across all cells (n=7,745). c, Relative expression levels of genes specific to neuron-like cells in different subgroups (n=126). Cells are ordered as in panel (b). d, Average expression levels of 30 UBC-associated genes (rows) in identified mouse cerebellar cell types (columns). Genes are ordered by their relative expression in UBCs. e, Relative expression of homologous genes in panel (d) in all cells from the MB single-cell cohort (columns). Cells are ordered as in panel (b).

References

    1. Gajjar AJ & Robinson GW Medulloblastoma-translating discoveries from the bench to the bedside. Nat Rev Clin Oncol 11, 714–722, doi:10.1038/nrclinonc.2014.181 (2014). - DOI - PubMed
    1. Taylor MD et al. Molecular subgroups of medulloblastoma: the current consensus. Acta Neuropathol 123, 465–472, doi:10.1007/s00401-011-0922-z (2012). - DOI - PMC - PubMed
    1. Northcott PA et al. The whole-genome landscape of medulloblastoma subtypes. Nature 547, 311–317, doi:10.1038/nature22973 (2017). - DOI - PMC - PubMed
    1. Lin CY et al. Active medulloblastoma enhancers reveal subgroup-specific cellular origins. Nature 530, 57–62, doi:10.1038/nature16546 (2016). - DOI - PMC - PubMed
    1. Hovestadt V et al. Decoding the regulatory landscape of medulloblastoma using DNA methylation sequencing. Nature 510, 537–541, doi:10.1038/nature13268 (2014). - DOI - PubMed

Publication types

MeSH terms