. 2019 Jul;107(4):1704-1719.
doi: 10.1111/1365-2745.13160. Epub 2019 Mar 25.

Relationships between plant traits, soil properties and carbon fluxes differ between monocultures and mixed communities in temperate grassland

Affiliations

Relationships between plant traits, soil properties and carbon fluxes differ between monocultures and mixed communities in temperate grassland

Jonathan R De Long et al. J Ecol. 2019 Jul.

Abstract

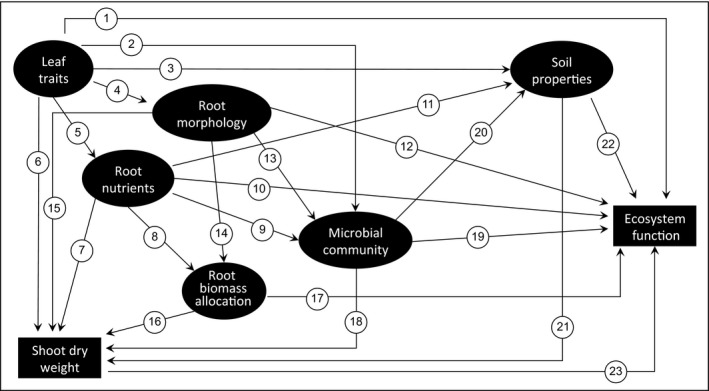
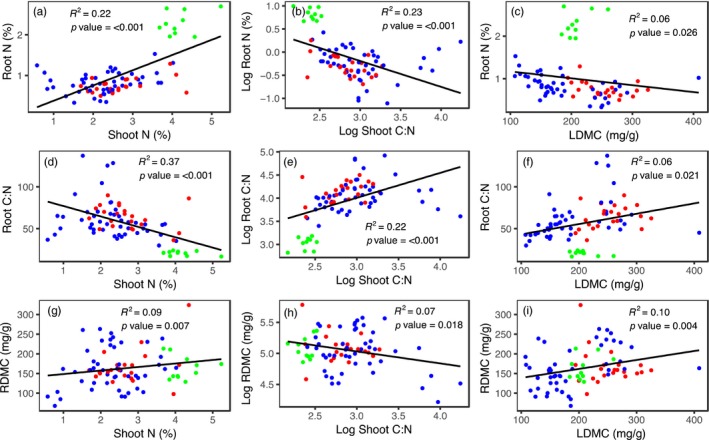
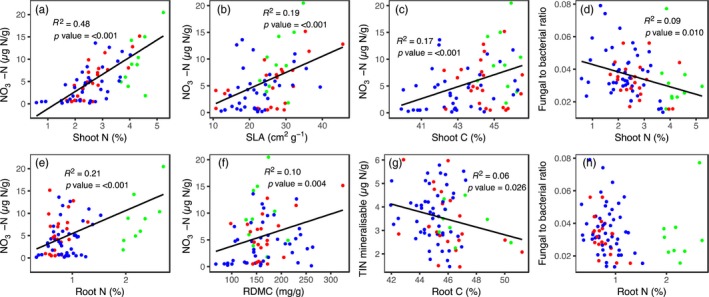
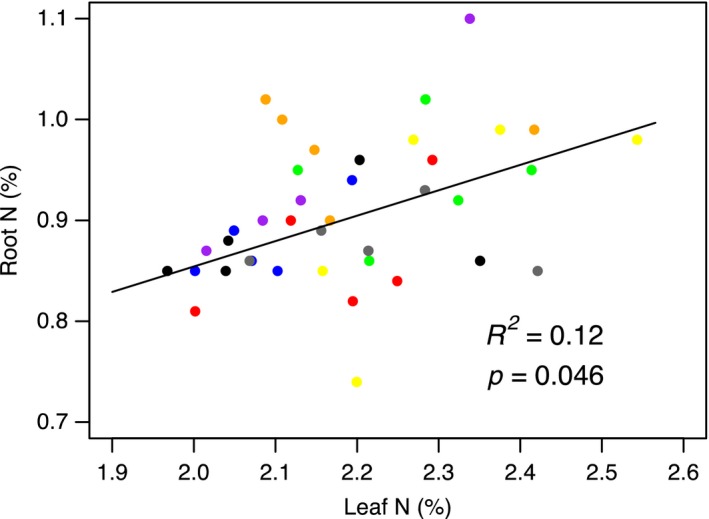
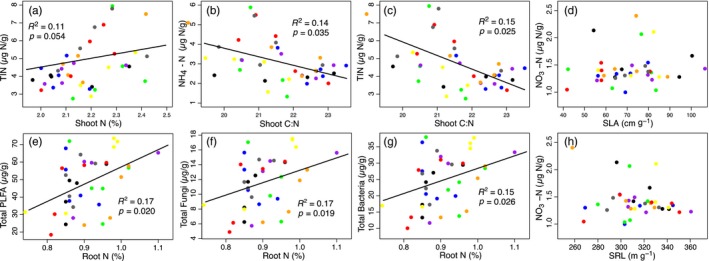
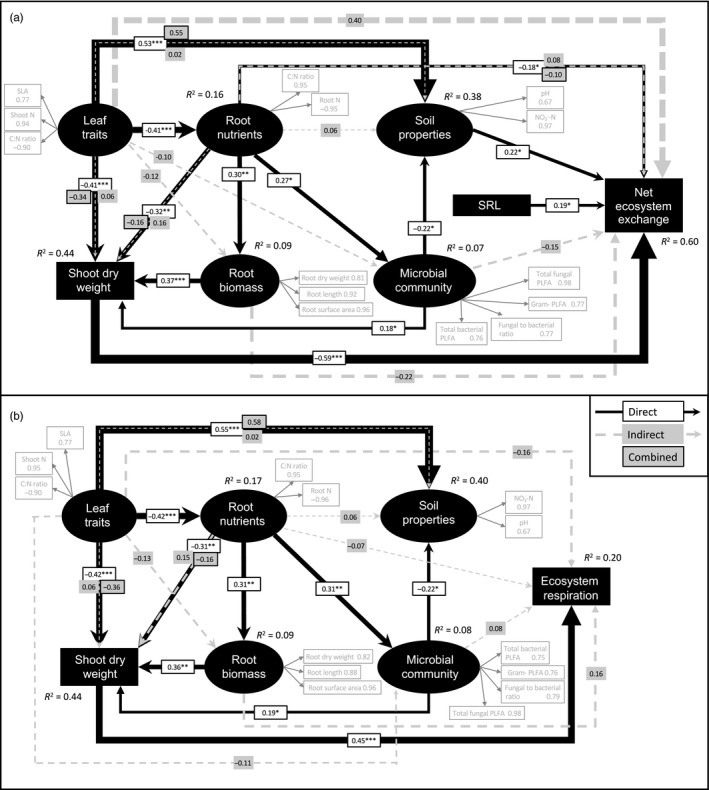
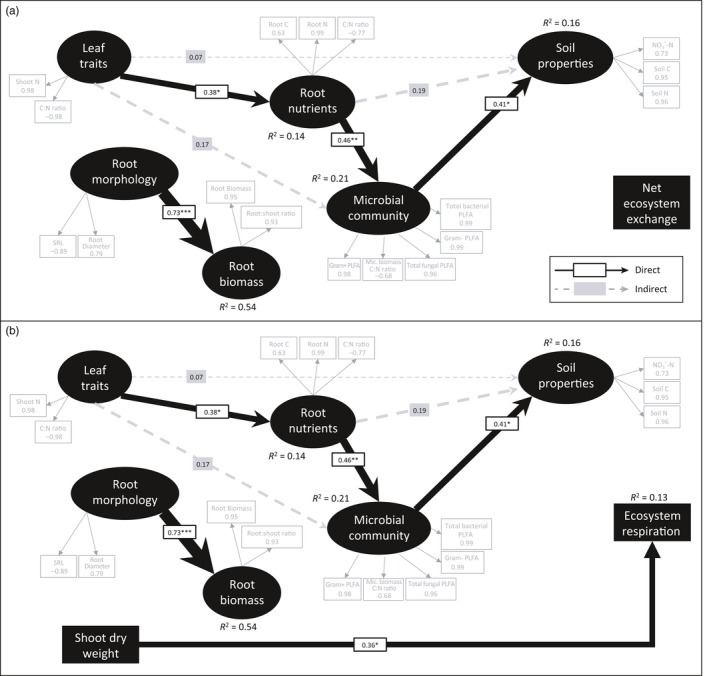
The use of plant traits to predict ecosystem functions has been gaining growing attention. Above-ground plant traits, such as leaf nitrogen (N) content and specific leaf area (SLA), have been shown to strongly relate to ecosystem productivity, respiration and nutrient cycling. Furthermore, increasing plant functional trait diversity has been suggested as a possible mechanism to increase ecosystem carbon (C) storage. However, it is uncertain whether below-ground plant traits can be predicted by above-ground traits, and if both above- and below-ground traits can be used to predict soil properties and ecosystem-level functions.Here, we used two adjacent field experiments in temperate grassland to investigate if above- and below-ground plant traits are related, and whether relationships between plant traits, soil properties and ecosystem C fluxes (i.e. ecosystem respiration and net ecosystem exchange) measured in potted monocultures could be detected in mixed field communities.We found that certain shoot traits (e.g. shoot N and C, and leaf dry matter content) were related to root traits (e.g. root N, root C:N and root dry matter content) in monocultures, but such relationships were either weak or not detected in mixed communities. Some relationships between plant traits (i.e. shoot N, root N and/or shoot C:N) and soil properties (i.e. inorganic N availability and microbial community structure) were similar in monocultures and mixed communities, but they were more strongly linked to shoot traits in monocultures and root traits in mixed communities. Structural equation modelling showed that above- and below-ground traits and soil properties improved predictions of ecosystem C fluxes in monocultures, but not in mixed communities on the basis of community-weighted mean traits. Synthesis. Our results from a single grassland habitat detected relationships in monocultures between above- and below-ground plant traits, and between plant traits, soil properties and ecosystem C fluxes. However, these relationships were generally weaker or different in mixed communities. Our results demonstrate that while plant traits can be used to predict certain soil properties and ecosystem functions in monocultures, they are less effective for predicting how changes in plant species composition influence ecosystem functions in mixed communities.

Keywords: above‐ground–below‐ground linkages; biodiversity; carbon; ecosystem function; net ecosystem exchange; nitrogen; plant functional traits; soil microbial communities.


Figures

Figure 1
Figure 1
A priori path model for ecosystem carbon fluxes in the monoculture and community experiments. Arrows indicate causal directed relationships between latent variables (LVs) (ellipses). LVs reflected by only one measured variable are shown as boxes. Leaf economic traits, in particular leaf N content, scale with plant photosynthetic and respiratory capacity (1) (Reich, 2014), while root economic and architectural traits may contribute to the partitioning of C below‐ground affecting soil respiration (10, 12) (De Deyn et al., 2008). Leaf and root traits often show coordinated variation in stoichiometry and tissue density (5) (Freschet et al., 2010), but traits relating to root morphology can be a secondary, and potentially independent dimension of root trait variation (4) (Kramer‐Walter et al., 2016) as we observed in this study (see Figure S2). The fast–slow spectrum can drive relative growth rates (6, 7, 8) (Reich, 2014; Wright et al., 2004) and root morphology may drive patterns of C allocation above‐ and below‐ground (14, 15) (Guyonnet et al., 2018; Lange et al., 2015) and thus collectively standing biomass above‐ and below‐ground, while relative investment of growth above‐ versus below‐ground can drive root to shoot ratios (16) (Kimball et al., 2016). The fast–slow leaf spectrum can drive the relative importance of fungal versus bacterial dominated energy channels below‐ground (2, 9) (Legay et al., 2014), while patterns of plant C allocation below‐ground in terms of root length and root diameter may impact on root colonization rates and patterns of C exudation with consequences for microbial community structure (13) (Lange et al., 2015). The fast–slow spectrum of trait variation (3, 11) (Reich, 2014; Wright et al., 2004) and the stoichiometry and structure of the microbial community (20) (de Vries & Bardgett, 2016; de Vries et al., 2012) can influence soil carbon and nitrogen stocks, inorganic and organic nitrogen availability and mineralization rates, which in turn can impact carbon allocation below‐ground (18) (De Deyn et al., 2008), plant growth rates and biomass accumulation (21) (Reich, 2014; Wright et al., 2004). Plant above‐ground biomass can drive both photosynthetic and respiratory rates above‐ground (23) (Grigulis et al., 2013; Reich, 2014; Wright et al., 2004), while below‐ground plant biomass allocation and the stoichiometry and structure of the microbial community can influence below‐ground respiration rates (17, 19) (Grigulis et al., 2013; Roumet et al., 2016). Soil C and N stocks, inorganic and organic N availability and mineralization rates can influence rates of biological activity in soil and thus below‐ground respiration rates (22) (Grigulis et al., 2013)
Figure 2
Figure 2
Relationships between selected shoot and root traits of 25 temperate grassland species grown in monoculture under field conditions (a‐i). Plant functional groups are shown as red = grass, blue = forb and green = legume. Full regression matrix of relationships between shoot and root traits for the monoculture experiment is shown in Table S7 [Colour figure can be viewed at wileyonlinelibrary.com]
Figure 3
Figure 3
Relationships between shoot and root traits with selected soil properties of 25 temperate grassland species grown in monoculture under field conditions (a‐h). Plant functional groups are shown as red = grass, blue = forb and green = legume. SLA—specific leaf area, RDMC—root dry matter content, TIN—total inorganic nitrogen (NO3‐N and NH4‐N). Full regression matrix of relationships between plant traits and soil properties for the monoculture experiment is shown in Table S8 [Colour figure can be viewed at wileyonlinelibrary.com]
Figure 4
Figure 4
Relationship between community‐weighted mean shoot N and root N from the 40 mixed community plots. Treatments are shown as black = control, red = grasses, blue = forbs, green = legumes, purple = grasses + forbs, orange = grasses + legumes, yellow = forbs + legumes, grey = grasses + forbs + legumes. Full regression matrix of shoot traits and root trait relationships is shown in Table S9 [Colour figure can be viewed at wileyonlinelibrary.com]
Figure 5
Figure 5
Relationships between leaf and root traits with selected soil properties in the 40 mixed community plots (a‐h). Treatments are shown as black = control, red = grasses, blue = forbs, green = legumes, purple = grasses + forbs, orange = grasses + legumes, yellow = forbs + legumes, grey = grasses + forbs + legumes. SRL TIN—total inorganic nitrogen (NO3‐N and NH4‐N). Full regression matrix of trait—soil relationships is shown in Table S10 [Colour figure can be viewed at wileyonlinelibrary.com]
Figure 6
Figure 6
Partial least‐squares path models showing the relationships between leaf and root traits, soil properties, microbial community attributes, above‐ground biomass and (a) net ecosystem exchange (GoF index 0.470) and (b) ecosystem respiration (GoF index 0.418) in monocultures of 25 temperate grassland species. Reflective LVs (black ovals) are indicated by measured variables (grey boxes) with their respective loadings shown. The width of the arrows indicates the strength of the causal relationships supplemented by standardized path coefficients (*p < 0.05; **p < 0.01; ***p < 0.001). R 2 values indicate the explained variance of response variables. To meet the requirements of unidimensionality, the indicator variables in (a) shoot C:N, root N and net ecosystem exchange, and in (b) shoot C:N and root N were multiplied by negative one. See Methods S1 for details on model selection procedure
Figure 7
Figure 7
Partial least‐squares path models showing the relationships between leaf and root traits, soil properties, microbial community attributes, above‐ground biomass and (a) net ecosystem exchange (GoF index 0.4623) and (b) ecosystem respiration (GoF index 0.4383) in mixed grassland communities. Reflective LVs (black ovals) are indicated by measured variables (grey boxes) with their respective loadings shown. The width of the arrows indicates the strength of the causal relationships supplemented by standardized path coefficients (*p < 0.05; **p < 0.01; ***p < 0.001). R 2 values indicate the explained variance of response variables. To meet the requirements of unidimensionality, the indicator variables in (a) shoot C:N, root C:N and microbial C:N and in (b) shoot C:N, root C, microbial C:N and total bacterial PLFA were multiplied by negative one. See Methods S1 for details on model selection procedure

References

    1. Albert, C. H. , Grassein, F. , Schurr, F. M. , Vieilledent, G. , & Violle, C. (2011). When and how should intraspecific variability be considered in trait‐based plant ecology? Perspectives in Plant Ecology Evolution and Systematics, 13, 217–225.
    1. Bardgett, R. D. (2017). Plant trait‐based approaches for interrogating belowground function. Biology and Environment . Proceedings of the Royal Irish Academy, 117B, 1–13.
    1. Bardgett, R. D. , & McAlister, E. (1999). The measurement of soil fungal: Bacterial biomass ratios as an indicator of ecosystem self‐regulation in temperate meadow grasslands. Biology and Fertility of Soils, 29, 282–290. 10.1007/s003740050554 - DOI
    1. Bardgett, R. D. , Mommer, L. , & De Vries, F. T. (2014). Going underground: Root traits as drivers of ecosystem processes. Trends in Ecology & Evolution, 29, 692–699. 10.1016/j.tree.2014.10.006 - DOI - PubMed
    1. Bardgett, R. D. , Smith, R. S. , Shiel, R. S. , Peacock, S. , Simkin, J. M. , Quirk, H. , & Hobbs, P. J. (2006). Parasitic plants indirectly regulate below‐ground properties in grassland ecosystems. Nature, 439, 969–972. 10.1038/nature04197 - DOI - PubMed

LinkOut - more resources