. 2019 Jul;26(3):545-560.
doi: 10.1656/045.026.0307. Epub 2019 Jul 24.

The Density of the Lyme Disease Vector, Ixodes scapularis (Blacklegged Tick), Differs Between the Champlain Valley and Green Mountains, Vermont

Affiliations

The Density of the Lyme Disease Vector, Ixodes scapularis (Blacklegged Tick), Differs Between the Champlain Valley and Green Mountains, Vermont

David Allen et al. Northeast Nat (Steuben). 2019 Jul.

Abstract

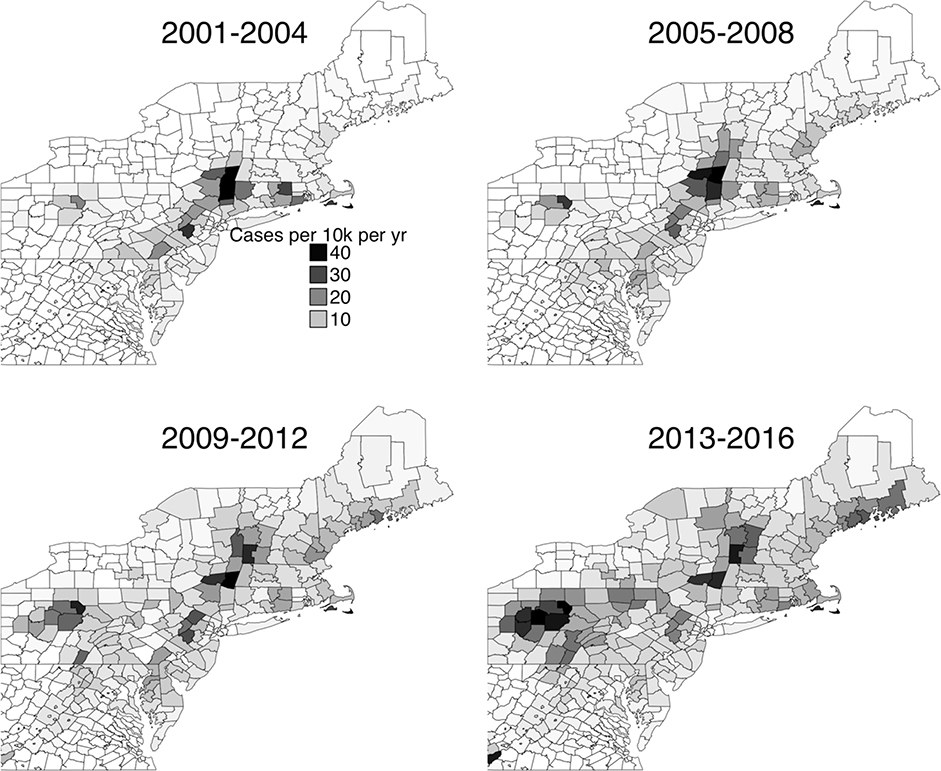
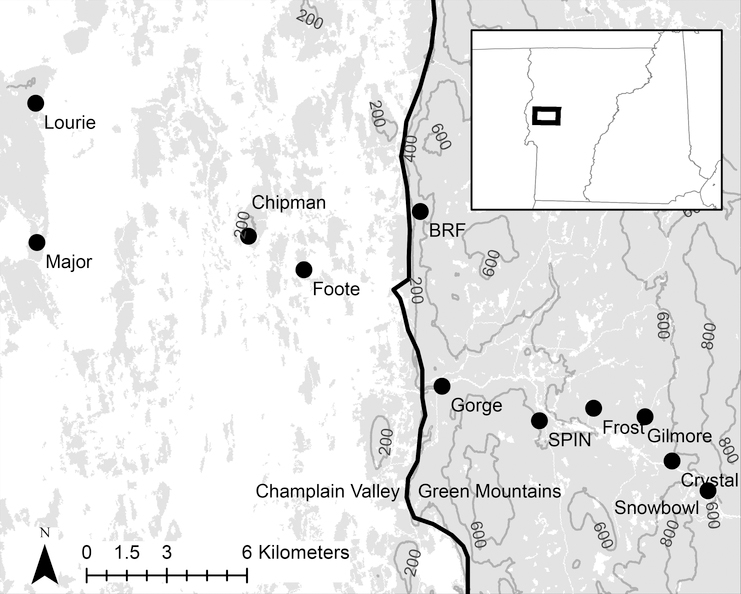
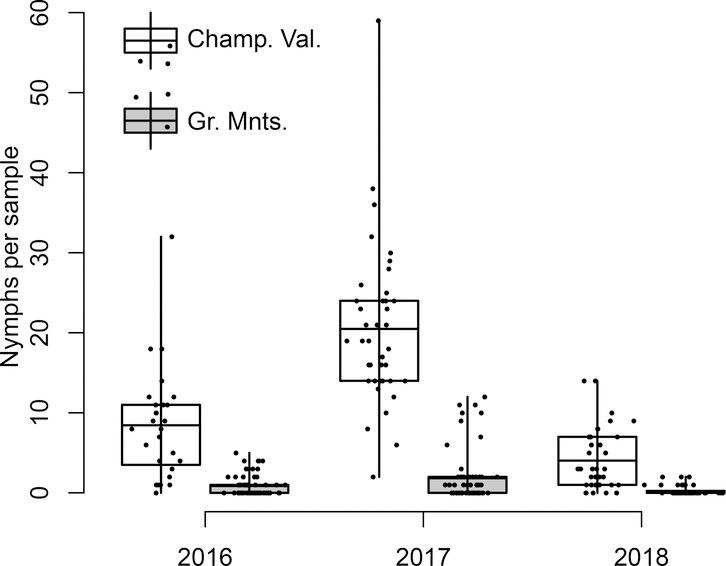
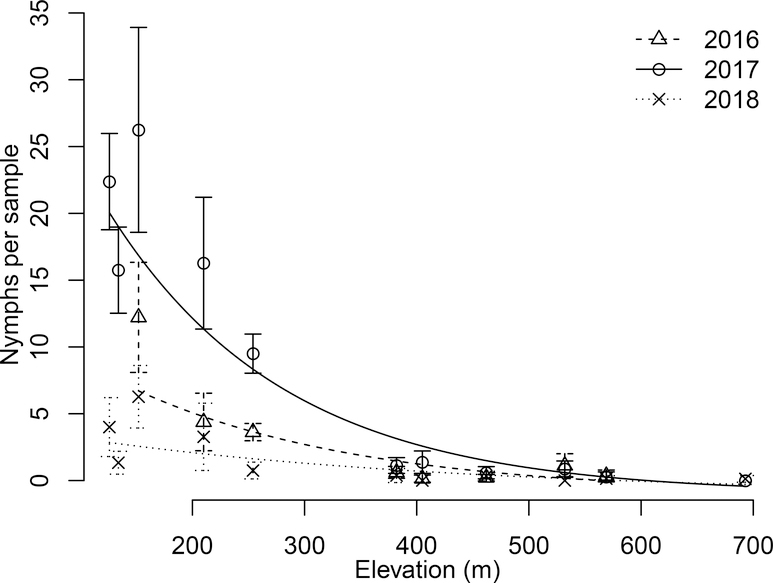
Lyme disease is an emerging infectious disease of public health concern in the northeastern United States. The disease's vector, Ixodes scapularis (Say) (Blacklegged Tick), has increased its range in the past twenty years. In its newly endemic northern range there have been few studies of the Blacklegged Tick's habitat associations. From 2016-2018, we sampled for nymphal Blacklegged Ticks in the Champlain Valley and Green Mountains of Addison County, Vermont, and tested them for Borrelia burgdorferi, the Lyme disease agent. We found 10 times more ticks in the Champlain Valley than in the Green Mountains. Nymphal infection prevalence was 0.21 and did not vary by year or region. The difference in tick density reported has public health consequences, as Vermont has one of the highest rates of Lyme disease in the United States.


Figures

Figure 1:
Figure 1:
County level incidence map of Lyme diseases cases reported to the CDC. Each subgraph gives the average annual number of cases per 10,0000 people over the four-year period. Lyme disease case numbers from the CDC (2018). Annual county population estimates from the US Census Bureau (2018a, 2018b).
Figure 2:
Figure 2:
Map of the sampling sites in this study. The locations of the 11 sites are indicated by the black dots, at each site there were 2–3 plots. The gray area in the map is forest (either deciduous forest, evergreen forest or mixed forest) and the white area is any other land cover type. Land cover classification from the National Land Cover Database 2011 (Homer et al. 2015). The thick black line represents the boundary between the Champlain Valley and Green Mountains (EPA 2018). Contour lines show elevation above sea level in meters. Inset map shows study area in regional context.
Figure 3:
Figure 3:
Density of questing nymphal ticks per 200 m2 drag sample between May 15 and July 15. The graph compares the Champlain Valley (white rectangles) to the Green Mountains (gray rectangles) across the three years of the study. The box and whiskers show the mean (horizontal line), two interquartiles (boxes) and full data range (whiskers). Plotted over the box and whiskers are the raw data with an x-axis jitter for clarity.
Figure 4:
Figure 4:
Density of questing nymphal ticks per 200 m2 drag sample between May 15 and July 15 as a function of site elevation. The error bars indicate the standard error around each mean. For each year we performed a simple linear regression between log tick density plus one and elevation. We took the inverse of the transformation to plot untransformed tick density, so these lines became negative exponential curves. Each linear relationship was significant: 2016 F1,6 = 16.4, p = 0.007; 2017 F1,8 = 92.0, p = 0.000005; and 2018 F1,9 = 17.9 p = 0.002.

References

    1. Allan BF, Keesing F, and Ostfeld RS. 2003. Effect of forest fragmentation on Lyme disease risk. Conservation Biology 17:267–272.
    1. Ammazzalorso AD, Zolnik CP, Daniels TJ, and Kolokotronis S-O. 2015. To beat or not to beat a tick: comparison of DNA extraction methods for ticks (Ixodes scapularis). PeerJ 3:e1147. - PMC - PubMed
    1. Andrén H 1994. Effects of habitat fragmentation on birds and mammals with different proportions of suitable habitat: a review. Oikos 71:355–366.
    1. Barbour AG and Fish D. 1993. The biological and social phenomenon of Lyme disease. Science 260:1610–1616. - PubMed
    1. Bates D, Mächler M, Bolker B, and Walker S. 2015. Fitting linear mixed-effects models using lme4. Journal of Statistical Software 67:1–48.

LinkOut - more resources