. 2019 Jul 17:4:10.
doi: 10.1038/s41539-019-0050-4. eCollection 2019.

Quantifying two-dimensional and three-dimensional stereoscopic learning in anatomy using electroencephalography

Affiliations

Quantifying two-dimensional and three-dimensional stereoscopic learning in anatomy using electroencephalography

Sarah J Anderson et al. NPJ Sci Learn. .

Abstract

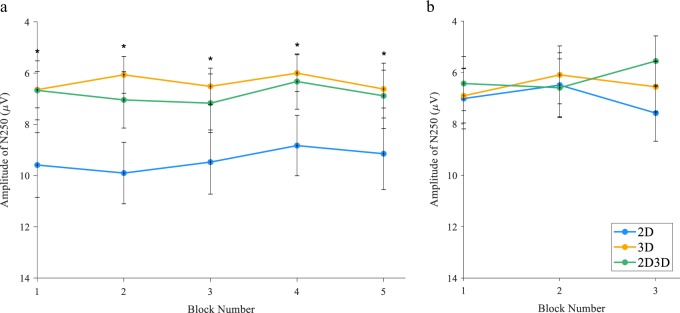
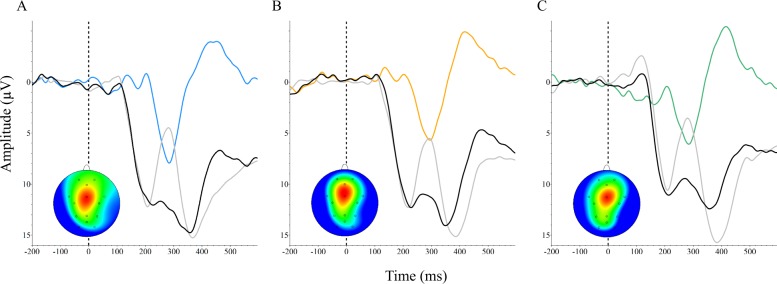
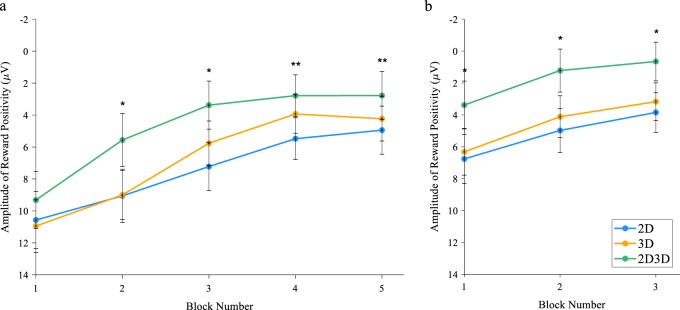
Advances in computer visualization enabling both 2D and 3D representation have generated tools to aid perception of spatial relationships and provide a new forum for instructional design. A key knowledge gap is the lack of understanding of how the brain neurobiologically processes and learns from spatially presented content, and new quantitative variables are required to address this gap. The objective of this study was to apply quantitative neural measures derived from electroencephalography (EEG) to examine stereopsis in anatomy learning by comparing mean amplitude changes in N250 (related to object recognition) and reward positivity (related to responding to feedback) event related to potential components using a reinforcement-based learning paradigm. Health sciences students (n = 61) learned to identify and localize neuroanatomical structures using 2D, 3D, or a combination of models while EEG and behavioral (accuracy) data were recorded. Participants learning using 3D models had a greater object recognition (N250 amplitude) compared to those who learned from 2D models. Based on neurological results, interleaved learning incorporating both 2D and 3D models provided an advantage in learning, retention, and transfer activities represented by decreased reward positivity amplitude. Behavioral data did not have the same sensitivity as neural data for distinguishing differences in learning with and without stereopsis in these learning activities. Measuring neural activity reveals new insights in applied settings for educators to consider when incorporating stereoscopic models in the design of learning interventions.

Keywords: Education; Learning and memory; Operant learning; Perception.


Conflict of interest statement

Competing interestsThe authors declare no competing interests.

Figures

Fig. 1
Fig. 1
Learning curves showing changes in mean accuracy performance for each block of the modules for all participants. a Module 1. b Module 2. Error bars indicate ±1 standard deviation
Fig. 2
Fig. 2
Grand averaged N250 amplitude measured at O1 between 240 and 340 ms. Negative is plotted up. a Module 1. b Module 2. Asterisk indicates when N250 amplitude in the 3D and 2D/3D groups was significantly more negative (p < 0.05, RM_ANOVA, LSD post hoc) compared to the 2D group. Error bars indicate ±95% confidence interval
Fig. 3
Fig. 3
Grand averaged reward positivity ERP waveforms for each group. The ERP waveforms measured at FCz indicate response to correct feedback (black), response to incorrect feedback (light gray), and the difference waveform (colored) and associated scalp distributions calculated by subtracting response to incorrect feedback from correct feedback. Negative is plotted up. a 2D. b 3D. c 2D/3D
Fig. 4
Fig. 4
Grand averaged reward positivity ERP amplitude at FCz in response to correct accuracy feedback across all blocks. Negative is plotted up. a Module 1. b Module 2. Error bars indicate ±95% confidence interval. Asterisk indicates when reward positivity amplitude was significantly more negative in the 2D/3D group than the 2D and 3D groups (p < 0.05, RM_ANOVA, LSD post hoc). Double asterisks indicate when reward positivity amplitude was significantly more negative in the 2D/3D group than the 2D group (p < 0.05, RM_ANOVA, LSD post hoc)

References

    1. Cook DA, et al. Comparative effectiveness of instructional design features in simulation-based education: systematic review and meta-analysis. Med. Teach. 2013;35:E844–E875. doi: 10.3109/0142159X.2013.827328. - DOI - PubMed
    1. Cook DA. The failure of e-learning research to inform educational practice, and what we can do about it. Med. Teach. 2009;31:158–162. doi: 10.1080/01421590802691393. - DOI - PubMed
    1. Donnelly L, Patten D, White P, Finn G. Virtual human dissector as a learning tool for studying cross-sectional anatomy. Med. Teach. 2009;31:553–555. doi: 10.1080/01421590802512953. - DOI - PubMed
    1. Ruisoto P, Juanes JA, Contador I, Mayoral P, Prats-Galino A. Experimental evidence for improved neuroimaging interpretation using three-dimensional graphic models. Anat. Sci. Educ. 2012;5:132–137. doi: 10.1002/ase.1275. - DOI - PubMed
    1. Cook DA, McDonald FS. Is there anything special about the “e”? Perspect. Biol. Med. 2008;51:5–21. doi: 10.1353/pbm.2008.0007. - DOI - PubMed