. 2019 Jul 12:20:100487.
doi: 10.1016/j.ymgmr.2019.100487. eCollection 2019 Sep.

The characterisation of pulmonary function in patients with mucopolysaccharidoses IVA: A longitudinal analysis

Affiliations

The characterisation of pulmonary function in patients with mucopolysaccharidoses IVA: A longitudinal analysis

Johnny J Kenth et al. Mol Genet Metab Rep. .

Abstract

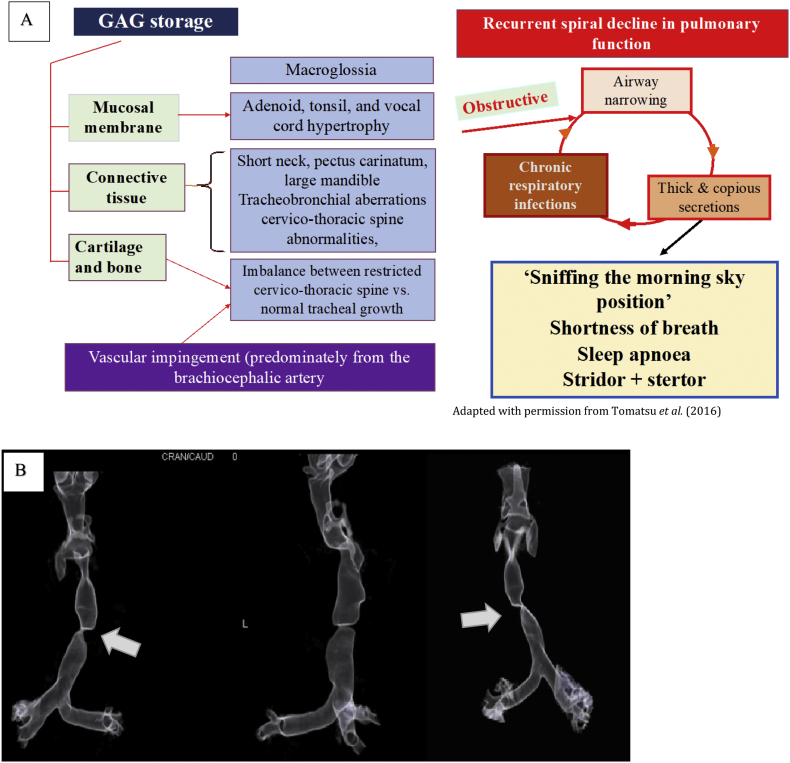
Introduction: Mucopolysaccharidosis (MPS) type IVA is a rare, autosomal recessive lysosomal storage disease causing substrate accumulation in various organs and tissues. MPS IVA is associated with both obstructive and restrictive airway disease, with the former often resulting in sleep disordered breathing (SDB). Respiratory failure is a primary cause of death in this condition. The aim of this study was to characterise and catalogue the long-term respiratory changes in patients with MPS IVA treated with, or without, enzyme replacement therapy (ERT).

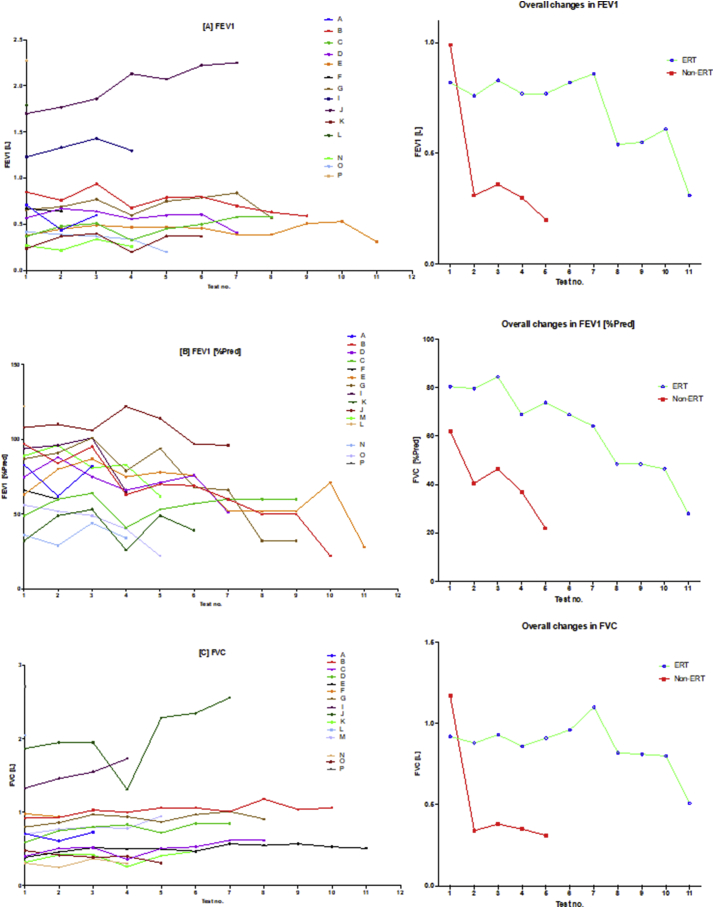
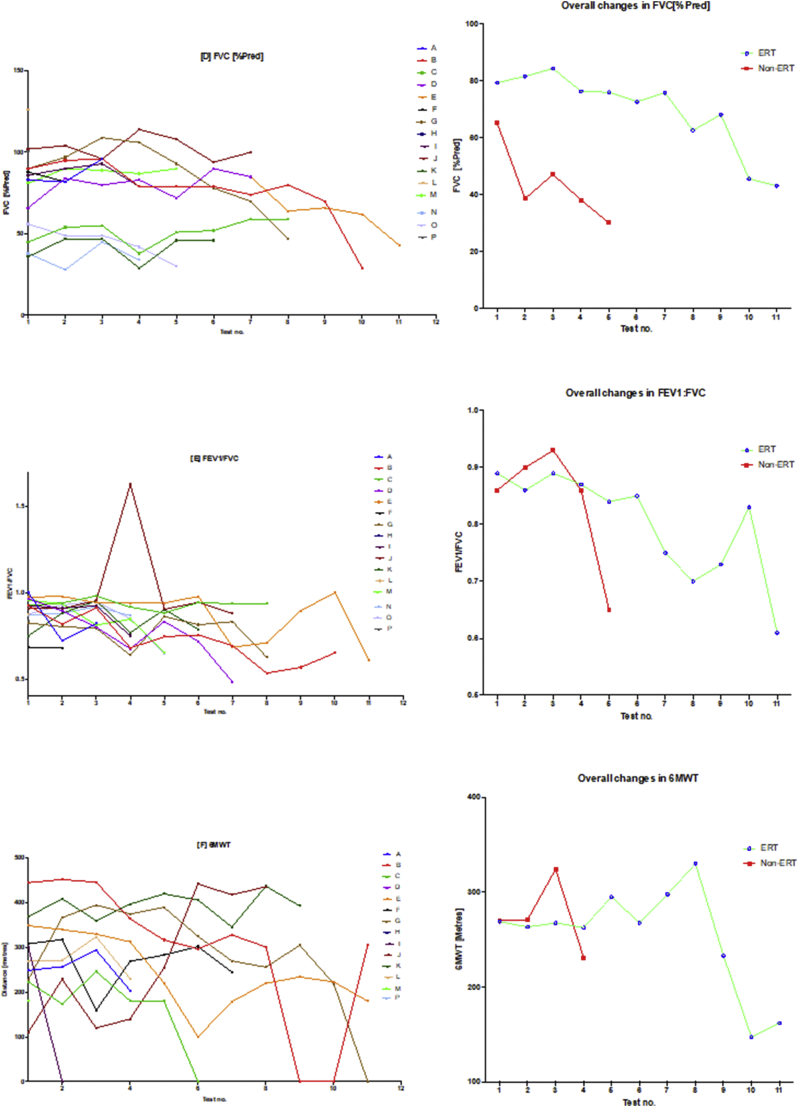
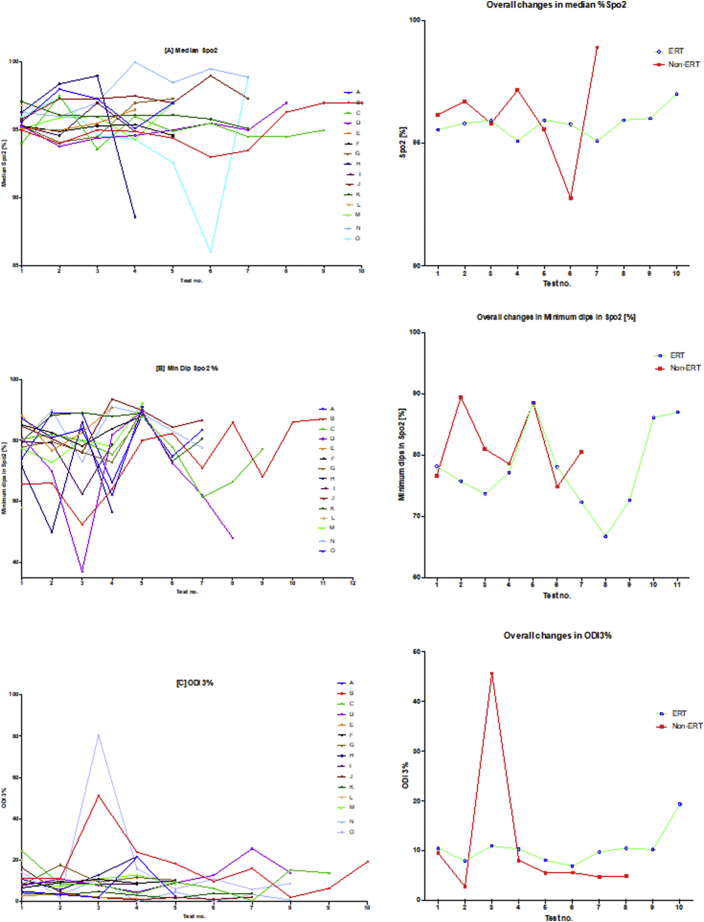
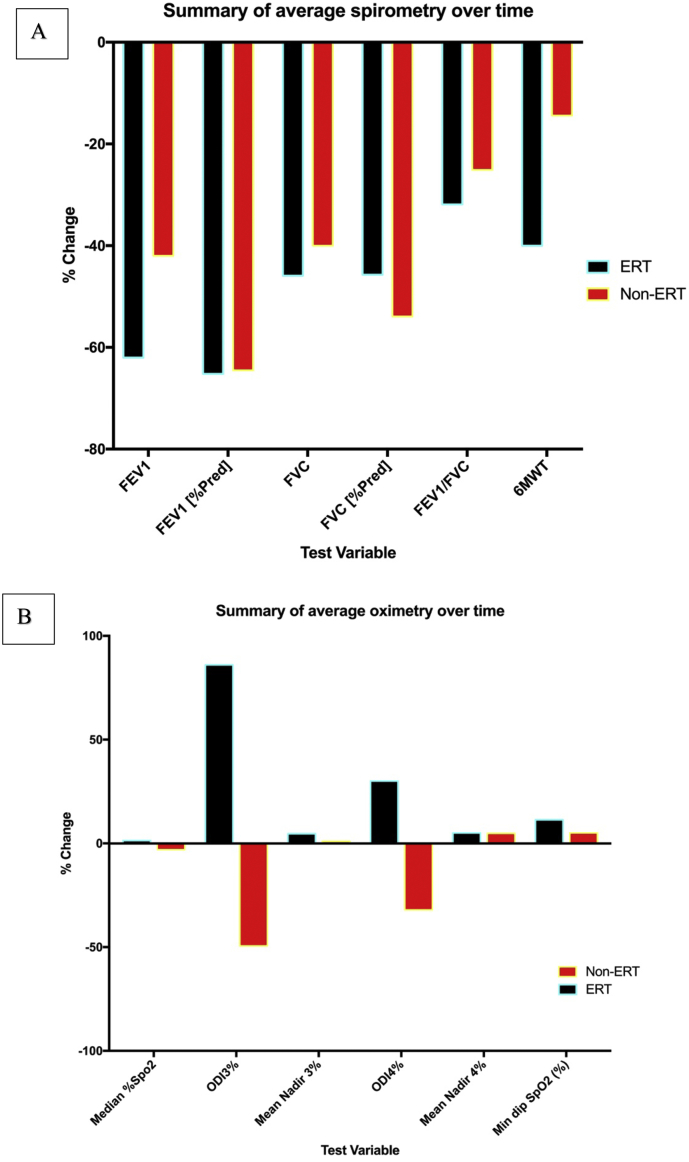
Methods: In this retrospective, longitudinal, repeated-measures cohort study, descriptive statistics and non-parametric correlation were performed for demographic, respiratory function and oximetry variables over a study period from January 2009 to December 2018. Composite clinical endpoints used in this study for evaluating pulmonary function included spirometry variables (FEV1, FEV1 [%Pred] FVC, FVC [%Pred] and FEV1/FVC), oximetry variables (median %Spo2, ODI 3%, mean nadir 3%, ODI 4%, mean nadir 4% and min dip SpO2 [%]) and 6MWT to assess functional exercise capacity and thus integrated cardiopulmonary function.

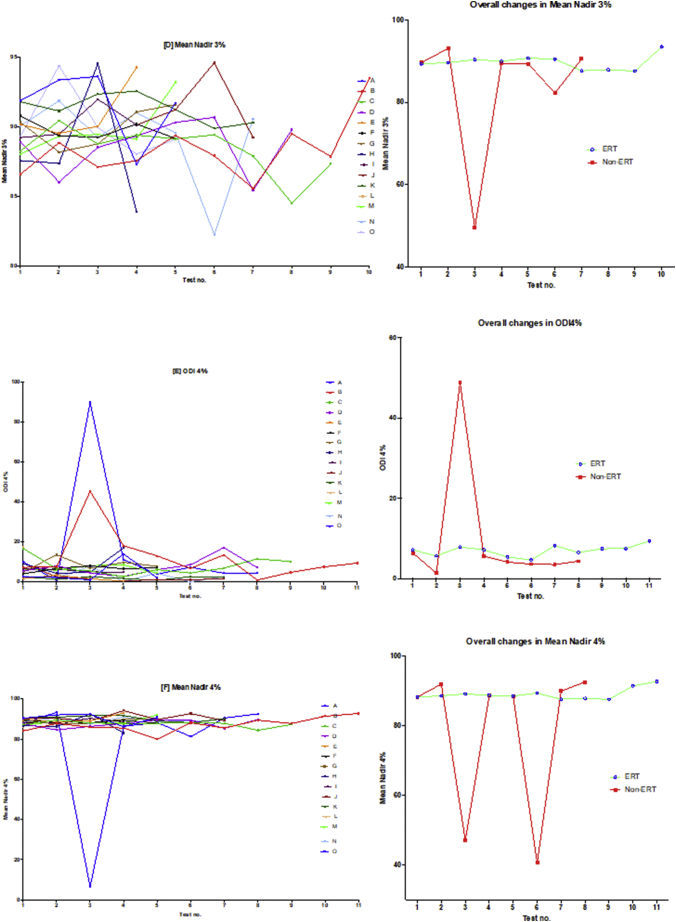
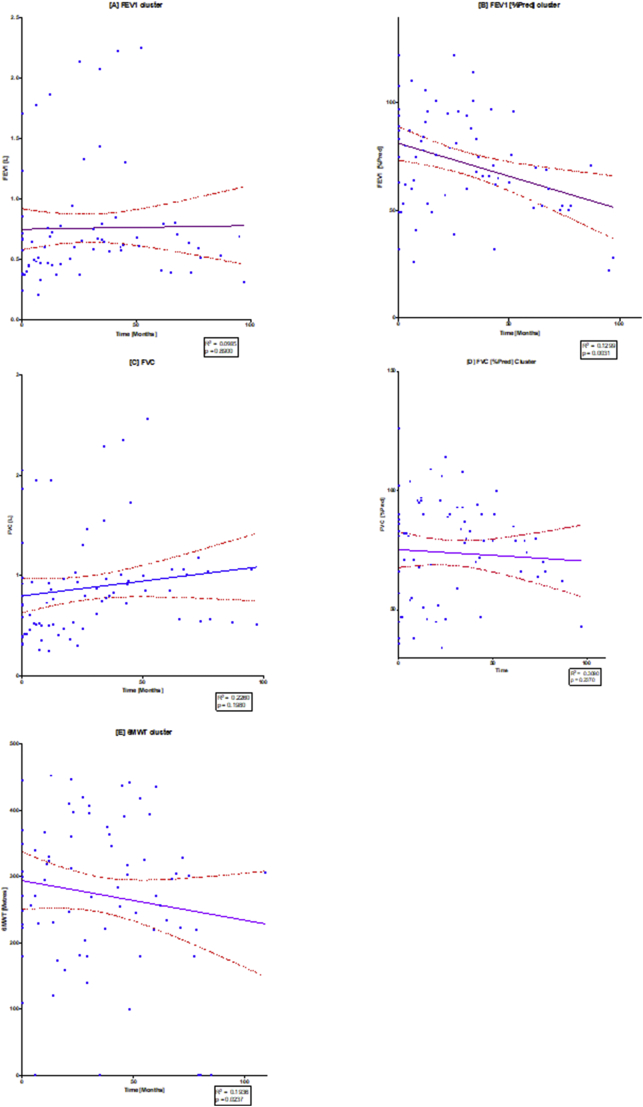
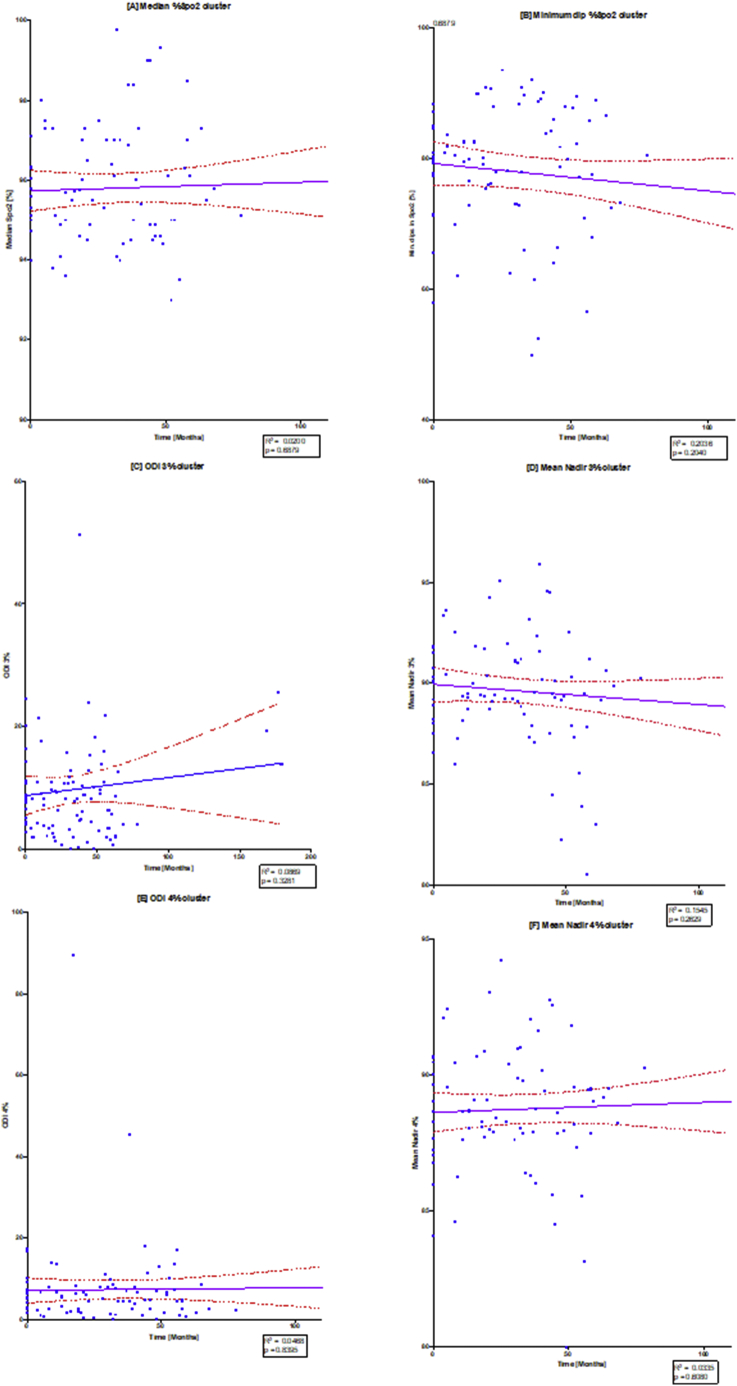
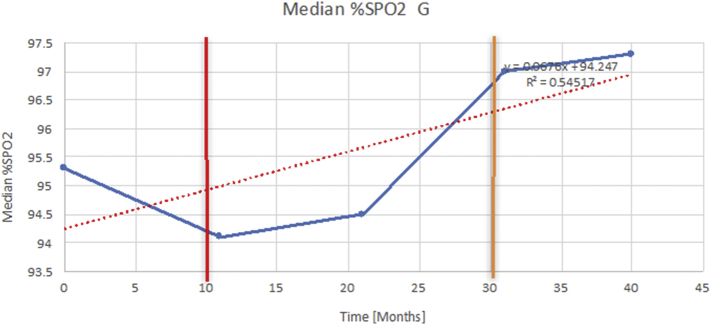
Results: Sequential spirometry and oximetry values were collected from 16 patients, of which 13/16 were ERT treated. In general, during the study period there was a global reduction in static spirometry values in all subjects, as well as cardiorespiratory function as assessed by the 6MWT, with the decline being delayed in the ERT group. Oximetry changed to a minor degree over time in the ERT group, whereas it declined in the non-ERT group. FEV1, FVC [%predicted] and ODI 3% exhibited a strong, combined positive correlation (r 0.74-95% CI 0.61 to 0.83; p < .0001). Non-invasive ventilation (NIV) and adenotonsillectomy appeared more effective in the ERT group, either improving pulmonary function or attenuating deterioration.

Conclusions: Whilst spirometry values showed a gradual decline across all groups, oximetry showed modest improvement in respiratory function. The amalgamation of FEV1, FVC [%predicted] and ODI 3% appeared predictive of changes in respiratory function in this study, suggestive as being composite endpoints for monitoring disease progression as well as guiding response to ERT in MPS IVA patients.

Keywords: 6MWT, 6-minute walk test; AASM, American Academy of Sleep Medicine; ADLs, Activities of daily living; AEs, Adverse Events; ATS, American Thoracic Society; BTS, British Thoracic Society; BiPAP, Bi-level non-invasive ventilation; C6S, Chondroitin Sulphate; CPET, Cardiopulmonary exercises testing; ECM, Extracellular matrix; ERT, Enzyme replacement therapy; Enzyme replacement therapy; FDA, Food and Drug Administration; FEV1 [%Pred], FEV1 as a percentage of predicted; FEV1, Forced expiratory volume in one second; FVC, Forced vital capacity; FVC: [%Pred], FVC as a percentage of predicted; GAG, Glycosaminoglycan; GALNS, Acetylgalactosamine-6-sulfatase; KS, Keratan sulfate; LSD, Lysosomal storage disease.; MPS; MPS IVA, Mucopolysaccharidosis Type IVA; MPS, Mucopolysaccharidosis; Med nadir 3%, Median nadir of arterial oxygen saturations 3% from baseline; Min dip Spo2, Minimum dips in arterial oxygen saturations [%]; Morquio syndrome; Mucopolysaccharidosis IVA; ODI 3%, Oxygen desaturation index; ≥ 3% arterial oxygen desaturations per hour; OSA, Obstructive Sleep Apnea; Respiratory changes; Sleep disordered breathing; Spo2, Arterial saturations; T&A, Adenotonsillectomy; uKS, Urinary keratan sulfate.


Figures

Fig. 1
Fig. 1
Pathophysiology of airway disease in MPS IVA. (A) Diagram to illustrate the pathophysiology for airway and respiratory disease in MPS IVA. Note the combination of GAG accumulation into tissues organs results in both obstructive and restrictive disease effecting both the lower and upper airways. A positive feedback loops develops from thick, copious secretions, airway narrowing and chronic respiratory infections. Image kindly reproduced with permission from Tomatsu et al. (2016). (B) The second image depicts a severely diseased traches in a 19 year patient with MPS IVA who had not received ERT treatment. Note the profound tortuosity and tracheal buckling (solid white arrow) that is pathognomic of MPS IVA; in this case the narrowest point of the trachea is 2 mm.
Fig. 2
Fig. 2
Spirometry changes over the course of the study. The diagram illustrates individual plots and natural progression in spirometry for each subject, along with summary plots, divided into ERT and non-ERT groups. This was conducted for each of the following spirometry variables: (A) FEV1, (B) FEV1[%Pred], (C) FVC, (D) FVC [%Pred], (E) FEV1/FVC) and (F) 6MWT. Note, when values are averaged out for both the ERT and non-ERT group, there is global decline in spirometry values over the course of the study.
Fig. 2
Fig. 2
Spirometry changes over the course of the study. The diagram illustrates individual plots and natural progression in spirometry for each subject, along with summary plots, divided into ERT and non-ERT groups. This was conducted for each of the following spirometry variables: (A) FEV1, (B) FEV1[%Pred], (C) FVC, (D) FVC [%Pred], (E) FEV1/FVC) and (F) 6MWT. Note, when values are averaged out for both the ERT and non-ERT group, there is global decline in spirometry values over the course of the study.
Fig. 3
Fig. 3
Oximetry changes over the course of the study. The diagram illustrates individual plots and natural progression in oximetry for each subject, along with summary plots, divided into ERT and non-ERT groups. This was conducted for: (A) median %Spo2, (B) ODI3%, (C) mean nadir 3%, (D) ODI4%, (E) mean nadir 4% and (F) min dip SpO2 (%). Note also that the graph on the right of the induvial plots is a summary that describes the mean changes of all subjects in the ERT and non-ERT of the study period.
Fig. 3
Fig. 3
Oximetry changes over the course of the study. The diagram illustrates individual plots and natural progression in oximetry for each subject, along with summary plots, divided into ERT and non-ERT groups. This was conducted for: (A) median %Spo2, (B) ODI3%, (C) mean nadir 3%, (D) ODI4%, (E) mean nadir 4% and (F) min dip SpO2 (%). Note also that the graph on the right of the induvial plots is a summary that describes the mean changes of all subjects in the ERT and non-ERT of the study period.
Fig. 4
Fig. 4
Linear regression of spirometry changes over time. The diagram illustrates individual scatterplots for spirometry changes over time: (A) FEV1, (B) FEV1[%Pred], (C) FVC, (D) FVC [%Pred], (E) FEV1/FVC) and (F) 6MWT. Note the solid purple line is the linear regression line with the red dashed lines providing the 95% confidence lines, where there can be 95% confidence that the population mean would lie between these lines. The widening of the 95% confidence band towards the end of the study demonstrates that there were fewer results towards the end of the study. R2 and p values are shown in each of the regression plots. (For interpretation of the references to colour in this figure legend, the reader is referred to the web version of this article.)
Fig. 5
Fig. 5
Linear regression of oximetry changes over time. The diagram illustrates individual scatterplots for oximetry changes over time: (A) median %Spo2, (B) ODI3%, (C) mean nadir 3%, (D) ODI4%, (E) mean nadir 4% and (F) min dip SpO2 (%). Note the solid purple line is the linear regression line with the red dashed lines providing the 95% confidence lines. R2 and p values are shown in each of the regression plots. (For interpretation of the references to colour in this figure legend, the reader is referred to the web version of this article.)
Fig. 6
Fig. 6
The effects of adenotonsillectomy and NIV. The above graph demonstrates an example of how each of the individual plots where constructed to ascertain the changes in pulmonary function over time. A line of best fit creating a regression line was created to ascertain the overall trend of whether there was a decline or improvement. Note also, the solid red and orange bars, that mark when a therapeutic intervention was undertaken. The solid red line (−) indicates when adenotonsillectomy was undertaken and the orange line (−) illustrates when NIV was instituted. (For interpretation of the references to colour in this figure legend, the reader is referred to the web version of this article.)
Fig. 7
Fig. 7
Summary of spirometry and oximetry changes. The figure above depicts the overall changes in spirometry and oximetry from baseline over the course of the study, grouped by each of the variables of interest. There was a general decline in spirometry variables over the course of the study, which appeared to be more significant in the ERT group. The decline in 6MWT was also more appreciable in the ERT group. The oximetry data showed that function remained more static with either small positive changes suggesting improvement.

References

    1. Morquio L. Sur une forme de dystrophie osseuse familiale. Bull. Soc. Pediatr. Paris. 1929;27:145–152.
    1. Jones S., Wynn R. Mucopolysaccharidoses: Clinical Features and Diagnosis – UpToDate. 2019. https://www.uptodate.com/contents/mucopolysaccharidoses-clinical-feature...
    1. Jones S., Wijburg F. Inborn Metab. Dis. Diagn. Treat. 6th ed. Springer; Berlin: 2016. Mucopolysaccharidoses, oligosaccharidoses and sialic acid disorders; p. 577.
    1. Tomatsu S., Montaño A.M., Oikawa H., Smith M., Barrera L., Chinen Y., Thacker M.M., Mackenzie W.G., Suzuki Y., Orii T. Mucopolysaccharidosis type IVA (Morquio A disease): clinical review and current treatment. Curr. Pharm. Biotechnol. 2011;12:931–945. - PubMed
    1. Tomatsu S., Averill L.W., Sawamoto K., Mackenzie W.G., Bober M.B., Pizarro C., Goff C.J., Xie L., Orii T., Theroux M. Obstructive airway in Morquio A syndrome, the past, the present and the future. Mol. Genet. Metab. 2016;117:150–156. - PMC - PubMed

LinkOut - more resources