. 2019 Jul 23:2:74.
doi: 10.1038/s41746-019-0141-x. eCollection 2019.

City-wide electronic health records reveal gender and age biases in administration of known drug-drug interactions

Affiliations

City-wide electronic health records reveal gender and age biases in administration of known drug-drug interactions

Rion Brattig Correia et al. NPJ Digit Med. .

Abstract

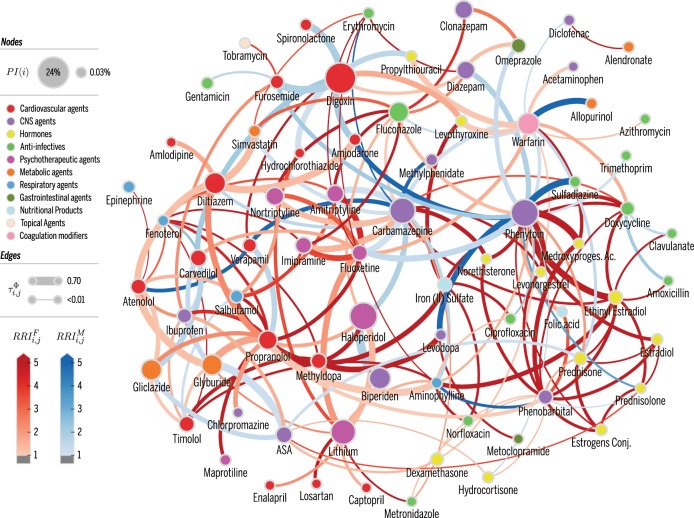
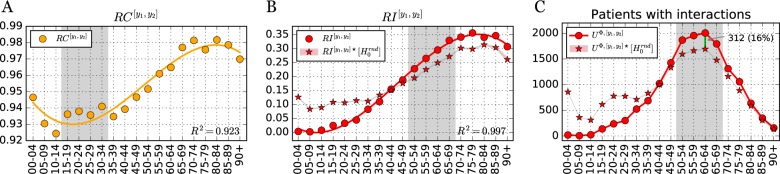
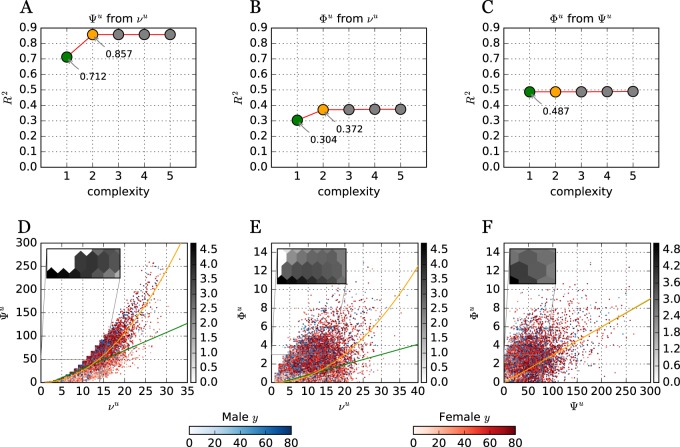
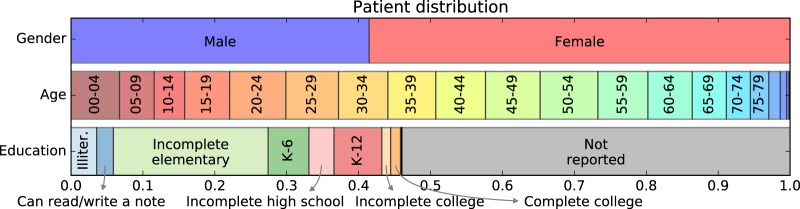
The occurrence of drug-drug-interactions (DDI) from multiple drug dispensations is a serious problem, both for individuals and health-care systems, since patients with complications due to DDI are likely to reenter the system at a costlier level. We present a large-scale longitudinal study (18 months) of the DDI phenomenon at the primary- and secondary-care level using electronic health records (EHR) from the city of Blumenau in Southern Brazil (pop. ≈340,000). We found that 181 distinct drug pairs known to interact were dispensed concomitantly to 12% of the patients in the city's public health-care system. Further, 4% of the patients were dispensed drug pairs that are likely to result in major adverse drug reactions (ADR)-with costs estimated to be much larger than previously reported in smaller studies. The large-scale analysis reveals that women have a 60% increased risk of DDI as compared to men; the increase becomes 90% when considering only DDI known to lead to major ADR. Furthermore, DDI risk increases substantially with age; patients aged 70-79 years have a 34% risk of DDI when they are dispensed two or more drugs concomitantly. Interestingly, a statistical null model demonstrates that age- and female-specific risks from increased polypharmacy fail by far to explain the observed DDI risks in those populations, suggesting unknown social or biological causes. We also provide a network visualization of drugs and demographic factors that characterize the DDI phenomenon and demonstrate that accurate DDI prediction can be included in health care and public-health management, to reduce DDI-related ADR and costs.

Keywords: Computational science; Drug regulation; Epidemiology; Public health; Risk factors.


Conflict of interest statement

Competing interestsThe authors declare no competing interests.

Figures

Fig. 1
Fig. 1
DDI network. A weighted version of network Δ where weights are defined by τi,jΦ. Nodes denote drugs i involved in at least one co-administration known to be a DDI. Node color represents the highest level of primary action class, as retrieved from Drugs.com (see legend). Node size represents the probability of interaction PI(i), as defined in text. Edge weights are the values of τi,jΦ obtained from Eq. (4). Edge colors denote RRIi,jg, where g ∈ {M, F}, to identify DDI edges that are higher risk for females (blue) or males (red). Color intensity for RRIi,jg varies in [1,5]; that is, values are clipped at 5
Fig. 2
Fig. 2
Risk of co-administration and interaction per age range. a, b Co-administration (RC[y1,y2]) and interaction risk (RI[y1,y2]) per age group, computed via Eq. (8). Solid orange line is the cubic regression for RC[y1,y2] while solid red line is the cubic regression for RI[y1,y2] (linear and quadratic regressions in Supplementary Information). c Absolute number of patients with at least one co-administration known to be a DDI. For all plots, age groups [90,94], [95,99], were aggregated into [90+]. Stars () depict values computed from the null model, H0rnd, with background filling denoting the 95% confidence interval based on 100 runs
Fig. 3
Fig. 3
Patients with their number of drugs dispensed νu, co-administrations Ψu and interactions Φu. d–f Each circle depicts a patient, with red (blue) circles denoting females (males). Color intensity denotes their age, with stronger red (blue) representing older women (men). To reduce circle overlay and enhance visualization, a uniform noise ∈[0,1] was added to both coordinates. Green and orange lines denotes linear and quadratic regressions, respectively. Inserts with Hexagonal log-bins are included to better depict the density of patients close to the origin. a–c Pareto fronts comparing regression results (R2) at increasing regression model complexity. For example, complexity 1 and 2 denote a linear and quadratic regression, respectively
Fig. 4
Fig. 4
Risk of co-administration and interaction per age range and gender. a Risk of co-administration per age group and gender, RC[y1,y2],g. b Risk of interaction per age group and gender, RI[y1,y2],g. c Absolute number of patients with at least one known DDI co-administration, per age and gender UΦ,[y1,y2],g. d, e Female and male risk of interaction per age group and gender, RI[y1,y2],F (d) and RI[y1,y2],M (e). For all plots, age groups, [90,94], [95,99], [90,90+] were aggregated into [90+]. Stars () depict values computed from the null model, H0rnd, with background filling denoting the 95% confidence interval based on 100 runs. Shaded areas identify specific age groups mentioned in the main manuscript
Fig. 5
Fig. 5
Distribution of patients given gender, age and education level. In total |UM| = 55,032 (41.46%) were males and |UF| = 77,690 (58.54%) were females. On education, a majority |Ue = ∅| = 71,662 (53.99%) did not report their education level. |Ue| = 48,547 (36,58%) declared having at most some high school education whereas |Ue + | = 12,513 (9,43%) had completed high school education or above. On age, patients |Uy = [20,24]| = 10,382 (7,82%) and |Uy = [50,54]| = 10,650 (8,02%) accounted for the two largest age groups. Labels K-6 and K-12 are Completed elementary and Completed high school education, respectively. Labels for age y ≥ 80 and education level above Completed college not shown
Fig. 6
Fig. 6
Diagram of co-administration and interaction computation. a A hypothetical patient-drug dispensing timeline with three drugs (i, j, and k). Drug administration length (a, in days, n) are shown for each dispensation. b The three possible pairwise comparisons (i, j), (i, k), and (j, k) between the dispensed drugs are shown with their co-administration overlap marked with either an orange (no known DDI) or red (known DDI) background

References

    1. Davies SJC, Eayrs S, Pratt P, Lennard MS. Potential for drug interactions involving cytochromes p450 2d6 and 3a4 on general adult psychiatric and functional elderly psychiatric wards. Br. J. Clin. Pharmacol. 2004;57:464–472. doi: 10.1111/j.1365-2125.2003.02040.x. - DOI - PMC - PubMed
    1. Hajjar ER, Cafiero AC, Hanlon JT. Polypharmacy in elderly patients. Am. J. Geriatr. Pharmacother. 2007;5:345–351. doi: 10.1016/j.amjopharm.2007.12.002. - DOI - PubMed
    1. Becker ML, et al. Hospitalisations and emergency department visits due to drug–drug interactions: a literature review. Pharmacoepidemiol. Drug Saf. 2007;16:641–651. doi: 10.1002/pds.1351. - DOI - PubMed
    1. Pfaffenbach G, Carvalho OM, Bergsten-Mendes G. Drug adverse reactions leading to hospital admission. Rev. Assoc. Med. Bras. 2002;48:237–241. doi: 10.1590/S0104-42302002000300037. - DOI - PubMed
    1. Camargo AL, Ferreira MBC, Heineck I. Adverse drug reactions: a cohort study in internal medicine units at a university hospital. Eur. J. Clin. Pharmacol. 2006;62:143–149. doi: 10.1007/s00228-005-0086-7. - DOI - PubMed