. 2019 Jul 19:2:263.
doi: 10.1038/s42003-019-0515-2. eCollection 2019.

Genome and transcriptome evolve separately in recently hybridized Trichosporon fungi

Affiliations

Genome and transcriptome evolve separately in recently hybridized Trichosporon fungi

Sira Sriswasdi et al. Commun Biol. .

Abstract

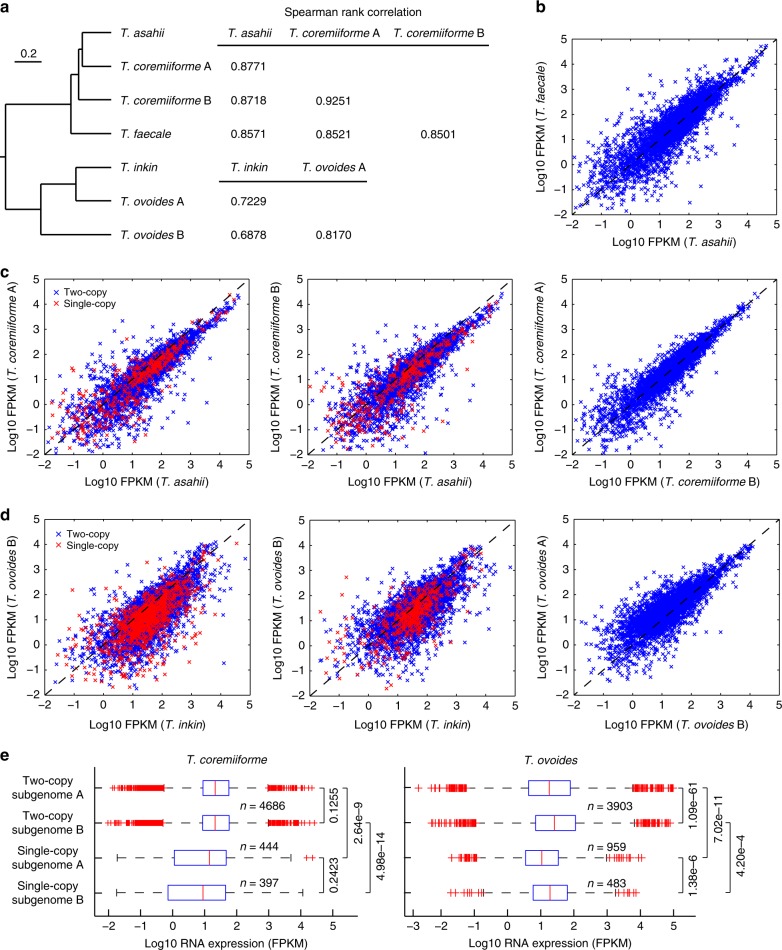
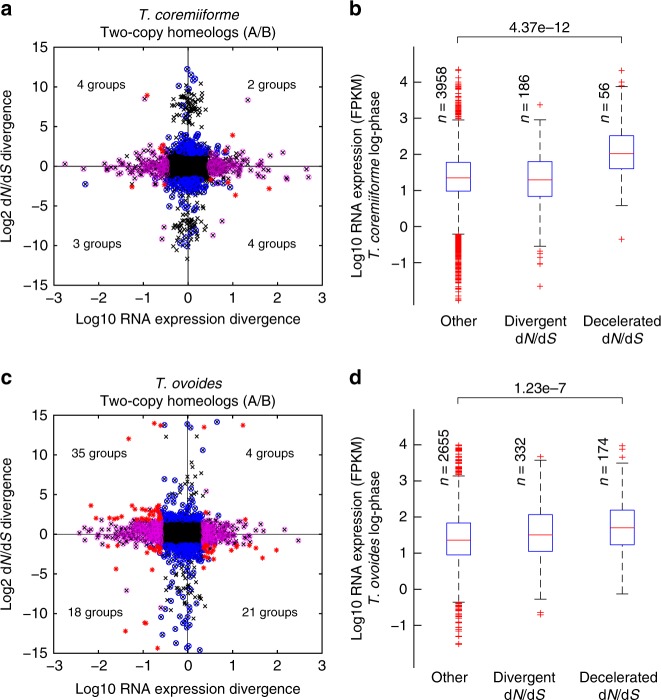
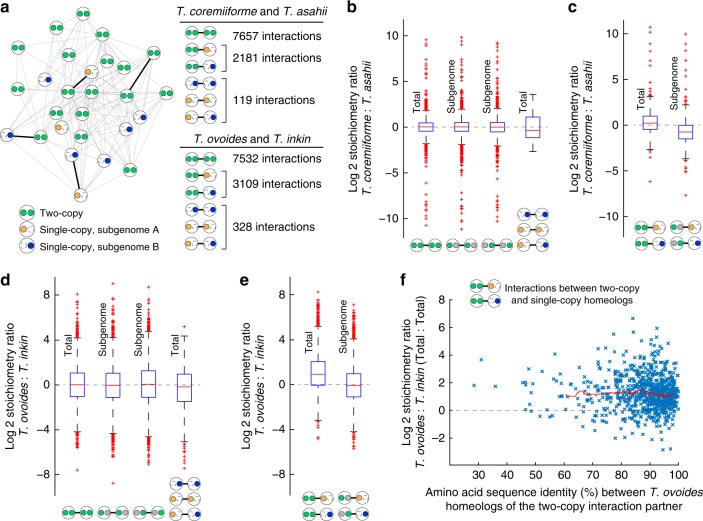
Genome hybridization is an important evolutionary event that gives rise to species with novel capabilities. However, the merging of distinct genomes also brings together incompatible regulatory networks that must be resolved during the course of evolution. Understanding of the early stages of post-hybridization evolution is particularly important because changes in these stages have long-term evolutionary consequences. Here, via comparative transcriptomic analyses of two closely related, recently hybridized Trichosporon fungi, T. coremiiforme and T. ovoides, and three extant relatives, we show that early post-hybridization evolutionary processes occur separately at the gene sequence and gene expression levels but together contribute to the stabilization of hybrid genome and transcriptome. Our findings also highlight lineage-specific consequences of genome hybridization, revealing that the transcriptional regulatory dynamics in these hybrids responded completely differently to gene loss events: one involving both subgenomes and another that is strictly subgenome-specific.

Keywords: Evolutionary biology; Molecular evolution.


Figures

Fig. 1
Fig. 1
Rapid convergences of transcriptional regulation of homeologous genes following genome hybridization. Expression levels from log-phase growth condition are shown. a Phylogenetic relationship between Trichosporon species analyzed. Spearman rank correlation coefficients for pairwise comparisons of expression levels between orthologs and homeologs from different Trichosporon genome and subgenomes are indicated. Only gene ortholog groups that are present in all species involved (T. asahii, T. faecale, and T. coremiiforme for the top table and T. inkin and T. ovoides for the bottom table) were included in the calculations. b Scatter plot comparing expression levels in log10 fragments per kilobase of transcript per million mapped reads (FPKM) between T. asahii and T. faecale orthologs. Dashed lines indicate the x = y diagonal. c Similar scatter plots for the comparisons of expression levels between T. coremiiforme’s subgenomes and T. asahii. Data points corresponding to two-copy and single-copy homeolog groups in T. coremiiforme are distinguished by blue and red markers, respectively. d Similar scatter plots for the comparisons of expression levels between T. ovoides’s subgenomes and T. inkin. e Boxplots comparing subgenome-specific expression levels in T. coremiiforme and T. ovoides. Wilcoxon signed-rank test p-values for the paired comparisons of expression levels among two-copy homeologs and Mann–Whitney U-test p-values for the comparisons among single-copy genes are indicated. Blue boxes indicate the 25th–75th percentile ranges. Red bars indicate the medians. Black whiskers indicate the approximated 0.35th–99.65th percentile ranges. Red cross markers indicate individual data points lying outside the 0.35th–99.65th percentile ranges. Number of genes in each group is indicated
Fig. 2
Fig. 2
Lack of concerted evolution at sequence and expression level among two-copy homeolog groups. a Scatter plot comparing divergence in evolutionary rate (dN/dS ratio) and divergence in expression level for two-copy homeolog pairs in T. coremiiforme. Divergences were calculated as the ratios of subgenome A homeolog’s over subgenome B homeolog’s. Black x markers display the data for all two-copy homeolog pairs. Blue and magenta circles indicate homeolog pairs with significant divergence in only evolutionary rate or only expression level, respectively (adjusted p-value ≤ 0.01 and fold-difference ≥ 3, see the “Materials and methods” section). Red asterisks indicate homeolog groups with significant divergence in both evolutionary rate and expression level and the number of these homeolog groups are indicated in each quadrant. Expression levels from log-phase growth condition are shown. b Box plots showing log-phase expression level of two-copy homeolog pairs in T. coremiiforme with divergent evolutionary rates or decelerated evolutionary rates compared to T. asahii’s orthologs (see the “Materials and methods” section). Mann–Whitney U-test p-value for the comparison between homeolog pairs with decelerated evolutionary rates and those without is indicated at the top. The numbers of homeolog pairs belonging to each class are indicated next to the corresponding box plot. Blue boxes designate the 25th–75th percentile ranges. Red bars indicate the medians. Black whiskers designate the approximated 0.35th–99.65th percentile ranges. Red cross markers indicate individual data points lying outside the 0.35th–99.65th percentile ranges. c and d Similar plots for T. ovoidesT. inkin comparison
Fig. 3
Fig. 3
Two modes of transcriptional stoichiometry maintenance following genome hybridization. Expression levels from log-phase growth condition are shown. a Schematic of a protein–protein interaction network in hybrid species. Large circle represents a homeolog group with inner circles representing subgenome-specific homeologs. Dashed outline for inner circle indicates gene loss and solid color indicates presence. Green is used when both homeologs are present. Orange or blue is used when only subgenome A or subgenome B homeolog is present, respectively. The numbers of interactions in each category (two-copy to two-copy, two-copy to single-copy, and single-copy to single-copy) are listed. b Box plots comparing the conservation of interaction stoichiometry across T. coremiiforme and T. asahii. From left to right, the data for (i) interactions between two-copy homeologs, (ii) interactions between two-copy homeologs but considering only the transcript level of subgenome A homeologs, (iii) same as (ii) but considering only the transcript level of subgenome B homeologs, and (iv) interactions between single-copy homeologs are shown. Symbols at the bottom indicate the different sets of interactions considered in each box plot. Gray circles indicate homeologs that are present but were excluded from stoichiometry calculation in order to highlight subgenome specificity. Expression levels from log-phase growth condition are shown. Vertical labels indicate the type of stoichiometry under consideration (Total = stoichiometry involving all homeolog copies, Subgenome = stoichiometry involving only homeolog copies belonging to the same subgenome). Blue boxes designate the 25th–75th percentile ranges. Red bars indicate the medians. Black whiskers designate the approximated 0.35th–99.65th percentile ranges. Red cross markers indicate individual data points lying outside the 0.35th–99.65th percentile ranges. c Boxplots comparing the conservation of stoichiometry across T. coremiiforme and T. asahii for interactions between a two-copy homeolog group and a single-copy homeolog. d and e Similar box plots for T. ovoidesT. inkin comparisons. f Scatter plot showing the relationship between the conservation of stoichiometry across T. ovoides and T. inkin for protein–protein interactions involving a two-copy homeolog pair and a single-copy gene and the amino acid sequence identity between the homeolog copies within the two-copy group. Red trend line indicates the running median

References

    1. Ohno, S. Evolution by Gene Duplication. (Springer, New York, 1970).
    1. Hegarty M. Hybridization: expressing yourself in a crowd. Curr. Biol. 2011;21:R254–R255. doi: 10.1016/j.cub.2011.02.035. - DOI - PubMed
    1. Mallet J. Hybridization as an invasion of the genome. Trends Ecol. Evol. 2005;20:229–237. doi: 10.1016/j.tree.2005.02.010. - DOI - PubMed
    1. Landry CR, Hartl DL, Ranz JM. Genome clashes in hybrids: insights from gene expression. Heredity. 2007;99:483–493. doi: 10.1038/sj.hdy.6801045. - DOI - PubMed
    1. Mack KL, Nachman MW. Gene regulation and speciation. Trends Genet. 2017;33:68–80. doi: 10.1016/j.tig.2016.11.003. - DOI - PMC - PubMed

Publication types