

Characterizing the joint effects of pesticide exposure and criteria ambient air pollutants on pediatric asthma morbidity in an agricultural community
- PMID: 31342006
- PMCID: PMC6571181
- DOI: 10.1097/EE9.0000000000000046
Characterizing the joint effects of pesticide exposure and criteria ambient air pollutants on pediatric asthma morbidity in an agricultural community
Abstract
Background: Environmental contributions to pediatric asthma morbidity have been studied extensively in urban settings; exposures characteristic of agricultural and rural communities have received less attention despite a comparable burden of morbidity.
Methods: We obtained repeated urine samples (n = 139) from 16 school-age children with asthma in the Yakima Valley of Washington State between July and October 2012. Biomarkers of organophosphate (OP) pesticide exposure (dialkyl phosphates [DAPs]) and asthma exacerbation (leukotriene E4 [LTE4]) were analyzed in samples. Corresponding 24-hour average particulate matter <2.5 μg (PM2.5) and maximum 8-hour ozone concentration data for the study period were available from local monitoring stations. We evaluated the independent and multi-pollutant associations between LTE4 and exposure to ambient air pollutants and DAPs using generalized estimating equations. For multi-domain and multi-pollutant models, we created categorized pollution combination levels and estimated the relative health impact of exposure to pollutant mixtures.
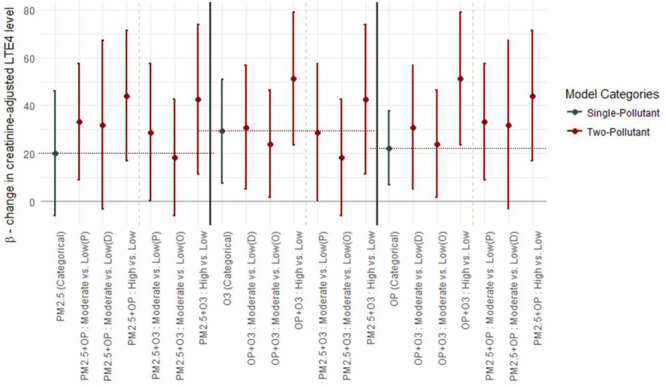
Results: In single-pollutant models, an interquartile range increase in exposures to DAPs was associated with increase in LTE4 levels (β: 4.1 [0.6-7.6] pg/mg). PM2.5 and ozone were also associated with increase in LTE4, though confidence intervals contained the null value. Increase in LTE4 levels was consistently associated with increase in median-dichotomized multi-pollutant combination exposures; the highest effect estimates were observed with joint highest (vs. the lowest) category of the three-pollutant exposure (PM2.5, ozone, and OP; β: 53.5, 95% confidence interval = 24.2, 82.8 pg/mg).
Conclusion: Concurrent short-term exposure to criteria air pollutants and OPs in an agricultural community was associated with an increase in a marker of asthma morbidity.
Keywords: Agricultural settings; Biomarkers; Pediatric asthma; Pollutant mixtures.
Conflict of interest statement
Sponsorships or competing interests that may be relevant to content are disclosed at the end of the article.
Figures


Similar articles
-
Association of ambient air pollution and pesticide mixtures on respiratory inflammatory markers in agricultural communities.Environ Res Health. 2024 Sep 1;2(3):035007. doi: 10.1088/2752-5309/ad52ba. Epub 2024 Jun 25. Environ Res Health. 2024. PMID: 38962451 Free PMC article.
-
Association of Organophosphate Pesticide Exposure and a Marker of Asthma Morbidity in an Agricultural Community.J Agromedicine. 2020 Jan;25(1):106-114. doi: 10.1080/1059924X.2019.1619644. Epub 2019 May 25. J Agromedicine. 2020. PMID: 31130077 Free PMC article.
-
Effects of short-term exposure to air pollution on hospital admissions of young children for acute lower respiratory infections in Ho Chi Minh City, Vietnam.Res Rep Health Eff Inst. 2012 Jun;(169):5-72; discussion 73-83. Res Rep Health Eff Inst. 2012. PMID: 22849236
-
Evaluation of a possible association of urban air toxics and asthma.Environ Health Perspect. 1995 Sep;103 Suppl 6(Suppl 6):253-71. doi: 10.1289/ehp.95103s6253. Environ Health Perspect. 1995. PMID: 8549483 Free PMC article. Review.
-
Epidemiologic evidence for asthma and exposure to air toxics: linkages between occupational, indoor, and community air pollution research.Environ Health Perspect. 2002 Aug;110 Suppl 4(Suppl 4):573-89. doi: 10.1289/ehp.02110s4573. Environ Health Perspect. 2002. PMID: 12194890 Free PMC article. Review.
Cited by
-
Cumulative Exposures to Environmental and Socioeconomic Risk Factors in Milwaukee County, Wisconsin.Geohealth. 2024 May 6;8(5):e2023GH000927. doi: 10.1029/2023GH000927. eCollection 2024 May. Geohealth. 2024. PMID: 38711844 Free PMC article.
-
Association of ambient air pollution and pesticide mixtures on respiratory inflammatory markers in agricultural communities.Environ Res Health. 2024 Sep 1;2(3):035007. doi: 10.1088/2752-5309/ad52ba. Epub 2024 Jun 25. Environ Res Health. 2024. PMID: 38962451 Free PMC article.
-
Per- and polyfluoroalkyl substances, polychlorinated biphenyls, organochlorine pesticides, and polybrominated diphenyl ethers and dysregulation of MicroRNA expression in humans and animals-A systematic review.Environ Res. 2024 Mar 1;244:117832. doi: 10.1016/j.envres.2023.117832. Epub 2023 Dec 4. Environ Res. 2024. PMID: 38056610 Free PMC article.
-
The joint effect of ambient air pollution and agricultural pesticide exposures on lung function among children with asthma.Environ Res. 2020 Nov;190:109903. doi: 10.1016/j.envres.2020.109903. Epub 2020 Jul 18. Environ Res. 2020. PMID: 32750551 Free PMC article.
-
Factors affecting urinary organophosphate pesticide metabolite levels among Californian agricultural community members.Sci Total Environ. 2023 Jul 10;881:163362. doi: 10.1016/j.scitotenv.2023.163362. Epub 2023 Apr 12. Sci Total Environ. 2023. PMID: 37059148 Free PMC article.
References
-
- Bloom B, Simpson J. Tables of summary health statistics for U.S. children: 2015 national health interview survey. Natl Cent Heal Stat 201661–6
-
- Barnett SBL, Nurmagambetov TA. Costs of asthma in the United States: 2002–2007. J Allergy Clin Immunol 2011127145–152 - PubMed
Grants and funding
LinkOut - more resources
Full Text Sources
Miscellaneous