

Relative toxicities of major particulate matter constituents on birthweight in Massachusetts
- PMID: 31342007
- PMCID: PMC6571180
- DOI: 10.1097/EE9.0000000000000047
Relative toxicities of major particulate matter constituents on birthweight in Massachusetts
Abstract
Background: Maternal exposure to fine particulate air pollution (PM2.5) during pregnancy has been linked to lower newborn birthweight, making it a toxic exposure because lower birthweight is a risk factor for chronic disease and mortality. However, the toxicity of major constituents of PM2.5 and how they compare to each other remain uncertain.
Methods: We assigned address-specific exposure to PM2.5, elemental carbon (EC), organic carbon (OC), nitrate, and sulfate averaged over the entire period of pregnancy for each birth in Massachusetts from 2001 to 2012 using a high-resolution exposure model. Using multivariate regression adjusted for total PM2.5, we estimated the relative toxicity of each constituent on continuous birthweight.
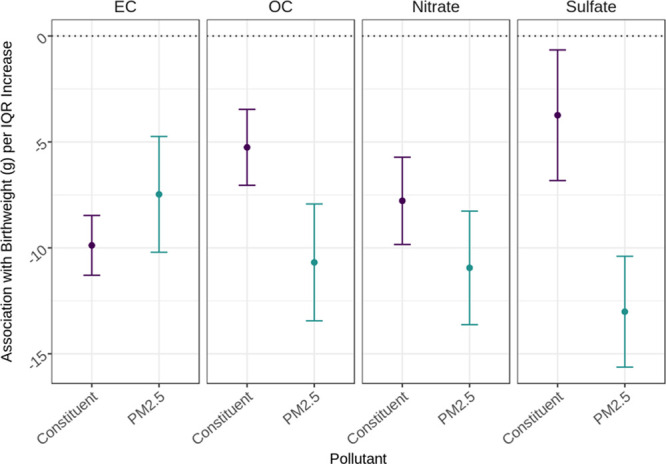
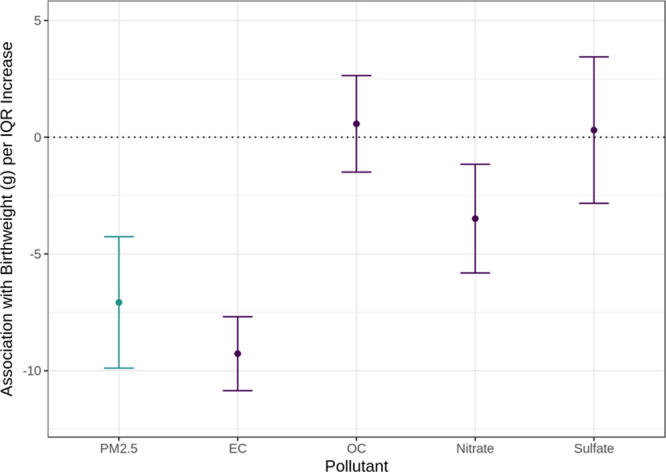
Results: EC was more toxic per interquartile range increase compared with remaining PM2.5 in single constituent models that estimated the effect of a constituent with adjustment for PM2.5. OC, nitrate, and sulfate were each less toxic than their respective remaining PM2.5 per interquartile range increase. When all constituents and total PM2.5 were included in the same model, EC was most toxic, followed by nitrate, then OC and sulfate with similar toxicities. Sensitivity analyses using term low birth weight and small for gestational age also showed that EC was most detrimental as did averaging exposures over the third trimester of pregnancy. Scaling to unit mass increases also showed EC to be most toxic.
Conclusion: Four major constituents of PM2.5 had different relative toxicities on continuous birthweight. Our findings suggest that EC was most toxic, followed by nitrate, OC, and sulfate.
Conflict of interest statement
Sponsorships or competing interests that may be relevant to content are disclosed at the end of the article.
Figures
Similar articles
-
Space-time trends of PM2.5 constituents in the conterminous United States estimated by a machine learning approach, 2005-2015.Environ Int. 2018 Dec;121(Pt 2):1137-1147. doi: 10.1016/j.envint.2018.10.029. Epub 2018 Nov 7. Environ Int. 2018. PMID: 30413295
-
Short-term exposure to fine particulate matter constituents and mortality: case-crossover evidence from 32 counties in China.Sci China Life Sci. 2022 Dec;65(12):2527-2538. doi: 10.1007/s11427-021-2098-7. Epub 2022 Jun 14. Sci China Life Sci. 2022. PMID: 35713841
-
Prenatal exposure to fine particulate matter and birth weight: variations by particulate constituents and sources.Epidemiology. 2010 Nov;21(6):884-91. doi: 10.1097/EDE.0b013e3181f2f405. Epidemiology. 2010. PMID: 20811286 Free PMC article.
-
Short-term and long-term exposures to fine particulate matter constituents and health: A systematic review and meta-analysis.Environ Pollut. 2019 Apr;247:874-882. doi: 10.1016/j.envpol.2018.12.060. Epub 2018 Dec 21. Environ Pollut. 2019. PMID: 30731313
-
Associations of fine particulate matter and constituents with pediatric emergency room visits for respiratory diseases in Shanghai, China.Int J Hyg Environ Health. 2021 Jul;236:113805. doi: 10.1016/j.ijheh.2021.113805. Epub 2021 Jul 13. Int J Hyg Environ Health. 2021. PMID: 34271373 Review.
Cited by
-
Associations of Autism Spectrum Disorder with PM2.5 Components: A Comparative Study Using Two Different Exposure Models.Environ Sci Technol. 2023 Jan 10;57(1):405-414. doi: 10.1021/acs.est.2c05197. Epub 2022 Dec 22. Environ Sci Technol. 2023. PMID: 36548990 Free PMC article.
-
PM2.5, vegetation density, and childhood cancer: a case-control registry-based study from Texas 1995-2011.J Natl Cancer Inst. 2024 Jun 7;116(6):876-884. doi: 10.1093/jnci/djae035. J Natl Cancer Inst. 2024. PMID: 38366656 Free PMC article.
-
Effects of PM2.5 and its constituents on hemoglobin during the third trimester in pregnant women.Environ Sci Pollut Res Int. 2022 May;29(23):35193-35203. doi: 10.1007/s11356-022-18693-2. Epub 2022 Jan 20. Environ Sci Pollut Res Int. 2022. PMID: 35060058 Free PMC article.
-
Association of PM2.5 and Its Chemical Compositions with Metabolic Syndrome: A Nationwide Study in Middle-Aged and Older Chinese Adults.Int J Environ Res Public Health. 2022 Nov 8;19(22):14671. doi: 10.3390/ijerph192214671. Int J Environ Res Public Health. 2022. PMID: 36429390 Free PMC article.
-
Associations between satellite-derived estimates of PM2.5 species concentrations for organic carbon, elemental carbon, nitrate, and sulfate with birth weight and preterm birth in California during 2005-2014.J Expo Sci Environ Epidemiol. 2025 Apr;35(2):233-241. doi: 10.1038/s41370-024-00673-y. Epub 2024 Apr 25. J Expo Sci Environ Epidemiol. 2025. PMID: 38664552
References
-
- Basu R, Harris M, Sie L, Malig B, Broadwin R, Green R. Effects of fine particulate matter and its constituents on low birth weight among full-term infants in California. Environ Res 201412842–51 - PubMed
-
- Stieb DM, Chen L, Eshoul M, Judek S. Ambient air pollution, birth weight and preterm birth: a systematic review and meta-analysis. Environ Res 2012117100–111 - PubMed
Grants and funding
LinkOut - more resources
Full Text Sources