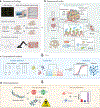
Big Data Approaches for Modeling Response and Resistance to Cancer Drugs
- PMID: 31342013
- PMCID: PMC6655478
- DOI: 10.1146/annurev-biodatasci-080917-013350
Big Data Approaches for Modeling Response and Resistance to Cancer Drugs
Abstract
Despite significant progress in cancer research, current standard-of-care drugs fail to cure many types of cancers. Hence, there is an urgent need to identify better predictive biomarkers and treatment regimes. Conventionally, insights from hypothesis-driven studies are the primary force for cancer biology and therapeutic discoveries. Recently, the rapid growth of big data resources, catalyzed by breakthroughs in high-throughput technologies, has resulted in a paradigm shift in cancer therapeutic research. The combination of computational methods and genomics data has led to several successful clinical applications. In this review, we focus on recent advances in data-driven methods to model anticancer drug efficacy, and we present the challenges and opportunities for data science in cancer therapeutic research.
Keywords: big data; combination therapy; drug resistance; immunotherapy; precision medicine; response biomarker; toxicity.
Figures


Similar articles
-
Big data in basic and translational cancer research.Nat Rev Cancer. 2022 Nov;22(11):625-639. doi: 10.1038/s41568-022-00502-0. Epub 2022 Sep 5. Nat Rev Cancer. 2022. PMID: 36064595 Free PMC article. Review.
-
Big science and big data in nephrology.Kidney Int. 2019 Jun;95(6):1326-1337. doi: 10.1016/j.kint.2018.11.048. Epub 2019 Mar 5. Kidney Int. 2019. PMID: 30982672 Review.
-
[Development of antituberculous drugs: current status and future prospects].Kekkaku. 2006 Dec;81(12):753-74. Kekkaku. 2006. PMID: 17240921 Review. Japanese.
-
The Scope of Big Data in One Medicine: Unprecedented Opportunities and Challenges.Front Vet Sci. 2017 Nov 16;4:194. doi: 10.3389/fvets.2017.00194. eCollection 2017. Front Vet Sci. 2017. PMID: 29201868 Free PMC article. Review.
-
The Use of Big Data in Personalized Healthcare to Reduce Inventory Waste and Optimize Patient Treatment.J Pers Med. 2024 Apr 3;14(4):383. doi: 10.3390/jpm14040383. J Pers Med. 2024. PMID: 38673011 Free PMC article. Review.
Cited by
-
Big data in basic and translational cancer research.Nat Rev Cancer. 2022 Nov;22(11):625-639. doi: 10.1038/s41568-022-00502-0. Epub 2022 Sep 5. Nat Rev Cancer. 2022. PMID: 36064595 Free PMC article. Review.
-
Integrative Bioinformatics Analysis: Unraveling Variant Signatures and Single-Nucleotide Polymorphism Markers Associated with 5-FU-Based Chemotherapy Resistance in Colorectal Cancer Patients.J Gastrointest Cancer. 2024 Dec;55(4):1607-1619. doi: 10.1007/s12029-024-01102-x. Epub 2024 Sep 6. J Gastrointest Cancer. 2024. PMID: 39240276
-
Systematic investigation of cytokine signaling activity at the tissue and single-cell levels.Nat Methods. 2021 Oct;18(10):1181-1191. doi: 10.1038/s41592-021-01274-5. Epub 2021 Sep 30. Nat Methods. 2021. PMID: 34594031 Free PMC article.
-
Systematic prediction of drug resistance caused by transporter genes in cancer cells.Sci Rep. 2021 Apr 1;11(1):7400. doi: 10.1038/s41598-021-86921-9. Sci Rep. 2021. PMID: 33795761 Free PMC article.
-
Spike-in normalization for single-cell RNA-seq reveals dynamic global transcriptional activity mediating anticancer drug response.NAR Genom Bioinform. 2021 Jun 17;3(2):lqab054. doi: 10.1093/nargab/lqab054. eCollection 2021 Jun. NAR Genom Bioinform. 2021. PMID: 34159316 Free PMC article.
References
-
- Huang ME, Ye YC, Chen SR, Chai JR, Lu JX, et al. 1988. Use of all-trans retinoic acid in the treatment of acute promyelocytic leukemia. Blood 72:567–72 - PubMed
-
- Deininger M, Buchdunger E, Druker BJ. 2005. The development of imatinib as a therapeutic agent for chronic myeloid leukemia. Blood 105:2640–53 - PubMed
-
- Paez JG, Janne PA, Lee JC, Tracy S, Greulich H, et al. 2004. EGFR mutations in lung cancer: correlation with clinical response to gefitinib therapy. Science 304:1497–500 - PubMed
-
- Solomon BJ, Mok T, Kim DW, Wu YL, Nakagawa K, et al.2014. First-line crizotinib versus chemotherapy in ALK-positive lung cancer. New Engl. J. Med. 371:2167–77 - PubMed
-
- Holohan C, Van Schaeybroeck S, Longley DB,Johnston PG. 2013. Cancer drug resistance: an evolving paradigm. Nat. Rev. Cancer 13:714–26 - PubMed
Grants and funding
LinkOut - more resources
Full Text Sources
Other Literature Sources

