FASt single-breathhold 2D multislice myocardial T1 mapping (FAST1) at 1.5T for full left ventricular coverage in three breathholds
- PMID: 31342614
- PMCID: PMC6954880
- DOI: 10.1002/jmri.26869
FASt single-breathhold 2D multislice myocardial T1 mapping (FAST1) at 1.5T for full left ventricular coverage in three breathholds
Abstract
Background: Conventional myocardial T1 mapping techniques such as modified Look-Locker inversion recovery (MOLLI) generate one T1 map per breathhold. T1 mapping with full left ventricular coverage may be desirable when spatial T1 variations are expected. This would require multiple breathholds, increasing patient discomfort and prolonging scan time.
Purpose: To develop and characterize a novel FASt single-breathhold 2D multislice myocardial T1 mapping (FAST1) technique for full left ventricular coverage.
Study type: Prospective.
Population/phantom: Numerical simulation, agarose/NiCl2 phantom, 9 healthy volunteers, and 17 patients.
Field strength/sequence: 1.5T/FAST1.
Assessment: Two FAST1 approaches, FAST1-BS and FAST1-IR, were characterized and compared with standard 5-(3)-3 MOLLI in terms of accuracy, precision/spatial variability, and repeatability.
Statistical tests: Kruskal-Wallis, Wilcoxon signed rank tests, intraclass correlation coefficient analysis, analysis of variance, Student's t-tests, Pearson correlation analysis, and Bland-Altman analysis.
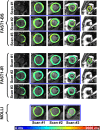
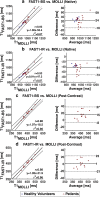
Results: In simulation/phantom, FAST1-BS, FAST1-IR, and MOLLI had an accuracy (expressed as T1 error) of 0.2%/4%, 6%/9%, and 4%/7%, respectively, while FAST1-BS and FAST1-IR had a precision penalty of 1.7/1.5 and 1.5/1.4 in comparison with MOLLI, respectively. In healthy volunteers, FAST1-BS/FAST1-IR/MOLLI led to different native myocardial T1 times (1016 ± 27 msec/952 ±22 msec/987 ± 23 msec, P < 0.0001) and spatial variability (66 ± 10 msec/57 ± 8 msec/46 ± 7 msec, P < 0.001). There were no statistically significant differences between all techniques for T1 repeatability (P = 0.18). In vivo native and postcontrast myocardial T1 times in both healthy volunteers and patients using FAST1-BS/FAST1-IR were highly correlated with MOLLI (Pearson correlation coefficient ≥0.93).
Data conclusion: FAST1 enables myocardial T1 mapping with full left ventricular coverage in three separated breathholds. In comparison with MOLLI, FAST1 yield a 5-fold increase of spatial coverage, limited penalty of T1 precision/spatial variability, no significant difference of T1 repeatability, and highly correlated T1 times. FAST1-IR provides improved T1 precision/spatial variability but reduced accuracy when compared with FAST1-BS.
Level of evidence: 1 Technical Efficacy: Stage 3 J. Magn. Reson. Imaging 2020;51:492-504.
Keywords: MOLLI; T1 mapping; inversion recovery; multislice; myocardial tissue characterization; slice-selective.
© 2019 The Authors. Journal of Magnetic Resonance Imaging published by Wiley Periodicals, Inc. on behalf of International Society for Magnetic Resonance in Medicine.
Figures


Similar articles
-
Fast myocardial T1 mapping using shortened inversion recovery based schemes.J Magn Reson Imaging. 2019 Aug;50(2):641-654. doi: 10.1002/jmri.26649. Epub 2019 Jan 22. J Magn Reson Imaging. 2019. PMID: 30672041 Free PMC article.
-
Simultaneous Mapping of T1 and T2 Using Cardiac Magnetic Resonance Fingerprinting in a Cohort of Healthy Subjects at 1.5T.J Magn Reson Imaging. 2020 Oct;52(4):1044-1052. doi: 10.1002/jmri.27155. Epub 2020 Mar 28. J Magn Reson Imaging. 2020. PMID: 32222092 Free PMC article.
-
Normal myocardial native T1 values in children using single-point saturation recovery and modified look-locker inversion recovery (MOLLI).J Magn Reson Imaging. 2020 Mar;51(3):897-903. doi: 10.1002/jmri.26910. Epub 2019 Sep 11. J Magn Reson Imaging. 2020. PMID: 31507010
-
High Spatial-Resolution and Acquisition-Efficiency Cardiac MR T1 Mapping Based on Radial bSSFP and a Low-Rank Tensor Constraint.J Magn Reson Imaging. 2025 Mar;61(3):1388-1401. doi: 10.1002/jmri.29564. Epub 2024 Aug 14. J Magn Reson Imaging. 2025. PMID: 39143028
-
Shortened Modified Look-Locker Inversion recovery (ShMOLLI) for clinical myocardial T1-mapping at 1.5 and 3 T within a 9 heartbeat breathhold.J Cardiovasc Magn Reson. 2010 Nov 19;12(1):69. doi: 10.1186/1532-429X-12-69. J Cardiovasc Magn Reson. 2010. PMID: 21092095 Free PMC article.
Cited by
-
Cardiac phase-resolved late gadolinium enhancement imaging.Front Cardiovasc Med. 2022 Sep 29;9:917180. doi: 10.3389/fcvm.2022.917180. eCollection 2022. Front Cardiovasc Med. 2022. PMID: 36247474 Free PMC article.
-
Bias, Repeatability and Reproducibility of Liver T1 Mapping With Variable Flip Angles.J Magn Reson Imaging. 2022 Oct;56(4):1042-1052. doi: 10.1002/jmri.28127. Epub 2022 Feb 27. J Magn Reson Imaging. 2022. PMID: 35224803 Free PMC article.
References
-
- Messroghli DR, Radjenovic A, Kozerke S, Higgins DM, Sivananthan MU, Ridgway JP. Modified Look‐Locker inversion recovery (MOLLI) for high‐resolution T1 mapping of the heart. Magn Reson Med 2004;52:141–146. - PubMed
-
- Messroghli DR, Walters K, Plein S, et al. Myocardial T1 mapping: Application to patients with acute and chronic myocardial infarction. Magn Reson Med 2007;58:34–40. - PubMed
-
- Kali A, Choi EY, Sharif B, et al. Native T1 mapping by 3‐T CMR imaging for characterization of chronic myocardial infarctions. JACC Cardiovasc Imaging 2015;8:1019–1030. - PubMed
Publication types
MeSH terms
Grants and funding
LinkOut - more resources
Full Text Sources
Medical
Research Materials

