. 2020 Jan;72(1):89-99.
doi: 10.1002/art.41054.

High Prevalence and Disease Correlation of Autoantibodies Against p40 Encoded by Long Interspersed Nuclear Elements in Systemic Lupus Erythematosus

Affiliations

High Prevalence and Disease Correlation of Autoantibodies Against p40 Encoded by Long Interspersed Nuclear Elements in Systemic Lupus Erythematosus

Victoria Carter et al. Arthritis Rheumatol. 2020 Jan.

Abstract

Objective: Long interspersed nuclear element 1 (LINE-1) encodes 2 proteins, the RNA binding protein p40 and endonuclease and reverse transcriptase (open-reading frame 2p [ORF2p]), which are both required for LINE-1 to retrotranspose. In cells expressing LINE-1, these proteins assemble with LINE-1 RNA and additional RNA binding proteins, some of which are well-known autoantigens in patients with systemic lupus erythematosus (SLE). This study was undertaken to investigate whether SLE patients also produce autoantibodies against LINE-1 p40.

Methods: Highly purified p40 protein was used to quantitate IgG autoantibodies in serum from 172 SLE patients and from disease controls and age-matched healthy subjects by immunoblotting and enzyme-linked immunosorbent assay (ELISA). Preparations of p40 that also contained associated proteins were analyzed by immunoblotting with patient sera.

Results: Antibodies reactive with p40 were detected in the majority of patients and many healthy controls. Their levels were higher in patients with SLE, but not those with systemic sclerosis, compared to healthy subjects (P = 0.01). Anti-p40 reactivity was higher in patients during a flare than in patients with disease in remission (P = 0.03); correlated with the SLE Disease Activity Index score (P = 0.0002), type I interferon score (P = 0.006), decrease in complement C3 level (P = 0.0001), the presence of anti-DNA antibodies (P < 0.0001) and anti-C1q antibodies (P = 0.004), and current or past history of nephritis (P = 0.02 and P = 0.003, respectively); and correlated inversely with age (r = -0.49, P < 0.0001). SLE patient sera also reacted with p40-associated proteins.

Conclusion: Autoantibodies reacting with LINE-1 p40 characterize a population of SLE patients with severe and active disease. These autoantibodies may represent an early immune response against LINE-1 p40 that does not yet by itself imply clinically significant autoimmunity, but may represent an early, and still reversible, step toward SLE pathogenesis.


Figures

Figure 1.
Figure 1.
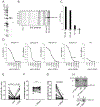
SLE sera recognize LINE-1 ORF1 p40 protein. A, Brilliant Coomassie Blue stain of the purified p40 preparation. The asterisk denotes p40 and the double asterisk a minor amount of cleaved p40. B, Immunoblot of p40 with sera from 3 healthy controls (HC; lanes 1–3) or from 10 SLE patients (lanes 4–13). C, ELISA of the SLE patients in lanes 13 and 12 in panel B (SLE pat. A and B) and the 3 HC combined. Data represent the mean ± SD from 9 wells each. D, ELISA with the indicated dilutions of the sera of 4 SLE patients and one HC, including the same patients (SLE pat. A and B) as in in panel B. E, ELISA for anti-p40 antibodies without additions (–), or with a 10-fold excess of soluble p40 (+p40), or with an equal amount of soluble DNA (+DNA). F, ELISA for anti-p40 antibodies without additions, or with DNase. G, ELISA for anti-dsDNA antibodies without any additions, or with DNase. H, immunoblot with SLE serum of a neutrophil lysate, 300 ng of p40, or a mixture of neutrophil lysate and p40. I, immunoblot with SLE serum of p40 without additions or in the presence of 1μg soluble DNA.
Figure 2.
Figure 2.
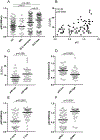
Autoantibodies against LINE-1 p40 correlate with disease activity. A, quantitation of autoantibodies reactive with LINE-1 p40 in the serum of healthy control subjects (HC; n=78) or patients with systemic sclerosis (SSc; n=20) or SLE in remission (n=83) or during a flare (n=79). The dotted line marks the 90th percentile of the distribution in healthy subjects. B, correlation between anti-p40 autoantibodies with SLEDAI in the 79 SLE patients experiencing a flare. C, SLEDAI in SLE patients grouped by anti-p40 reactivity below (p40 low) or above (p40 high) the 90th percentile of healthy controls. D, levels of complement C3 in SLE patients categorized as in panel C. E, anti-p40 reactivity in SLE patients grouped by complement levels as normal or low defined in SLEDAI. F, anti-p40 reactivity in SLE patients grouped by current absence or presence of anti-dsDNA autoantibodies. Statistical significance was calculated using Mann-Whitney U test and correlation by Spearman’s correlation test.
Figure 3.
Figure 3.
Correlation between anti-p40 autoantibodies with SLE organ manifestations. A, p40 reactivity in SLE patients with or without established kidney involvement. B, p40 reactivity in SLE patients with or without arthritis. C, p40 reactivity in SLE patients with or without a history of oral ulcers. Statistical significance was calculated using Mann-Whitney U test. See text for the impact of a Bonferroni correction on p values.
Figure. 4.
Figure. 4.
Autoantibodies against LINE-1 p40 correlate with other autoantibodies. A, p40 reactivity in SLE patients with or without a history of anti-dsDNA. B, p40 reactivity in SLE patients with or without anti-C1q antibodies in the same serum sample. C, p40 reactivity in SLE patients with or without anti-cardiolipin (aCL) antibodies. D, p40 reactivity in SLE patients with or without anti-Ro/SSA. E, p40 reactivity in SLE patients with or without anti-La/SSB antibodies. F, p40 reactivity in SLE patients with or without anti-RNP antibodies. Statistical significance was calculated using Mann-Whitney U test.
Figure 5.
Figure 5.
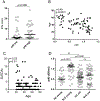
Type I interferon score and age correlation with anti-p40 autoantibodies. A, induction of type I IFN-inducible genes by the serum of patient with anti-p40 reactivity below (p40 low) or above (p40 high) the 90th percentile of the healthy control distribution. B, anti-p40 reactivity versus age of SLE patients. C, SLEDAI versus age of SLE patients in our cohort. D, anti-p40 reactivity in healthy subjects (HC) and SLE patients grouped by age, using 40 years as a cut off for young and old. Statistical significance was calculated using Mann-Whitney U test and Spearman’s correlation test.
Figure 6.
Figure 6.
SLE patient sera contain autoantibodies against proteins that co-purify with p40. Upper panel, SLE patient serum immunoblot. Lane 1, anti-FLAG immunoprecipitate from cells transfected with empty vector (pCEP) and eluted with FLAG peptide; lane 2, same eluted with SDS; lane 3 is empty; lane 4, anti-FLAG immunoprecipitate from cells transfected with the p40 expression vector (LD603) and eluted with FLAG peptide; lane 5, same eluted with SDS; lane 6 is empty; lane 7, anti-FLAG immunoprecipitate from cells transfected with p40 expression vector (LD288) and eluted with FLAG peptide; lane 8, same eluted with SDS. Lower panel, same samples immunoblotted with anti-p40 mAb. Similar results were obtained in two additional immunoblots.

Comment in

References

    1. Lander ES, Linton LM, Birren B, Nusbaum C, Zody MC, Baldwin J, et al. Initial sequencing and analysis of the human genome. Nature. 2001;409(6822):860–921. - PubMed
    1. Weiss RA, Stoye JP. Virology. Our viral inheritance. Science. 2013;340(6134):820–1. - PubMed
    1. Esnault C, Maestre J, Heidmann T. Human LINE retrotransposons generate processed pseudogenes. Nat Genet. 2000;24(4):363–7. - PubMed
    1. Ostertag EM, Kazazian HH Jr. Biology of mammalian L1 retrotransposons. Annu Rev Genet. 2001;35:501–38. - PubMed
    1. Brouha B, Schustak J, Badge RM, Lutz-Prigge S, Farley AH, Moran JV, et al. Hot L1s account for the bulk of retrotransposition in the human population. Proc Natl Acad Sci U S A. 2003;100(9):5280–5. - PMC - PubMed

Publication types

MeSH terms