Rats that are predisposed to excessive obesity show reduced (leptin-induced) thermoregulation even in the preobese state
- PMID: 31342663
- PMCID: PMC6656864
- DOI: 10.14814/phy2.14102
Rats that are predisposed to excessive obesity show reduced (leptin-induced) thermoregulation even in the preobese state
Abstract
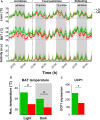
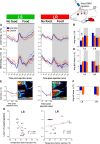
Both feeding behavior and thermogenesis are regulated by leptin. The sensitivity to leptin's anorexigenic effects on chow diet was previously shown to predict the development of diet-induced obesity. In this study, we determined whether the sensitivity to leptin's anorexigenic effects correlates with leptin's thermogenic response, and if this response is exerted at the level of the dorsomedial hypothalamus (DMH), a brain area that plays an important role in thermoregulation. Based on the feeding response to injected leptin on a chow diet, rats were divided into leptin-sensitive (LS) and leptin-resistant (LR) groups. The effects of leptin on core body, brown adipose tissue (BAT) and tail temperature were compared after intravenous versus intra-DMH leptin administration. After intravenous leptin injection, LS rats increased their BAT thermogenesis and reduced heat loss via the tail, resulting in a modest increase in core body temperature. The induction of these thermoregulatory mechanisms with intra-DMH leptin was smaller, but in the same direction as with intravenous leptin administration. In contrast, LR rats did not show any thermogenic response to either intravenous or intra-DMH leptin. These differences in the thermogenic response to leptin were associated with a 1°C lower BAT temperature and reduced UCP1 expression in LR rats under ad libitum feeding. The preexisting sensitivity to the anorexigenic effects of leptin, a predictor for obesity, correlates with the sensitivity to the thermoregulatory effects of leptin, which appears to be exerted, at least in part, at the level of the DMH.
Keywords: Brown adipose tissue; leptin; leptin sensitivity; tail temperature; thermogenesis.
© 2019 The Authors. Physiological Reports published by Wiley Periodicals, Inc. on behalf of The Physiological Society and the American Physiological Society.
Conflict of interest statement
The authors declare that they have no conflict of interest.
Figures


Similar articles
-
Interactions between leptin and hypothalamic neuropeptide Y neurons in the control of food intake and energy homeostasis in the rat.Diabetes. 1997 Mar;46(3):335-41. doi: 10.2337/diab.46.3.335. Diabetes. 1997. PMID: 9032086
-
Sex-dependent dietary obesity, induction of UCPs, and leptin expression in rat adipose tissues.Obes Res. 2001 Sep;9(9):579-88. doi: 10.1038/oby.2001.75. Obes Res. 2001. PMID: 11557839
-
Loss of dorsomedial hypothalamic GLP-1 signaling reduces BAT thermogenesis and increases adiposity.Mol Metab. 2018 May;11:33-46. doi: 10.1016/j.molmet.2018.03.008. Epub 2018 Mar 21. Mol Metab. 2018. PMID: 29650350 Free PMC article.
-
The role of leptin in the transition from fetus to neonate.Proc Nutr Soc. 2001 May;60(2):187-94. doi: 10.1079/pns200086. Proc Nutr Soc. 2001. PMID: 11681634 Review.
-
Integration of sensory information via central thermoregulatory leptin targets.Physiol Behav. 2013 Sep 10;121:49-55. doi: 10.1016/j.physbeh.2013.02.014. Epub 2013 Feb 28. Physiol Behav. 2013. PMID: 23458626 Free PMC article. Review.
Cited by
-
Roles of leptin on energy balance and thermoregulation in Eothenomys miletus.Front Physiol. 2022 Dec 16;13:1054107. doi: 10.3389/fphys.2022.1054107. eCollection 2022. Front Physiol. 2022. PMID: 36589465 Free PMC article.
-
Obesity in male volcano mice Neotomodon alstoni affects the daily rhythm of metabolism and thermoregulation.Front Nutr. 2022 Aug 4;9:963804. doi: 10.3389/fnut.2022.963804. eCollection 2022. Front Nutr. 2022. PMID: 35990356 Free PMC article.
-
Zinc Supplementation Improved Neuropeptide Y, Nesfatin-1, Leptin, C-reactive protein, and HOMA-IR of Diet-Induced Obese Rats.Biol Trace Elem Res. 2022 Sep;200(9):3996-4006. doi: 10.1007/s12011-021-02987-6. Epub 2021 Oct 27. Biol Trace Elem Res. 2022. PMID: 34708332
-
Recent advances in understanding the role of leptin in energy homeostasis.F1000Res. 2020 May 27;9:F1000 Faculty Rev-451. doi: 10.12688/f1000research.24260.1. eCollection 2020. F1000Res. 2020. PMID: 32518627 Free PMC article. Review.
-
Leptin's crucial modulatory role in regulating body mass homeostasis of high-fat-fed striped field mice (Apodemus agrarius).Front Physiol. 2025 Aug 18;16:1592317. doi: 10.3389/fphys.2025.1592317. eCollection 2025. Front Physiol. 2025. PMID: 40901615 Free PMC article.
References
-
- Bates, S. H. , Stearns W. H., Dundon T. A., Schubert M., Tso A. W., Wang Y., et al. 2003. STAT3 signalling is required for leptin regulation of energy balance but not reproduction. Nature 421:856. - PubMed
-
- Commins, S. P. , Watson P. M., Padgett M. A., Dudley A., Argyropoulos G., and Gettys T. W.. 1999. Induction of uncoupling protein expression in brown and white adipose tissue by leptin. Endocrinology 140:292–300. - PubMed
-
- Commins, S. P. , Watson P. M., Frampton I. C., and Gettys T. W.. 2001. Leptin selectively reduces white adipose tissue in mice via a UCP1‐dependent mechanism in brown adipose tissue. Am. J. Physiol. Endocrinol. Metab. 280:E372–E377. - PubMed
Publication types
MeSH terms
Substances
LinkOut - more resources
Full Text Sources
Other Literature Sources
Medical

