. 2019 Jul 25;15(7):e1007907.
doi: 10.1371/journal.ppat.1007907. eCollection 2019 Jul.

Exosomes containing HIV protein Nef reorganize lipid rafts potentiating inflammatory response in bystander cells

Affiliations

Exosomes containing HIV protein Nef reorganize lipid rafts potentiating inflammatory response in bystander cells

Nigora Mukhamedova et al. PLoS Pathog. .

Abstract

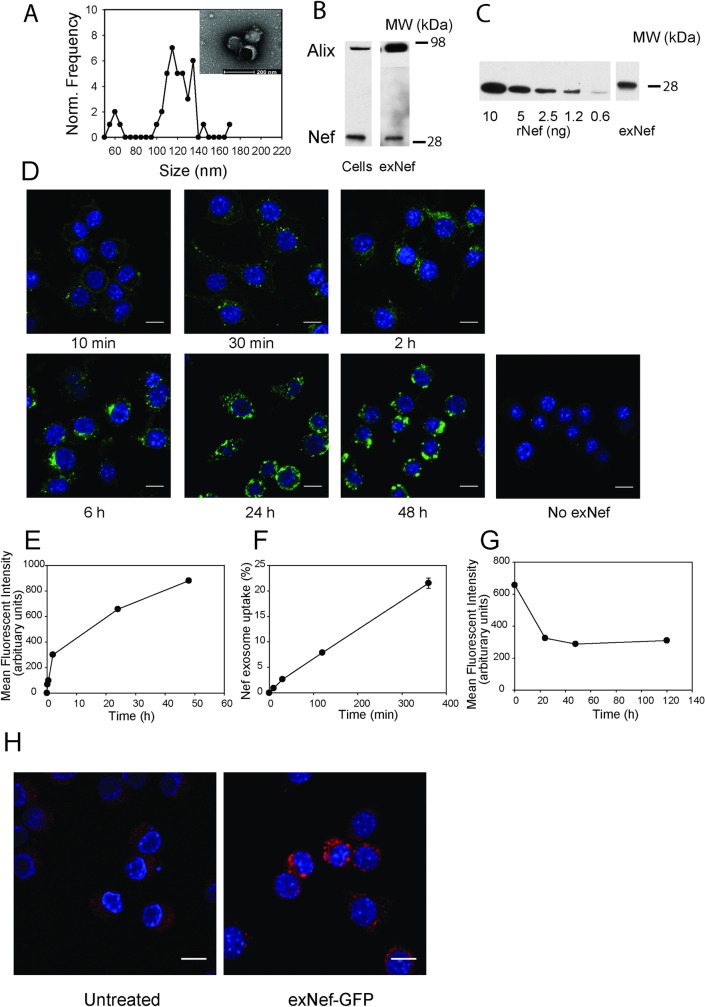
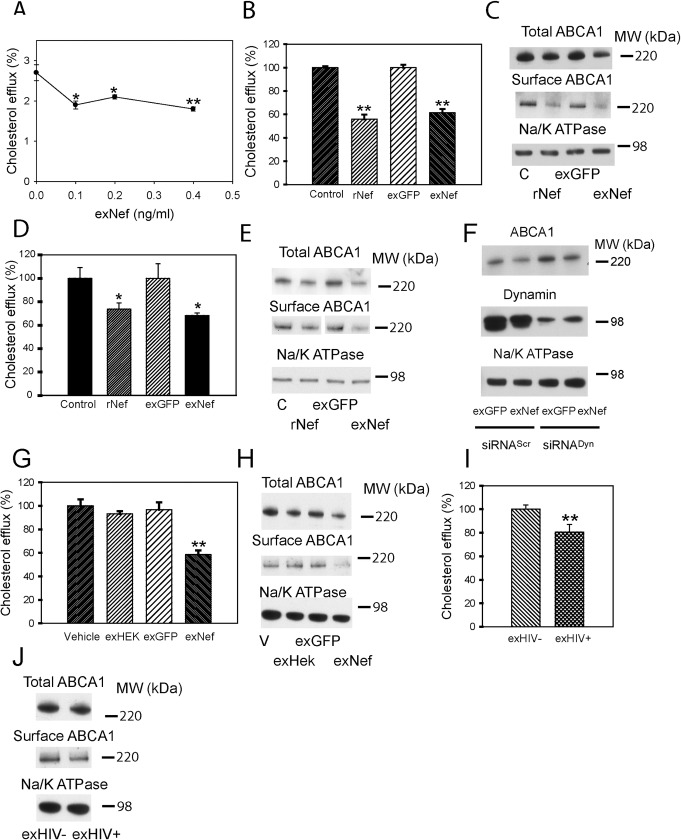
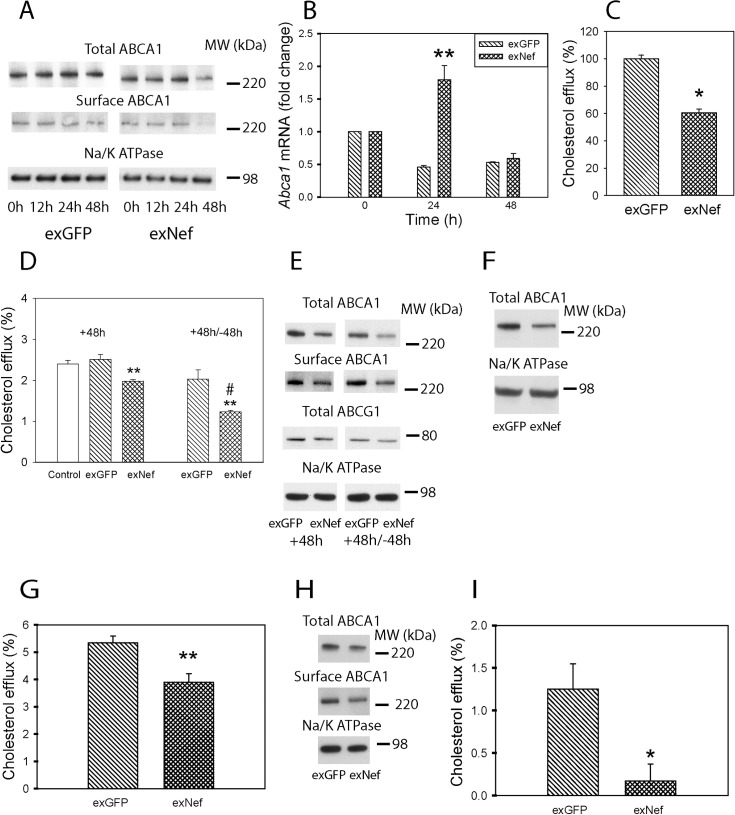
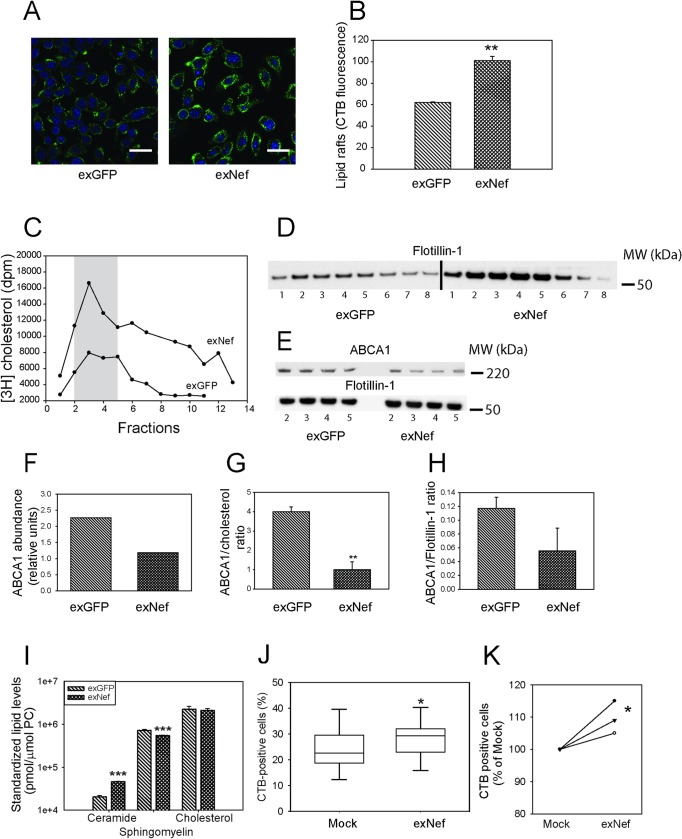
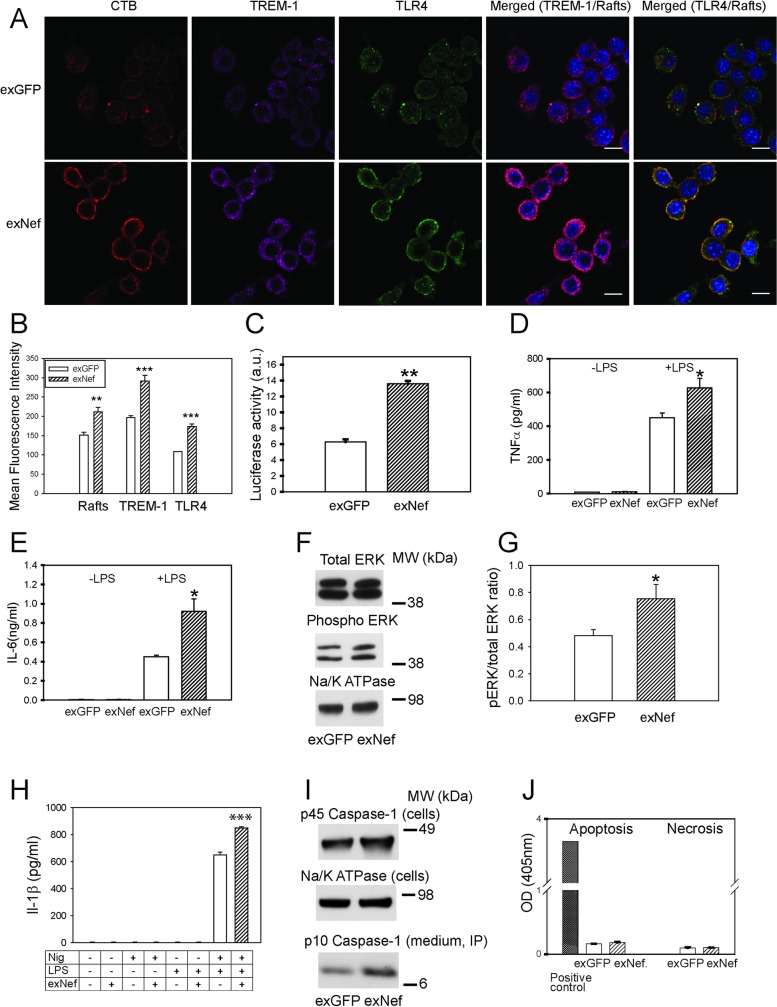
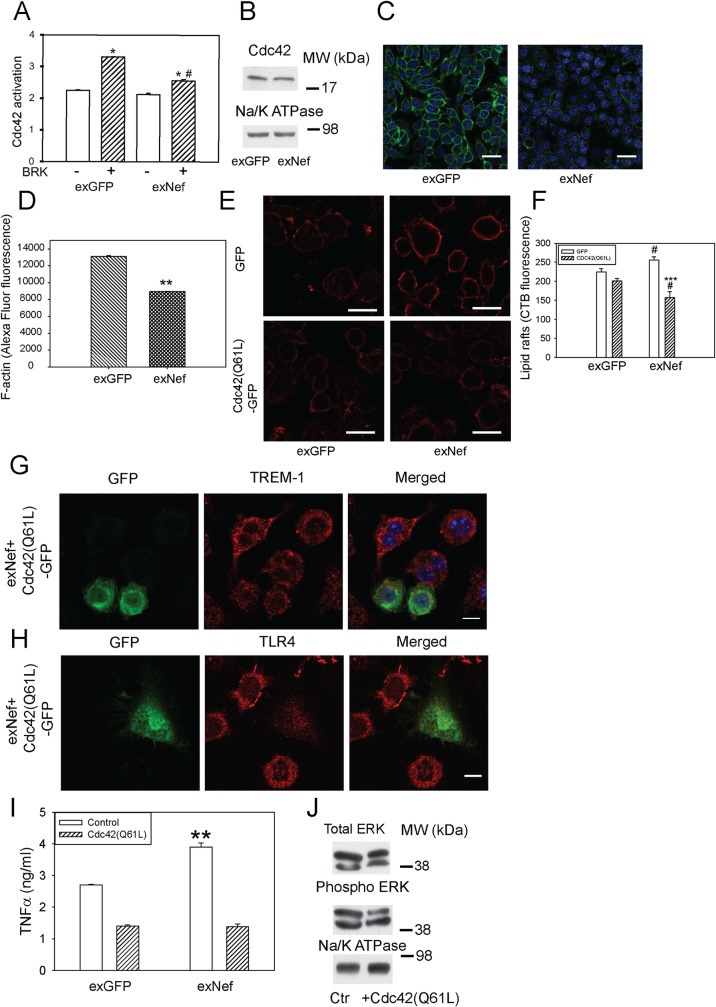
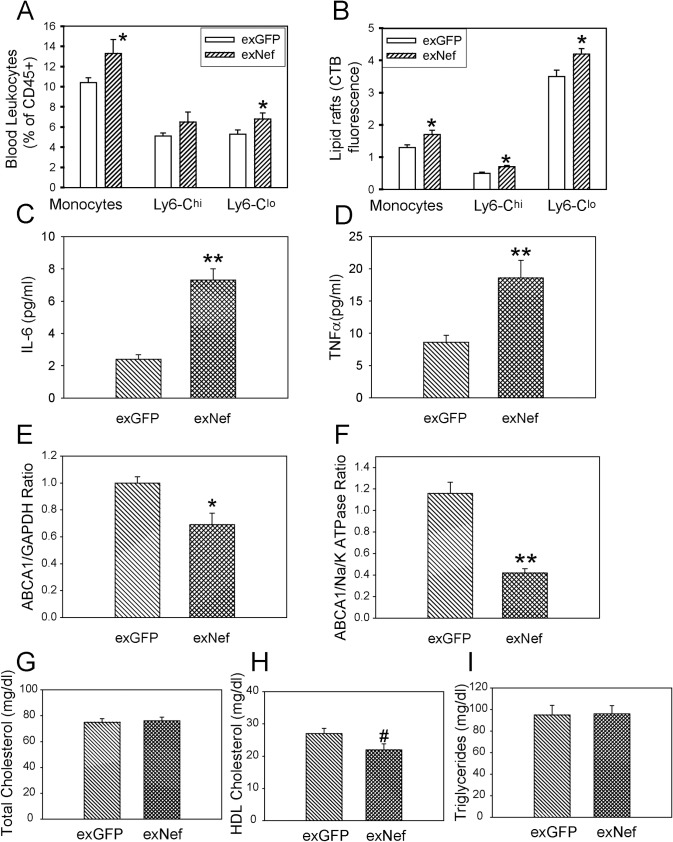
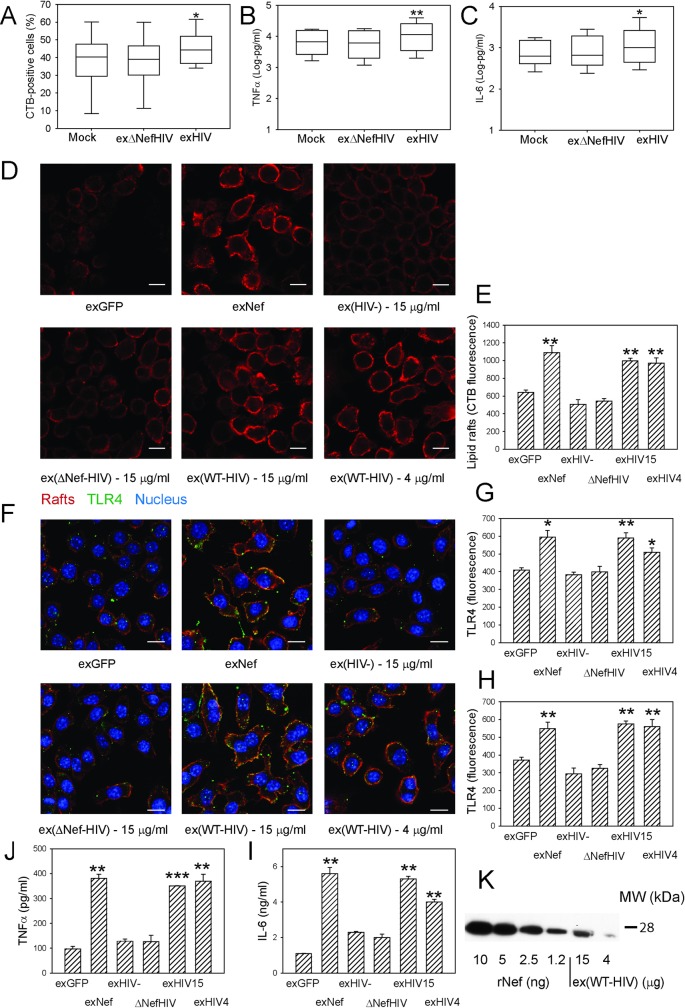
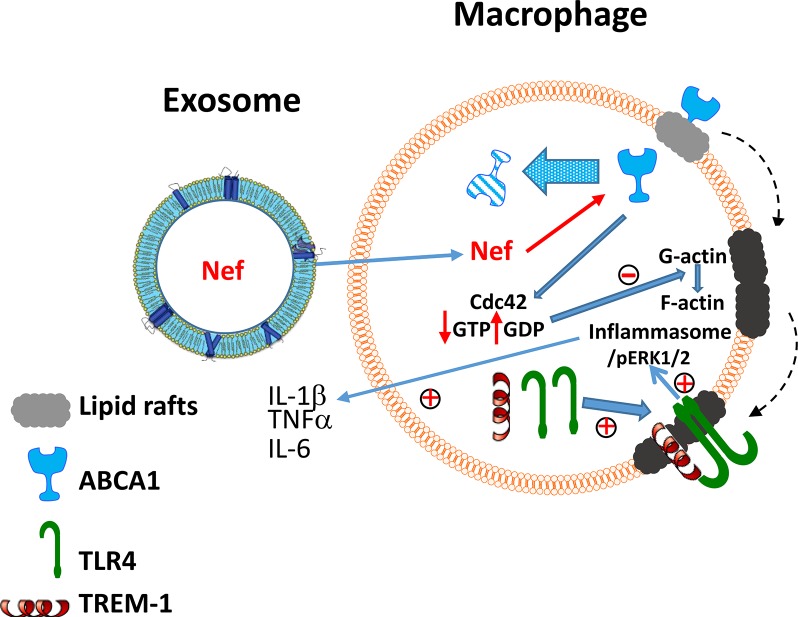
HIV infection has a profound effect on "bystander" cells causing metabolic co-morbidities. This may be mediated by exosomes secreted by HIV-infected cells and containing viral factors. Here we show that exosomes containing HIV-1 protein Nef (exNef) are rapidly taken up by macrophages releasing Nef into the cell interior. This caused down-regulation of ABCA1, reduction of cholesterol efflux and sharp elevation of the abundance of lipid rafts through reduced activation of small GTPase Cdc42 and decreased actin polymerization. Changes in rafts led to re-localization of TLR4 and TREM-1 to rafts, phosphorylation of ERK1/2, activation of NLRP3 inflammasome, and increased secretion of pro-inflammatory cytokines. The effects of exNef on lipid rafts and on inflammation were reversed by overexpression of a constitutively active mutant of Cdc42. Similar effects were observed in macrophages treated with exosomes produced by HIV-infected cells or isolated from plasma of HIV-infected subjects, but not with exosomes from cells and subjects infected with ΔNef-HIV or uninfected subjects. Mice injected with exNef exhibited monocytosis, reduced ABCA1 in macrophages, increased raft abundance in monocytes and augmented inflammation. Thus, Nef-containing exosomes potentiated pro-inflammatory response by inducing changes in cholesterol metabolism and reorganizing lipid rafts. These mechanisms may contribute to HIV-associated metabolic co-morbidities.


Conflict of interest statement

The authors have declared that no competing interests exist.

Figures

Fig 1
Fig 1. Nef-containing exosomes deliver Nef to macrophages.
A—Size distribution of the extracellular vesicles secreted by HEK293 cells determined by EM; Inset–EM micrograph of the vesicles; bar– 200 nm. B—Western blot for the exosomal marker Alix and Nef in cells and exosomes (exNef); C—Western blot for the indicated amounts of rNef and in a typical preparation of exNef (10 μg of exosomal protein); D, E–Time-course of exosome uptake quantitated by confocal microscopy; F–Time-course of exosome uptake quantitated by fluorimetry; percentage of added exosomes that was taken up is shown; G–Cells were incubated with exosomes for 48 h, excess exosomes was washed out and cells incubated for the indicated periods of time in exosome-free medum; retained fluorscence of the exosome stain PKH67 was assessed using confocal microscopy; H–Visualisation of Nef-GFP inside the cells after exposure to exNef-GFP (5 μg/ml of exosomal protein) after staining with anti-GFP antibody. Scale bars– 10 μm.
Fig 2
Fig 2. Exosomal Nef is more active than recombinant Nef.
A—Dose-dependence of the effect of exNef on cholesterol efflux after 48 h exposure. *p<0.05, **p<0.01 versus control; B—Comparison of the effects of rNef (100 ng/ml) and exNef (0.4 ng/ml) on cholesterol efflux after 48 h exposure; **p<0.01 versus control; C—Comparison of the effects of rNef (100 ng/ml) and exNef (0.4 ng/ml) on total and cell-surface ABCA1 after 48 h exposure (Western blot); D—Comparison of the effects of rNef (100 ng/ml) and exNef (0.4 ng/ml) on cholesterol efflux from murine bone marrow derived macrophages after 48 h exposure; *p<0.05 versus control; E—Comparison of the effects of rNef (100 ng/ml) and exNef (0.4 ng/ml) on total and cell-surface ABCA1 in murine bone marrow derived macrophages after 48 h exposure (Western blot); F–The effect of silencing of Dynamin– 2 on the effect of exNef on the abundance of total ABCA1 (Western blot). Mean ± SEM are shown on graphs (n = 4); G—Comparison of the effects of vehicle, exosomes produced by un-transfected cells (exHEK), exGFP, and exNef (0.4 ng/ml) on cholesterol efflux after 48 h exposure; **p<0.01 versus all other bars; H—Comparison of the effects of vehicle, exosomes produced by un-transfected cells (exHEK), exGFP, and exNef (0.4 ng/ml) on total and cell-surface ABCA1 after 48 h exposure (Western blot); I—Comparison of the effects of exosomes isolated from plasma of uninfected donors (exHIV-) and HIV-infected donors undergoing treatment with ART (exHIV+) (4 μg/ml of exosomal protein, 48 h) on cholesterol efflux; **p<0.01 versus exHIV-; J—Comparison of the effects of exosomes isolated from plasma of uninfected donors (exHIV-) and HIV-infected donors undergoing treatment with ART (exHIV+) (4 μg/ml of exosomal protein, 48 h) on total and cell-surface ABCA1 (Western blot).
Fig 3
Fig 3. ExNef modify cellular cholesterol metabolism.
A—Time-course of the effect of exNef (0.4 ng/ml) on the abundance of total and cell-surface ABCA1 (Western blot); B—Abundance of Abca1 mRNA (qRT-PCR) after exposure to exGFP or exNef (0.4 ng/ml); **p<0.01 versus exGFP; C–Average change in cholesterol efflux after exposure of cells to exGFP or exNef (0.4 ng/ml) for 48 h (*p<0.05, n = 6); D—Cholesterol efflux after exposure of cells to exGFP or exNef (0.4 ng/ml) for 48 h (left) or for 48 h followed by incubation without exosomes for another 48 h (right); #p<0.05 versus exNef 48 h, **p<0.01 versus exGFP; E—Abundance of total ABCG1 and total and cell-surface ABCA1 after exposure of cells to exGFP or exNef (0.4 ng/ml) for 48 h or for 48 h followed by incubation without exosomes for another 48 h (Western blot); F—Abundance of ABCA1 after co-cultivation of RAW264.7 cells with Nef or GFP producing HEK293 cells for 48 h (Western blot); G—Comparison of the effects of exGFP and exNef (0.4 ng/ml) on cholesterol efflux from THP-1 human monocyte-macrophages after 48 h exposure; **p<0.01 versus exGFP; H—Comparison of the effects of exGFP and exNef (0.4 ng/ml) on the abundance of total and cell surface ABCA1 in THP-1 human monocyte-macrophages after 48 h exposure (Western blot); I—Comparison of the effects of exGFP and exNef (0.4 ng/ml) on cholesterol efflux from human monocyte derived macrophages after 48 h exposure. *p<0.05 versus exGFP. Mean ± SEM are shown on graphs.
Fig 4
Fig 4. ExNef reorganize lipid rafts.
A–The effect of exNef (0.4 ng/ml, 48 h) on the abundance of lipid rafts in RAW 264.7 cells (cholera toxin subunit B (CTB) staining, confocal microscopy; Scale bars– 10 μm. B–Quantitation of the effect of exNef on the abundance of lipid rafts in RAW 264.7 cells by confocal microscopy (CTB staining); **p<0.01 versus exGFP; C—Amount of [3H]cholesterol in fractions of density gradient centrifugation (from top to bottom) of plasma membranes from exGFP or exNef treated RAW 264.7 cells. D–Abundance flotillin-1 in fractions of density gradient centrifugation (from top to bottom) of plasma membranes from exGFP or exNef treated RAW 264.7 cells (Western blot). E—Abundance of ABCA1 in raft fractions from exGFP or exNef treated RAW 264.7 cells (Western blot). F–Quantitation (densitimetry) of cummulative abundance of ABCA1 in raft fractions. G–Ratio of ABCA1 abundance to [3H]cholesterol counts in raft fractions; **p<0.01 versus exGFP; H–Ratio of abundancies of ABCA1 to flotillin-1 in raft fractions. I–Concentration of cholesterol, total ceramides and total sphyigomielin in isolated lipid rafts; ***p<0.001 versus exGFP J—Quantitation of the effect of exNef on the abundance of lipid rafts in human monocyte derived macrophages by flow cytometry (CTB staining); box plot of n = 6 is shown, *p<0.05. K—Quantitation of the effect of exNef on the abundance of lipid rafts in CD4+ T-cells by flow cytometry (CTB staining); n = 3, *p<0.05.
Fig 5
Fig 5. ExNef potentiate inflammatory signalling cascade via re-localization of TLR4 and TREM-1 to lipid rafts.
A–The effect of exNef (0.4 ng/ml, 48h) on the abundance of lipid rafts and re-localization of TLR4 and TREM-1 to the plasma membrane in RAW264.7 macrophages. Left column, CTB staining; second column, anti-TREM-1 staining; third column anti-TLR4 staining; fourth column–merge TREM-1/rafts, right column–merge TLR4/rafts. Scale bars 10 μm; B–Quantitation of the effect of exNef (0.4 ng/ml, 48 h) on the abundance of lipid rafts, TREM-1 and TRL4 at the plasma membrane. Mean ± SEM are shown; **p<0.01, ***p<0.001 versus exGFP; C–Bio-assay for inflammatory cytokines secreted by macrophages treated with exNef (0.4 ng/ml, 48 h) after stimulation with LPS (100 ng/ml of LPS for 18 h). Luminescence produced by SVEG/VCAM endothelial cells (stably transfected with luciferase under VCAM-1 promoter) is shown (see Methods for details). **p<0.001. D–The effect of exNef on TNFα secretion by human monocyte derived macrophages with or without stimulation with 1 ng/ml of LPS for 24 h; *p<0.05. E–The effect of exNef on IL-6 secretion by human monocyte derived macrophages with or without stimulation with 1 ng/ml of LPS for 24 h; *p<0.05. F–The effect of exNef (0.4 ng/ml, 48 h) on the abundance of total and phosphorylated ERK1/2 in RAW 264.7 macrophages (Western blot); G–Ratio of phosphorylated to total ERK1/2 (Western blots, n = 3, *p<0.05); H- Release of Il-1β from BMDM pre-treated with exNef (0.4 ng/ml, 48 h) and treated with LPS (100 ng/ml, 4 h)) and Nigericin (5μM, 3 h). Control cells were treated with exGFP; n = 4, ***p<0.001. I–The effect of exNef (0.4 ng/ml, 48 h) on the abundance of pro-caspase-1 in the BMDM cell lysate and of the cleaved p10 form immunoprecipitated from the cell culture medium (Western blot); J–The effect of exNef (0.4 ng/ml, 48 h) on apoptosis and necrosis in RAW 264.7 macrophages (TUNEL assay).
Fig 6
Fig 6. ExNef reorganize lipid rafts and potentiate inflammation via the ABCA1-Cdc42-actin axis.
A—The effect of exNef (0.4 ng/ml) on activation of Cdc42 by bradykinin (BRK, 100 ng/ml). Cdc42 activity was assessed by G-LISA, the assay detects concentration of GTP-bound (active) Cdc42. Mean ± SEM is shown; *p<0.05 versus non-activated cells; #p<0.01 versus activated cells treated with exGFP; (n = 4); B–The effect of exNef (0.4 ng/ml) on the abundance of total Cdc42 (Western blot). C–The effect of exNef (0.4 ng/ml, 48 h) on the abundance of F-actin (Alexa Fluor 488 Phalloidin staining); Scale bars– 10 μm. D–Quantitation of the effect of exNef on the abundance of F-actin. Mean ± SEM is shown; **p<0.01; E–The effect of transfection of cells with with GFP (top row) or Cdc42(Q61L)-GFP (bottom row) before exposure to exNef (0.4 ng/ml, 24 h) on the abundance of rafts (CTB staining, confocal microscopy); Scale bars– 10 μm. F–Quantitation of the effect of transfection of cells with GFP or Cdc42(Q61L)-GFP before exposure to exNef (0.4 ng/ml, 48 h) on the abundance of rafts (CTB staining, confocal microscopy); ***p<0.001 versus GFP-transfected cells; #p<0.05 versus corresponding exGFP-treated cells. G–The effect of transfection of cells with with Cdc42(Q61L)-GFP before exposure to exNef (0.4 ng/ml, 24 h) on the localization of TREM-1; left panel, Cdc42-GFP (transfected cells), middle panel, TREM-1, right panel, merge. Scale bars 10 μm; H–The effect of transfection of cells with with Cdc42(Q61L)-GFP before exposure to exNef (0.4 ng/ml, 24 h) on the localization of TLR4; left panel, Cdc42-GFP (transfected cells), middle panel, TLR4, right panel, merge. Scale bars 10 μm. I—The effect of transfection of cells with with Cdc42(Q61L)-GFP before exposure to exNef (0.4 ng/ml, 48 h) and stimulation with LPS (100 ng/ml, 18 h) on secretion of TNFα. Means ±SEM is shown; **p<0.01 versus exGFP. J—The effect of transfection of cells with Cdc42(Q61L) on the abundance of phosphorylated ERK1/2 in RAW 264.7 macrophages treated with exNef (0.4 ng/ml, 48 h) (Western blot).
Fig 7
Fig 7. ExNef modify lipid rafts and potentiate inflammation in vivo.
C57BL/6 mice were administered either exNef or exGFP (2μg, I.V.) 3 times a week, for a period of 2 weeks. A–Proportion of monocytes in blood (n = 9 per group), *p<0.05 versus exGFP; B—Flow cytometry analysis of raft abundance (CTB binding) in blood monocytes (n = 9 per group); *p<0.05 versus exGFP; C–Plasma IL-6 content (n = 8 per group); **p<0.01 versus exGFP; D–Plasma TNFα content (n = 8 per group); **p<0.01 versus exGFP; E—ABCA1 abundance in the liver homogenate determined by Western blot (n = 8 per group); *p<0.05 versus exGFP; F—ABCA1 abundance in the peritoneal macrophages determined by Western blot (n = 6 per group); **p<0.01 versus exGFP; G–Plasma total cholesterol content (n = 8 per group); H–Plasma HDL cholesterol content (n = 8 per group); #p = 0.05 versus exGFP, I–Plasma triglyceride content (n = 8 per group). Mean ± SEM are shown.
Fig 8
Fig 8. Exosomes from HIV-infected cells and plasma of HIV-infected subjects modify rafts and potentiate inflammation.
A–The effect of exosomes produced by human monocyte derived macrophages (MDM) infected with HIV (exHIV) or ΔNefHIV (exΔNefHIV) on the abundance of rafts in MDM measured with flow cytometry; 48 h incubation; box plot of n = 6 (six separate experiments with MDM from 6 different donors) is shown; *p<0.05 versus both Mock and exΔNefHIV; B–The effect of exosomes produced by human monocyte derived macrophages infected with HIV (exHIV) or ΔNefHIV (exΔNefHIV) on secretion of TNFα by MDM over 48 h; box plot of n = 6 is shown; **p<0.01 versus both Mock and exΔNefHIV; C–The effect of exosomes produced by human monocyte derived macrophages infected with HIV (exHIV) or ΔNefHIV (exΔNefHIV) on the secretion of IL-6 over 48 h incubation. N = 6, *p<0.05 versus both Mock and exΔNefHIV; D–The effect of exNef, exGFP and exosomes isolated from plasma of subjects infected with HIV (ex(WT-HIV)) or infected with Nef-deficient strain of HIV (ex(ΔNef-HIV)) or uninfected (ex(HIV-)) (15 μg/ml of exosomal protein except when 4 μg/ml is indicated, 48h) on the abundance of lipid rafts in RAW264.7 macrophages. Scale bars 10 μm; E–Quantitation of the effect of exosomes (as in A)) on the abundance of lipid rafts. Mean ± SEM are shown; **p<0.01 versus exGFP and ex(HIV-). F–The effect of exNef, exGFP and exosomes isolated from plasma of subjects infected with HIV (ex(WT-HIV)) or infected with Nef-deficient strain of HIV (ex(ΔNef-HIV)) or uninfected (ex(HIV-)) (15 μg/ml of exosomal protein except when 4 μg/ml is indicated, 48h) on the abundance and localization of lipid rafts (red) and TLR4 (green) in RAW264.7 macrophages. Scale bars 10 μm; G–Quantitation of the effect of exosomes (as in B)) on the total abundance of TLR4 in cells. Mean ± SEM are shown; *p<0.05, **p<0.01 versus exGFP and ex(HIV-). H–Quantitation of the effect of exosomes (as in B)) on the abundance of TLR4 in lipid raft regions. Mean ± SEM are shown; **p<0.01 versus exGFP and ex(HIV-/-); J–The effect of exNef, exGFP and exosomes isolated from plasma of subjects infected with HIV (ex(WT-HIV)) or infected with Nef-deficient strain of HIV (ex(ΔNef-HIV)) or uninfected (ex(HIV-)) (15 μg/ml of exosomal protein except when 4 μg/ml is indicated, 48h) and stimulation with 100 ng/ml LPS on secretion of TNFα by RAW264.7 macrophages over 1 h; Mean ± SEM are shown; **p<0.01, ***p<0.001; I–The effect of exNef, exGFP and exosomes isolated from plasma of subjects infected with HIV (ex(WT-HIV)) or infected with Nef-deficient strain of HIV (ex(ΔNef-HIV)) or uninfected (ex(HIV-)) (15 μg/ml of exosomal protein except when 4 μg/ml is indicated, 48h) and stimulation with 100 ng/ml LPS on secretion of IL-6 by RAW264.7 macrophages over 1 h; Mean ± SEM are shown; **p<0.01, ***p<0.001; K—Western blot for the indicated amounts of rNef and ex(WT-HIV) (μg of exosomal protein).
Fig 9
Fig 9. The proposed mechanism of the effect of exNef on inflammation.
Nef released in exosomes from HIV–infected cells is taken up by bystander cells where it reduces the amount of ABCA1 by previously described mechanisms: displacement of ABCA1 from rafts with subsequent degradation of ABCA1 and preventing interaction of newly synthesized ABCA1 with calnexin, also followed by its degradation. Reduction of ABCA1 inhibits activation of Cdc42, which in turn decreases formation of filamentous actin enhancing formation of lipid rafts. Increase in lipid raft abundance leads to recruitment into rafts of TREM-1 and TLR4, leading to the activation of TLR4, phosphorylation of ERK1/2, activation of inflammasomes and stimulation of secretion of pro-inflammatory cytokines.

References

    1. Peters B, Post F, Wierzbicki AS, Phillips A, Power L, Das S, et al. Screening for chronic comorbid diseases in people with HIV: the need for a strategic approach. HIV Med. 2013;14:1–11. - PubMed
    1. Giannarelli C, Klein RS, Badimon JJ. Cardiovascular implications of HIV-induced dyslipidemia. Atherosclerosis. 2011;219:384–389. 10.1016/j.atherosclerosis.2011.06.003 - DOI - PubMed
    1. Garg H, Mohl J, Joshi A. HIV-1 induced bystander apoptosis. Viruses. 2012;4:3020–3043. 10.3390/v4113020 - DOI - PMC - PubMed
    1. Sanyal A, Mailliard RB, Rinaldo CR, Ratner D, Ding M, Chen Y, et al. Novel assay reveals a large, inducible, replication-competent HIV-1 reservoir in resting CD4+ T cells. Nat Med. 2017;23:885–889. 10.1038/nm.4347 - DOI - PMC - PubMed
    1. Lorenzo-Redondo R, Fryer HR, Bedford T, Kim EY, Archer J, Kosakovsky Pond SL, et al. Persistent HIV-1 replication maintains the tissue reservoir during therapy. Nature. 2016;530:51–56. 10.1038/nature16933 - DOI - PMC - PubMed

Publication types

MeSH terms

Substances