Comparative Study
. 2019 Jul 24;9(1):24-34.e10.
doi: 10.1016/j.cels.2019.06.006.

Before and After: Comparison of Legacy and Harmonized TCGA Genomic Data Commons' Data

Affiliations
Comparative Study

Before and After: Comparison of Legacy and Harmonized TCGA Genomic Data Commons' Data

Galen F Gao et al. Cell Syst. .

Abstract

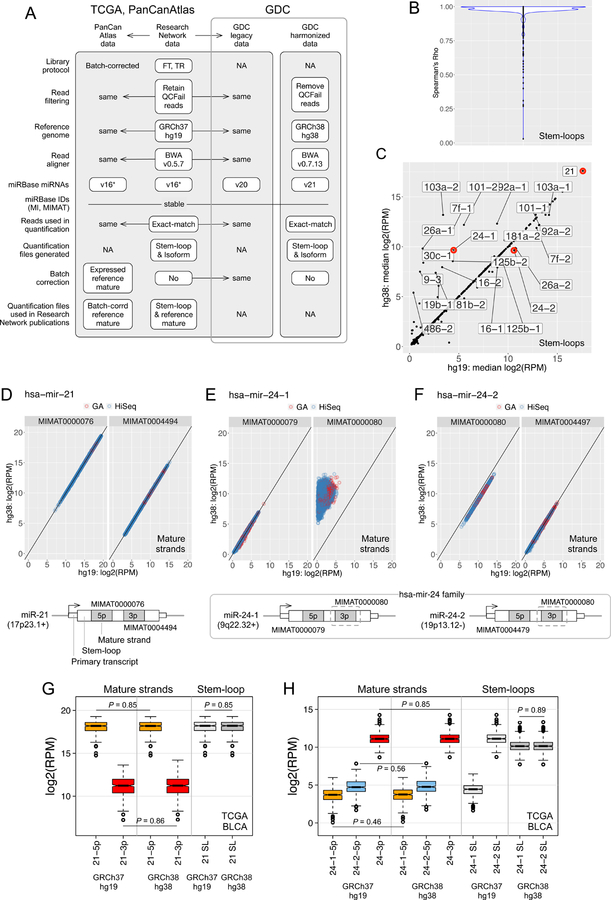
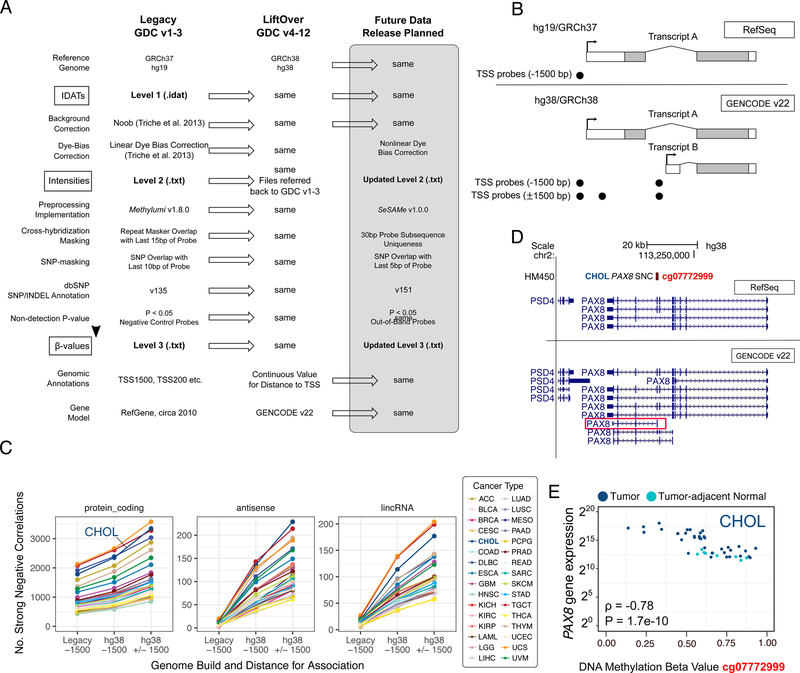
We present a systematic analysis of the effects of synchronizing a large-scale, deeply characterized, multi-omic dataset to the current human reference genome, using updated software, pipelines, and annotations. For each of 5 molecular data platforms in The Cancer Genome Atlas (TCGA)-mRNA and miRNA expression, single nucleotide variants, DNA methylation and copy number alterations-comprehensive sample, gene, and probe-level studies were performed, towards quantifying the degree of similarity between the 'legacy' GRCh37 (hg19) TCGA data and its GRCh38 (hg38) version as 'harmonized' by the Genomic Data Commons. We offer gene lists to elucidate differences that remained after controlling for confounders, and strategies to mitigate their impact on biological interpretation. Our results demonstrate that the hg19 and hg38 TCGA datasets are very highly concordant, promote informed use of either legacy or harmonized omics data, and provide a rubric that encourages similar comparisons as new data emerge and reference data evolve.

Keywords: DNA methylation; The Cancer Genome Atlas; human reference genome; mRNA expression; microRNA expression; quality control; somatic copy number alteration; somatic mutation.


Conflict of interest statement

Declaration of Interests

The authors declare no competing interests.

Figures

Figure 1.
Figure 1.. MiRNA-seq data processing and data comparison in TCGA Legacy and the GDC
A) Overview of processing steps (rows) and data sets (columns). GDC legacy data and PanCancer Atlas data were derived from the TCGA quantification-level data. GDC harmonized data were regenerated from TCGA sequence data, using an updated version of the TCGA sequence data processing pipeline10. QC comparisons were done between legacy TCGA hg19 and GDC hg38 harmonized data. Library construction protocols: FT: the flow-through from poly(A) mRNA purification, and TR: Total RNA. Asterisks indicate that while the source data were generated using v16 miRBase annotations, names reported for stem-loops and 5p/3p mature strands, in TCGA publications, may be from a more recent miRBase version; in contrast to names, miRBase MI and MIMAT identifiers are stable. B-F) Results of QC comparisons for GDC miRNA-seq data. B) Distribution of rank correlation coefficients for hg19 vs. hg38 reads-per-million normalized abundance (RPMs) for stem-loops across all cancer types and miRNAs. C) Comparison of hg19 vs. hg38 median RPMs for stem-loops. The red circles highlight has-mir-21 and two hsa-mir-24 family members, see (D-F). D-F) RPM comparisons for mature strands. Dots represent samples, and are colored to indicate the sequencing instrument (GAII or HiSeq). Schematics below the RPM scatterplots show miRNA stem-loops and cytoband locations for hsa-mir-21, and for hsa-mir-24 family’s hsa-mir-24–1 and -2. Dashed lines highlight the 3p mature strand, MIMAT000080, whose reference sequence is identical in each family. G,H) Distributions of RPMs for legacy (GRCh37/hg19) and harmonized (GRCh38/hg38) mature strands and stem-loops, for primary tumours from the TCGA muscle-invasive bladder cancer (BLCA) cohort (n=409): G) has-mir-21, H) has-mir-24–1 and -2. P values are from Wilcoxon test. ‘SL’: stem-loop. See also Table S1.
Figure 2:
Figure 2:. Somatic copy number processing and data comparison in TCGA Legacy and the GDC
A) Affy SNP array copy number pipeline: other than lifting probe loci over to hg38, the pipeline was identical for hg19 and hg38. Probesets used to create Level 3 hg19 and hg38 data were not identical in that 14811 (0.8%) probes that could not be uniquely mapped in hg38 were not used in segmentation. B) Genes sorted by number of cancer types in which each gene is “deviant” (as defined earlier). We observe a very small subset of genes that are deviant in more than a few cancer disease types. C) Distribution of SCNA disagreements for 20,616 genes between the hg19-aligned run and the hg38-aligned run for 33 TCGA tumor types ordered by increasing median fraction. Boxes are colored by median number of recurrent SCNAs (listed in parentheses) in each tumor type as determined by GISTIC2.0 with the hg19 reference build. See also Figure S1.
Figure 3:
Figure 3:. DNA methylation processing and data comparison in TCGA Legacy and the GDC
A) Summary of HM27/HM450 processing differences between legacy (hg19, GDCv1–3) and current (hg38, GDCv4–12) versions, and an upcoming version available for manual download in the GDC Community Tools repository (see supplement for details). B) Associating array features with genes in the hg19 and hg38 pipelines: hg19 used the RefSeq version 40 annotations from the Illumina HM450 manifest, and only associated probes within 1,500 bp upstream of a transcript start site (“TSS -1500”); hg38 used GENCODE 22 annotations, and includes distance from the nearest TSS, which can be used to associate probes both upstream or downstream from a TSS (“TSS +/−1500”). GENCODE 22 often includes additional alternative promoters for the same gene. C) Number of Strong Negative Correlations (SNCs) between DNA methylation beta value and RNA expression, using different associations: “Legacy -1500” used hg19 associations, “hg38 – 1500” used hg38 annotations but only upstream associations, and “hg38 +/−1500” used the same annotations but both upstream and downstream associations. The number of SNCs increased for all transcript types (only three shown here). D) Example of a new alternative promoter for PAX8 present in hg38 annotations but not hg19, which also coincided with an SNC identified in the hg38 but not hg19 version. E) Methylation vs. expression for this SNC (cg07772999-PAX8) across all TCGA-CHOL samples - about 50% of tumors are demethylated at this alternative promoter and overexpress PAX8. See also Figure S2, Tables S2–S5.
Figure 4:
Figure 4:. mRNA-Seq processing and data comparison in TCGA Legacy and the GDC
(A) Outline of bioinformatic pipeline steps for TCGA Legacy (hg19) and current GDC (hg38) data. All aspects of sample processing differ including computational methods, the reference genome, reference transcriptome. (B) The distribution of sample rank correlation coefficients between matched samples of the two data versions from the BRCA cohort (n=1205). Correlation estimates arise from comparing gene level counts of the Legacy RSEM output to gene level counts from the Current htseq-count workflow. C) Comparison of log ratios between Legacy and Current for the BRCA basal versus non-basal comparison. Each point represents the log ratio of subtypes (basal / non-basal) from the Legacy (x-axis) or Current (y-axis) workflow. Genes exhibiting > 1.5-fold change in either direction are highlighted in red. Log ratio estimates were derived from upper quartile normalized gene level estimates for the Legacy workflow and FPKM transformed gene level estimates from the Current workflow. Log (base 2) ratios between subtypes demonstrate large changes across many genes, while changes between workflows are far fewer in both number and magnitude. See also Figure S3.
Figure 5:
Figure 5:. Somatic mutation processing and data comparison in TCGA Legacy and the GDC
(A) Outline of pipeline steps for TCGA MC3 (hg19) and current (v12) GDC release (hg38). (B) Overlapping somatic mutation calls between GDC and MC3. Red and blue shaded regions represent the public somatic SNV calls unique in GDC and MC3 respectively. The lighter red and blue shaded regions represent the unrecoverable calls that were available in the public call of one group but were not found in neither public nor protected calls of the other group. (C) The overlap of somatic mutation call per sample in four different cancer types. The X and Y axes represent the proportion of shared calls over the total calls from GDC and MC3 respectively. Each dot represents a sample, and the dot size indicates the numbers of somatic SNVs called. A sample has more GDC-unique or MC3-unique calls is closer to the origin. The color indicates whether WGA sequencing was employed. See also Figure S4.

References

    1. Anders S, Pyl PT, and Huber W (2015). HTSeq--a Python framework to work with high-throughput sequencing data. Bioinformatics 31, 166–169. - PMC - PubMed
    1. Bibikova M, Barnes B, Tsan C, Ho V, Klotzle B, Le JM, Delano D, Zhang L, Schroth GP, Gunderson KL, et al. (2011). High density DNA methylation array with single CpG site resolution. Genomics 98, 288–295. - PubMed
    1. Bodini M, Ronchini C, Giaco L, Russo A, Melloni GE, Luzi L, Sardella D, Volorio S, Hasan SK, Ottone T, et al. (2015). The hidden genomic landscape of acute myeloid leukemia: subclonal structure revealed by undetected mutations. Blood 125, 600–605. - PMC - PubMed
    1. Bowen NJ, Logani S, Dickerson EB, Kapa LB, Akhtar M, Benigno BB, and McDonald JF (2007). Emerging roles for PAX8 in ovarian cancer and endosalpingeal development. Gynecol Oncol 104, 331–337. - PubMed
    1. Brinkmann U, Vasmatzis G, Lee B, and Pastan I (1999). Novel genes in the PAGE and GAGE family of tumor antigens found by homology walking in the dbEST database. Cancer Res 59, 1445–1448. - PubMed

Publication types

LinkOut - more resources