Multicenter Study
. 2020 Jan;87(1):137-145.
doi: 10.1038/s41390-019-0503-8. Epub 2019 Jul 25.

Image-based β-adrenergic sweat rate assay captures minimal cystic fibrosis transmembrane conductance regulator function

Affiliations
Multicenter Study

Image-based β-adrenergic sweat rate assay captures minimal cystic fibrosis transmembrane conductance regulator function

Danieli Barino Salinas et al. Pediatr Res. 2020 Jan.

Abstract

Background: There is a need to prognosticate the severity of cystic fibrosis (CF) detected by newborn screening (NBS) by early assessment of CF transmembrane conductance regulator (CFTR) protein function. We introduce novel instrumentation and protocol for evaluating CFTR activity as reflected by β-adrenergically stimulated sweat secretion.

Methods: A pixilated image sensor detects sweat rates. Compounds necessary for maximum sweat gland stimulation are applied by iontophoresis, replacing ID injections. Results are compared to a validated β-adrenergic assay that measures sweat secretion by evaporation (evaporimetry).

Results: Ten healthy controls (HC), 6 heterozygous (carriers), 5 with CFTR-related metabolic syndrome (CRMS)/CF screen-positive, inconclusive diagnosis (CFSPID), and 12 CF individuals completed testing. All individuals with minimal and residual function CFTR mutations had low ratios of β-adrenergically stimulated sweat rate to cholinergically stimulated sweat rate (β/chol) as measured by either assay.

Conclusions: β-Adrenergic assays quantitate CFTR dysfunction in the secretory pathway of sweat glands in CF and CRMS/CFSPID populations. This novel image-sensor and iontophoresis protocol detect CFTR function with minimal and residual function and is a feasible test for young children because it is insensible to movement and it decreases the number of injections. It may also assist to distinguish between CF and CRMS/CFSPID diagnosis.


Conflict of interest statement

Disclosure: Authors have no conflicts of interest referable to this research.

Figures

Figure 1:
Figure 1:
The two images on the left depicts the traditional sweat chloride test that distinguishes between normal and CF phenotypes on the basis of the differences in concentration of chloride in the final sweat. Sweating is stimulated by the iontophoresis of a cholinergic stimulus (typically pilocarpine), which triggers both normal and CF glands equally. The normal duct readily reabsorbs NaCl, resulting in the output of hypotonic sweat. In contrast, the CF duct poorly reabsorbs NaCl, yielding sweat with abnormally high NaCl concentrations. The images on the right show the ratiometric sweat rate test; it distinguishes CF from normal based on the defective secretory functions of the CFTR-mediated adrenergic pathway. That is, when an adrenergic stimulus is applied independent of cholinergic stimulus in a normal gland (i.e. cholinergic stimulus is blocked by atropine), sweat is secreted via CFTR-dependent pathway. Because CFTR function is defective in the CF gland, the volume of sweat secreted is significantly decreased or absent. The ratiometric sweat rate test uses the adrenergic sweat rate normalized by the individual’s cholinergic sweat rate (hence, “ratiometric”) to account for variability in sweat gland density and individual sensitivity to sweat gland stimulation. A higher adrenergic-to-cholinergic ratio indicates better in vivo CFTR functional activity while a lower ratio indicates impaired CFTR function.
Figure 2:
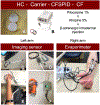
Figure 2:. Diagram of the study protocol and equipment.
Drugs were administered identically on both arms: Pilocarpine 1% by Iontophoresis →Atropine 5% by Iontophoresis → β-adrenergic cocktail (Atropine 8.8 μg, Aminophylline 940 μg, and Isoproterenol 8.0 μg) by intradermal injection. A = drug soaked felt patches for iontophoresis; B = Sweat Inducer (A and B were applied to both sides); C, D, and E = Image-Sensor; F = Pressure sensor; and G = cyber-Derm Evaporimeter and Evaporimeter probes as applied.
Figure 3:
Figure 3:. Analysis of the image sequence during a sweat stimulation protocol and evaluation of the sweat rate with the image sensor.
Panel A shows the sequence of images acquired every 5 seconds during the sweat stimulation protocol. Images collected during baseline conditions are sampled first and are followed by images collected after cholinergic stimulation. The sensor is briefly removed from the measurement site to allow for pilocarpine iontophoresis between the two sequences. The baseline image acquired 50 seconds after the start of the sequence is examined visually after the data collection is completed to select the largest region of interest (ROI) free of artifacts and edge effects (B). The mean and standard deviation of the grey levels of all pixels in the ROI are computed to estimate a grey level threshold above which a change in the image associated with detection of sweat is measured above the background grey level. In this example, the grey level threshold is 30 on a scale 0–255 where 0 corresponds to white and 255 to black. On panel C, a typical image collected during cholinergic stimulation displays spotty dark regions in the ROI that correspond to the production of sweat. Panel D shows the number of pixels on this image (ordinate) for each grey level between 0 and 255 (abscissa). As more dark spots appear on the image collected during the sweat stimulation sequence, the image shows more and more pixels with elevated grey levels above the threshold. Thus, the right side of the curve gradually rises above 0 and the area under the curve (hashed) increases. The threshold level (30 in the example) is subtracted from each image in the sequence to correct for the background grey level of the image. The sum of all pixel intensities above the threshold (hashed area under the curve) is computed as a measure of the darkness of the image in the ROI. Panel E shows a plot of the area under the curve in each image (hashed line) as a function of time. The steepest slope of the curve corresponds to the fastest change in image darkness and is used to represent the maximum rate of sweat production measured with the image sensor. Because different image collection sequences had ROIs of different sizes, the hashed area under the curve in panels D and E is scaled by the size of the ROI expressed in mm2 (right vertical scale). Panel E also shows the evaporimeter readings (solid line, left vertical scale) collected on the contralateral site. The maximum rate of sweat evaporation measured by the evaporimeter is observed when the evaporimeter output is maximum and near flat.
Figure 4:
Figure 4:
Sweat glands identified by imaging sensor. Mapping shows the same glands were stimulated after cholinergic stimulation (A) and after β-adrenergic stimulation (B).
Figure 5:
Figure 5:
Individual ratios between maximum sweat rate in response to β-adrenergic and cholinergic stimulation, measured by the image sensor in heterozygotes for one CFTR mutation (Carrier), cystic fibrosis screen positive, inconclusive diagnosis (CFSPID), and CF subjects. The abscissa shows subjects’ genotype with corresponding CFTR functional classification below.
Figure 6:
Figure 6:
β-adrenergic and cholinergic ratio in natural log from Evaporimeter and Image-Sensor measurements in all 4 groups non-CF healthy controls (HC), heterozygotes for one CFTR mutation (Carrier), cystic fibrosis screen positive, inconclusive diagnosis (CFSPID), and CF subjects. Letters denote significant comparisons. Evaporimeter: a = HC vs CFSPID (p<0.0001), b = HC vs CF (p<0.0001), c = Carrier vs CFSPID (p=0.001), d = Carrier vs CF (p<0.0001), and e = CFSPID vs CF (p=0.026). Image-Sensor: f = HC vs CFSPID (p<0.0001), g = HC vs CF (p<0.0001), h = Carrier vs CFSPID (p<0.0001), i = Carrier vs CF (p<0.0001), and j = CFSPID vs CF (p=0.022).

References

    1. Wainwright CE, Elborn JS, Ramsey BW. Lumacaftor-Ivacaftor in Patients with Cystic Fibrosis Homozygous for Phe508del CFTR. N Engl J Med. 2015;373(18):1783–4. - PubMed
    1. Quinton PM. Cystic fibrosis: lessons from the sweat gland. Physiology (Bethesda). 2007;22:212–25. - PubMed
    1. Shwachman H, Mahmoodian A. Pilocarpine iontophoresis sweat testing results of seven years’ experience. Bibl Paediatr. 1967;86:158–82. - PubMed
    1. Farrell PM, White TB, Ren CL, et al. Diagnosis of Cystic Fibrosis: Consensus Guidelines from the Cystic Fibrosis Foundation. J Pediatr. 2017;181S:S4–S15 e1. - PubMed
    1. Terlizzi V, Carnovale V, Castaldo G, et al. Clinical expression of patients with the D1152H CFTR mutation. J Cyst Fibros. 2015;14(4):447–52. - PubMed

Publication types

MeSH terms

Substances