. 2019 Jul 24;11(8):678.
doi: 10.3390/v11080678.

Evaluation of Diagnostic Performance of Three Indirect Enzyme-Linked Immunosorbent Assays for the Detection of IgG Antibodies to Ebola Virus in Human Sera

Affiliations

Evaluation of Diagnostic Performance of Three Indirect Enzyme-Linked Immunosorbent Assays for the Detection of IgG Antibodies to Ebola Virus in Human Sera

Janusz T Paweska et al. Viruses. .

Abstract

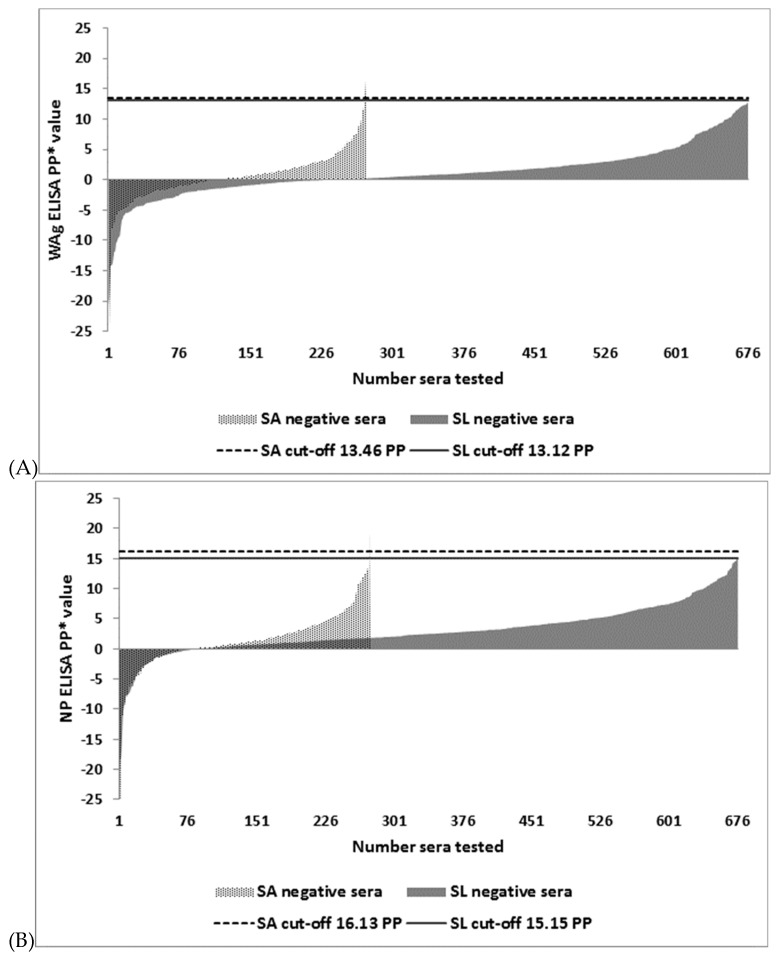
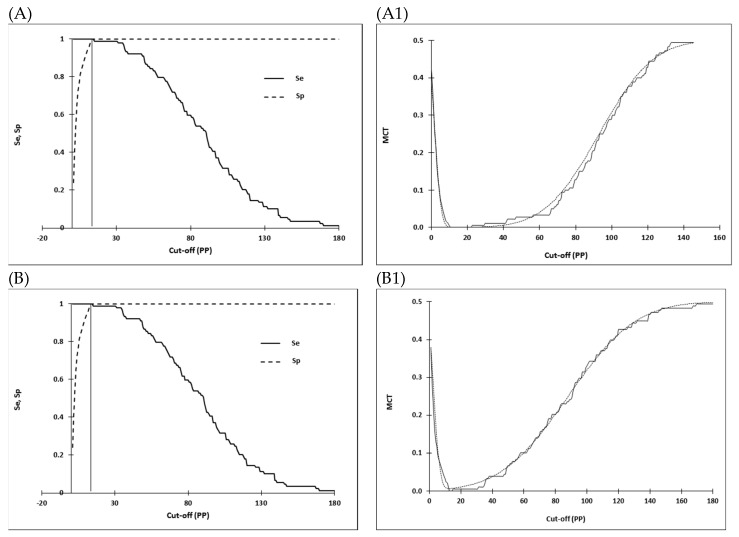
Filovirus serological diagnosis and epidemiological investigations are hampered due to the unavailability of validated immunoassays. Diagnostic performance of three indirect enzyme-linked immunosorbent assays (I-ELISA) was evaluated for the detection of IgG antibody to Ebola virus (EBOV) in human sera. One I-ELISA was based on a whole EBOV antigen (WAg) and two utilized recombinant nucleocapsid (NP) and glycoproteins (GP), respectively. Validation data sets derived from individual sera collected in South Africa (SA), representing an EBOV non-endemic country, and from sera collected during an Ebola disease (EBOD) outbreak in Sierra Leone (SL), were categorized according to the compounded results of the three I-ELISAs and real time reverse-transcription polymerase chain reaction (RT-PCR). At the cut-off values selected at 95% accuracy level by the two-graph receiver operating characteristic analysis, specificity in the SA EBOV negative serum panel (n = 273) ranged from 98.17% (GP ELISA) to 99.27% (WAg ELISA). Diagnostic specificity in the SL EBOV negative panel (n = 676) was 100% by the three ELISAs. The diagnostic sensitivity in 423 RT-PCR confirmed EBOD patients was dependent on the time when the serum was collected after onset of disease. It significantly increased 2 weeks post-onset, reaching 100% sensitivity by WAg and NP and 98.1% by GP I-ELISA.

Keywords: Ebola virus; IgG antibody; diagnostic performance; enzyme-linked immunosorbent assay; glycoprotein; human serum; nucleocapsid; whole antigen.


Conflict of interest statement

The authors declare no conflict of interest. The funders had no role in the design of the study; in the collection, analyses, or interpretation of data; in the writing of the manuscript, or in the decision to publish the results.

Figures

Figure 1
Figure 1
Distribution of percentage positivity (PP) values in South African (SA) and Sierra Leonean (SL) Ebola virus (EBOV) immunoglobulin G (IgG) negative human sera and selection of cut-off values for (A) the whole antigen (WAg), (B) nucleocapsid protein (NP) and (C) glycoprotein (GP) based ELISAs. Cut-off value for each assay was calculated as mean plus three standard deviations of ELISA PP (percentage positivity of internal positive control serum) values recorded by each test in 273 SA and 676 SL EVD negative sera, respectively.
Figure 1
Figure 1
Distribution of percentage positivity (PP) values in South African (SA) and Sierra Leonean (SL) Ebola virus (EBOV) immunoglobulin G (IgG) negative human sera and selection of cut-off values for (A) the whole antigen (WAg), (B) nucleocapsid protein (NP) and (C) glycoprotein (GP) based ELISAs. Cut-off value for each assay was calculated as mean plus three standard deviations of ELISA PP (percentage positivity of internal positive control serum) values recorded by each test in 273 SA and 676 SL EVD negative sera, respectively.
Figure 2
Figure 2
Optimization of cut-offs for Wag (A), nucleocapsid (B) and glycoprotein (C) ELISAs using the two-graph receiver operating characteristic analysis (TG-ROC). The insertion point of the sensitivity (Se, smooth line) and specificity (Sp, dashed line) graphs represents a cut-off PP value (13.53, 16.44 and 26.28, respectively) at which the highest and equivalent test parameters (Se = Sp) are achieved at 95% accuracy level. Using the misclassification cost term (MCT) option of the TG-ROC, at these cut-of values, the overall misclassification costs for WAg (A1), NP (B1), and GP ELISA (C1) become minimal (0.0003, 0.0069, 0.0001, respectively) under assumption of 50% disease prevalence and equal costs of false-positive and false-negative results. The two MCT curves represent values based on non-parametric (dashed line) or parametric (smooth line) estimates of Se and Sp derived from data sets analyzed. Optimization of cut-off values was based on the non-parametric program option due to departure from a normal distribution of data analyzed. Cut-off values are expressed as percentage positivity (PP) of an internal positive serum control.
Figure 2
Figure 2
Optimization of cut-offs for Wag (A), nucleocapsid (B) and glycoprotein (C) ELISAs using the two-graph receiver operating characteristic analysis (TG-ROC). The insertion point of the sensitivity (Se, smooth line) and specificity (Sp, dashed line) graphs represents a cut-off PP value (13.53, 16.44 and 26.28, respectively) at which the highest and equivalent test parameters (Se = Sp) are achieved at 95% accuracy level. Using the misclassification cost term (MCT) option of the TG-ROC, at these cut-of values, the overall misclassification costs for WAg (A1), NP (B1), and GP ELISA (C1) become minimal (0.0003, 0.0069, 0.0001, respectively) under assumption of 50% disease prevalence and equal costs of false-positive and false-negative results. The two MCT curves represent values based on non-parametric (dashed line) or parametric (smooth line) estimates of Se and Sp derived from data sets analyzed. Optimization of cut-off values was based on the non-parametric program option due to departure from a normal distribution of data analyzed. Cut-off values are expressed as percentage positivity (PP) of an internal positive serum control.
Figure 3
Figure 3
Mean IgG responses in 423 Ebola disease patients measured by a whole antigen (WAg), nucleocapsid (NP), and glycoprotein (GP) indirect ELISAs at different time post disease onset.
Figure 4
Figure 4
Dose-response kinetics of a positive EBOV IgG human serum before and after different inactivation procedures measured by a whole antigen (Wag), (A); nucleocapsid (NP), (B); and glycoprotein (GP), (C) indirect ELISA. 1 Percent positivity of internal positive control serum.
Figure 4
Figure 4
Dose-response kinetics of a positive EBOV IgG human serum before and after different inactivation procedures measured by a whole antigen (Wag), (A); nucleocapsid (NP), (B); and glycoprotein (GP), (C) indirect ELISA. 1 Percent positivity of internal positive control serum.

References

    1. Kuhn J.H., Adachi T., Adhikari N.K.J., Arribas J.R., Bah I.E., Bausch D.G., Bhadelia N., Borchert M., Broch Brantsaeter A., Brett-Major D.M., et al. New filovirus disease classification and nomenclature. Nat. Rev. Microbiol. 2019;17:261–263. doi: 10.1038/s41579-019-0187-4. - DOI - PMC - PubMed
    1. Muyembe-Tamfum J.J., Mulangu S., Masumu J., Kayembe J.M., Kemp A., Paweska J.T. Ebola virus outbreaks in Africa: Past and present. Onderstepoort J. Vet. Res. 2012;79:451. doi: 10.4102/ojvr.v79i2.451. - DOI - PubMed
    1. Baize S., Pannetier D., Oestereich L., Rieger T., Koivogui L., Magassouba N., Soropogui B., Sow M.S., Keita S., de Clerck H., et al. Emergence of Zaire Ebola virus disease in Guinea. N. Engl. J. Med. 2014;371:1418–1425. doi: 10.1056/NEJMoa1404505. - DOI - PubMed
    1. Briand S., Bertherat E., Cox P., Formenty P., Kieny M.P., Myhre J.K., Roth C., Shindo N., Dye C. The international Ebola emergency. N. Engl. J. Med. 2014;371:1180–1183. doi: 10.1056/NEJMp1409858. - DOI - PubMed
    1. WHO Ebola Response Team Ebola virus disease in West Africa—the first 9 months of the epidemic and forward projections. N. Engl. J. Med. 2014;371:1481–1495. doi: 10.1056/NEJMoa1411100. - DOI - PMC - PubMed

Publication types