. 2019 Jul 24;24(15):2690.
doi: 10.3390/molecules24152690.

Comparison of Data Fusion Methods as Consensus Scores for Ensemble Docking

Affiliations

Comparison of Data Fusion Methods as Consensus Scores for Ensemble Docking

Dávid Bajusz et al. Molecules. .

Abstract

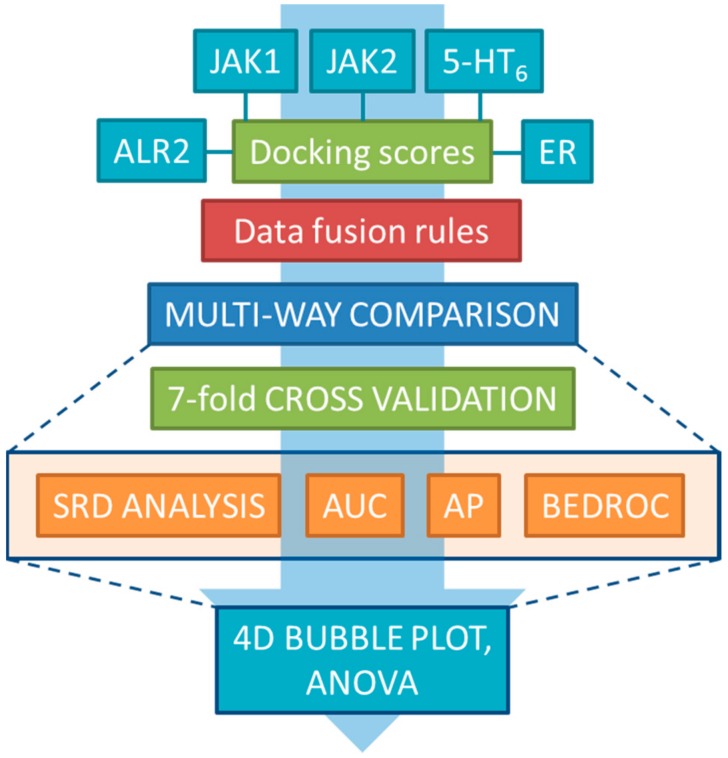
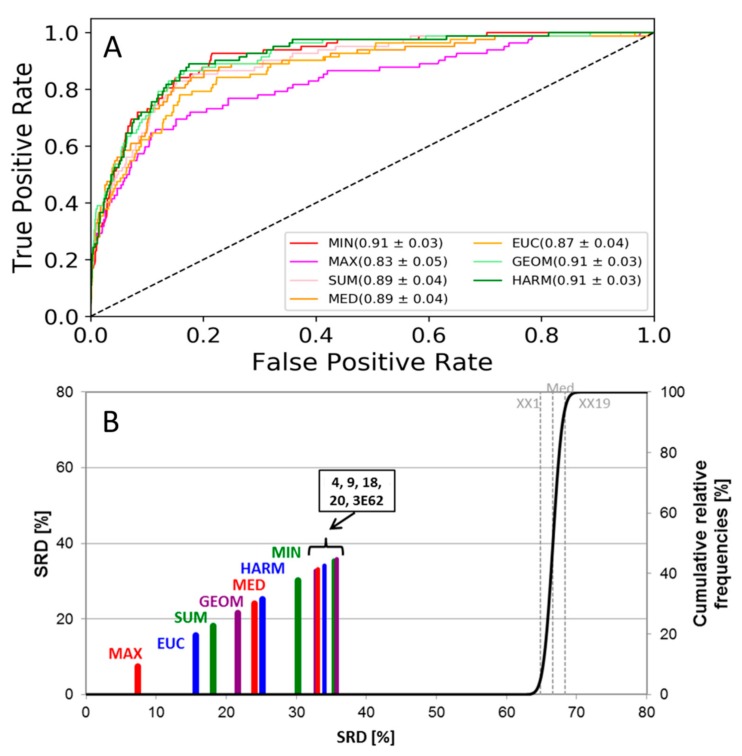
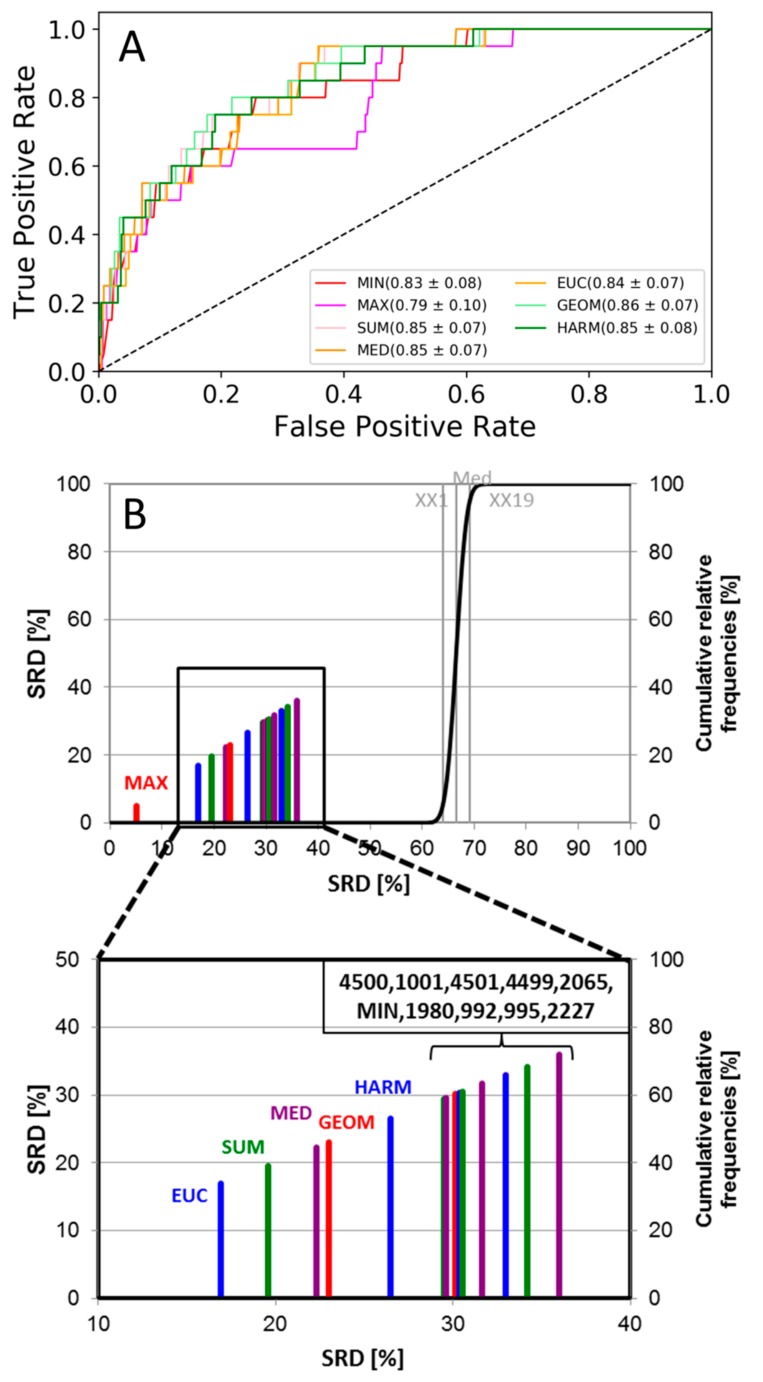
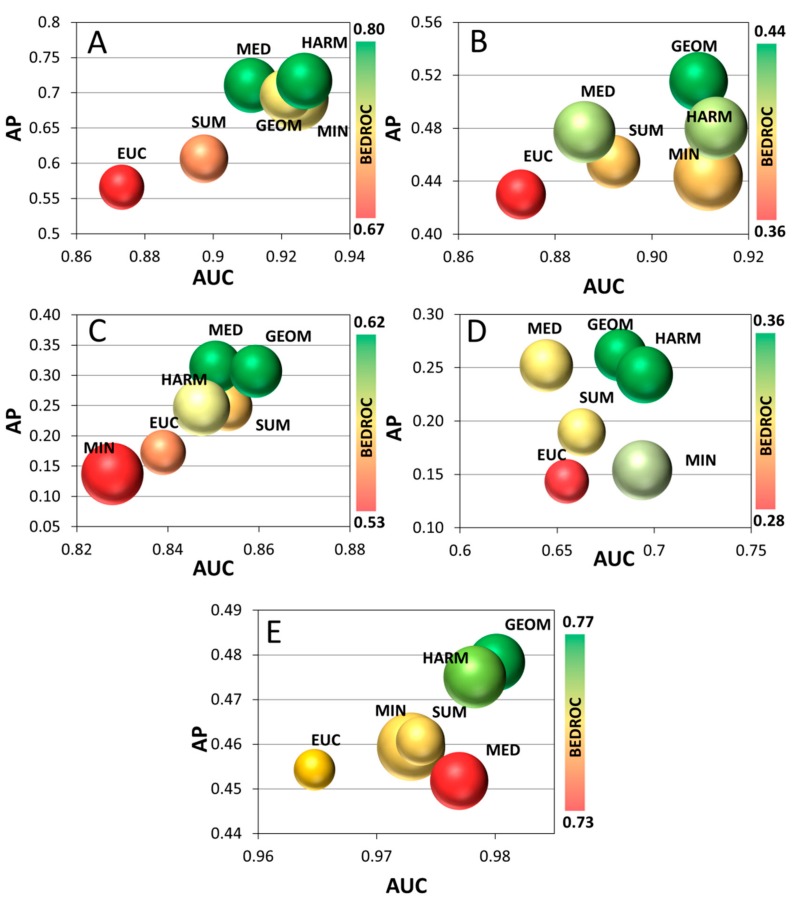
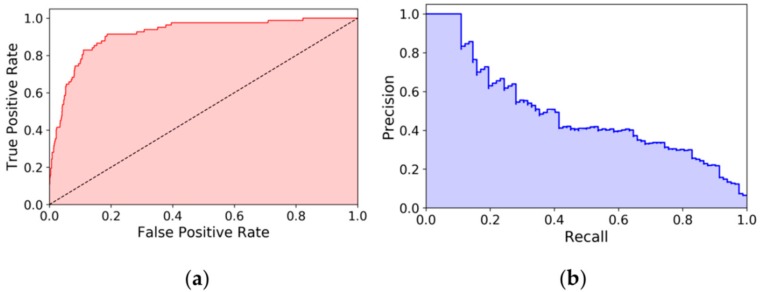
Ensemble docking is a widely applied concept in structure-based virtual screening-to at least partly account for protein flexibility-usually granting a significant performance gain at a modest cost of speed. From the individual, single-structure docking scores, a consensus score needs to be produced by data fusion: this is usually done by taking the best docking score from the available pool (in most cases- and in this study as well-this is the minimum score). Nonetheless, there are a number of other fusion rules that can be applied. We report here the results of a detailed statistical comparison of seven fusion rules for ensemble docking, on five case studies of current drug targets, based on four performance metrics. Sevenfold cross-validation and variance analysis (ANOVA) allowed us to highlight the best fusion rules. The results are presented in bubble plots, to unite the four performance metrics into a single, comprehensive image. Notably, we suggest the use of the geometric and harmonic means as better alternatives to the generally applied minimum fusion rule.

Keywords: AUC; BEDROC; ROC curve; SRD; data fusion; ensemble docking.


Conflict of interest statement

The authors declare no conflict of interest.

Figures

Figure 1
Figure 1
The workflow of the complete study. Single-structure docking scores from five case studies were used to generate consensus scores by the various data fusion rules, which were then compared by four performance metrics (SRD, AUC, AP, BEDROC) and statistical analysis (ANOVA).
Figure 2
Figure 2
(A) ROC curves of the JAK2 dataset. The AUC values and standard deviations for each fusion rule are included in the legend. Single-structure docking scores are omitted for clarity. (B) SRD analysis of the JAK2 dataset. Normalized SRD values are plotted on the x and left y axes, and the cumulative relative frequencies of SRD values for random ranking are plotted on the right y axis and shown as the black curve. Single-structure docking scores are labeled based on PDB code (3E62) or sequential MD frame number (4, 9, 18, 20).
Figure 3
Figure 3
(A) ROC curves of the 5-HT6 dataset. The AUC values and standard deviations for each fusion rule are included in the legend. Single-structure docking scores are omitted for clarity. (B) SRD analysis of the 5-HT6 dataset. Normalized SRD values are plotted on the x and left y axes, and the cumulative relative frequencies of SRD values for random ranking are plotted on the right y axis and shown as the black curve. The MD frame numbers in the bracket denote single-structure docking scores; the structure labels are taken from Table 2 of case study 3 [20].
Figure 4
Figure 4
Bubble plots of the JAK1 (A), JAK2 (B), 5-HT6 (C), ALR2 (D) and ER (E) datasets. AP values are plotted against the AUC values. Bubble sizes correspond to SRD values (the smaller the better) and the colors correspond to BEDROC values, increasing from red to green (see color scale on the right). The MAX rule and single-structure docking scores were omitted due to their greater distance from the other fusion rules (see Supplementary Figure S5).
Figure 5
Figure 5
Example for (a) a ROC plot, and (b) a precision-recall curve (consensus score with the MIN fusion rule on the JAK2 dataset). The areas under the curves are (a) the AUC value (here, 0.916), and (b) the AP (average precision) value (here, 0.484), respectively. The dashed line on the ROC plot corresponds to random classification.

Similar articles

Cited by

References

    1. Sotriffer C. Virtual Screening: Principles, Challenges, and Practical Guidelines. Wiley-VCH Verlag GmbH & Co. KGaA; Weinheim, Germany: 2011.
    1. Bajusz D., Ferenczy G., Keserű G. Structure-Based Virtual Screening Approaches in Kinase-Directed Drug Discovery. Curr. Top. Med. Chem. 2017;17:2235–2259. doi: 10.2174/1568026617666170224121313. - DOI - PubMed
    1. Cross J.B. Methods for Virtual Screening of GPCR Targets: Approaches and Challenges. In: Heifetz A., editor. Computational Methods for GPCR Drug Discovery. Humana Press; New York, NY, USA: 2018. pp. 233–264. - PubMed
    1. Amaro R.E., Baudry J., Chodera J., Demir Ö., McCammon J.A., Miao Y., Smith J.C. Ensemble Docking in Drug Discovery. Biophys. J. 2018;114:2271–2278. doi: 10.1016/j.bpj.2018.02.038. - DOI - PMC - PubMed
    1. Huang S.-Y., Zou X. Ensemble docking of multiple protein structures: Considering protein structural variations in molecular docking. Proteins Struct. Funct. Bioinform. 2007;66:399–421. doi: 10.1002/prot.21214. - DOI - PubMed

LinkOut - more resources