. 2019 Oct;16(10):1471-1485.
doi: 10.1080/15476286.2019.1637698. Epub 2019 Jul 26.

HuR interacts with lincBRN1a and lincBRN1b during neuronal stem cells differentiation

Affiliations

HuR interacts with lincBRN1a and lincBRN1b during neuronal stem cells differentiation

Stephana Carelli et al. RNA Biol. 2019 Oct.

Abstract

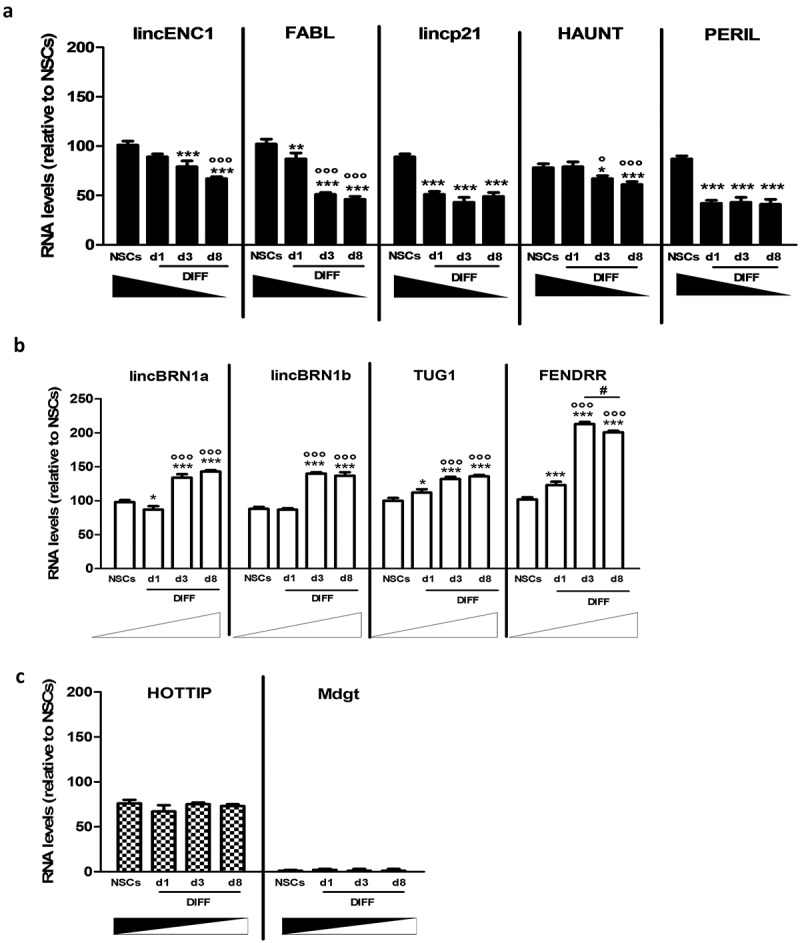
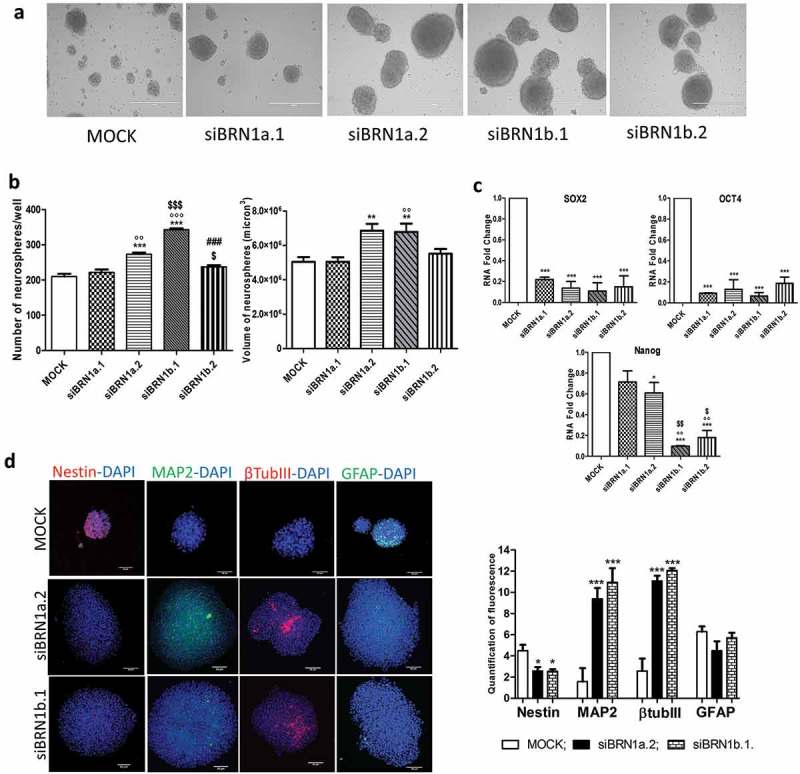
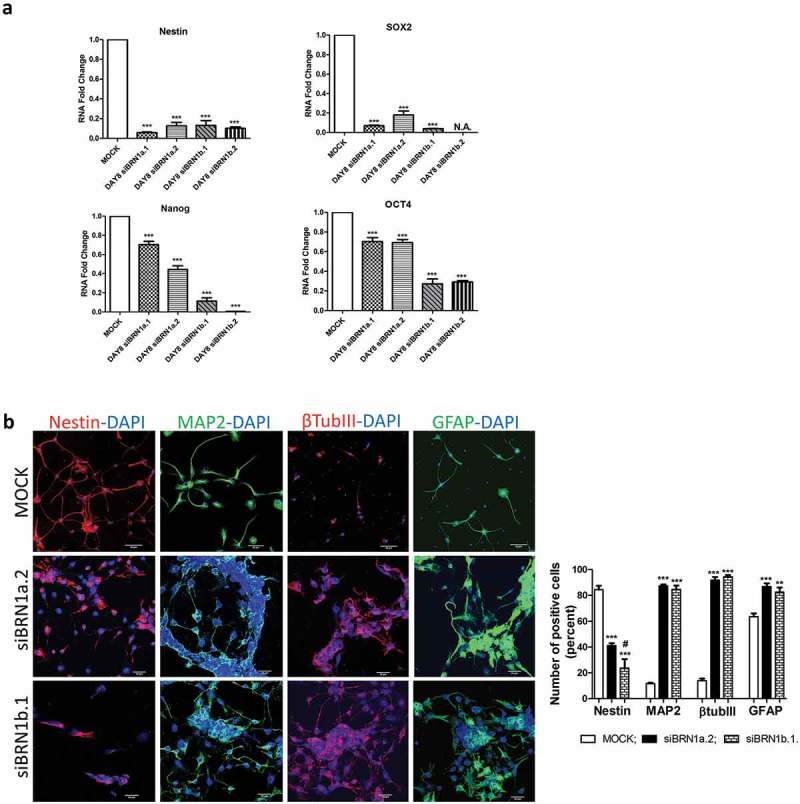
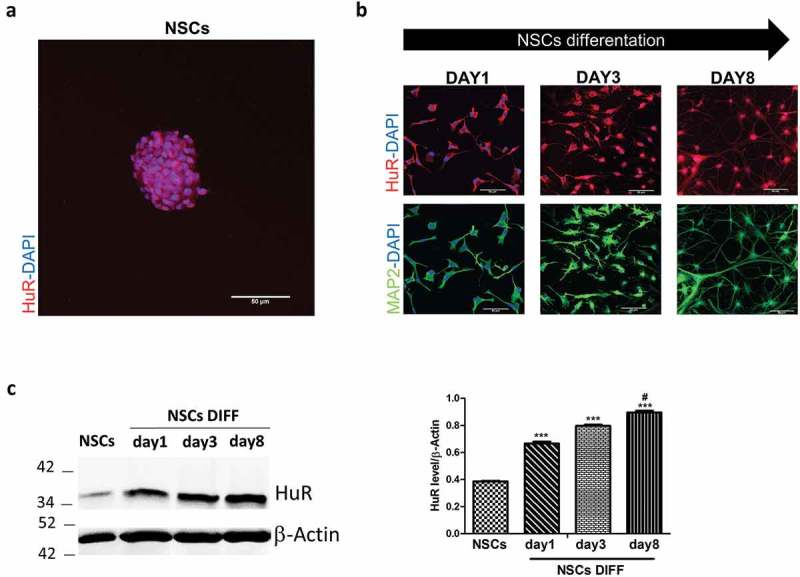
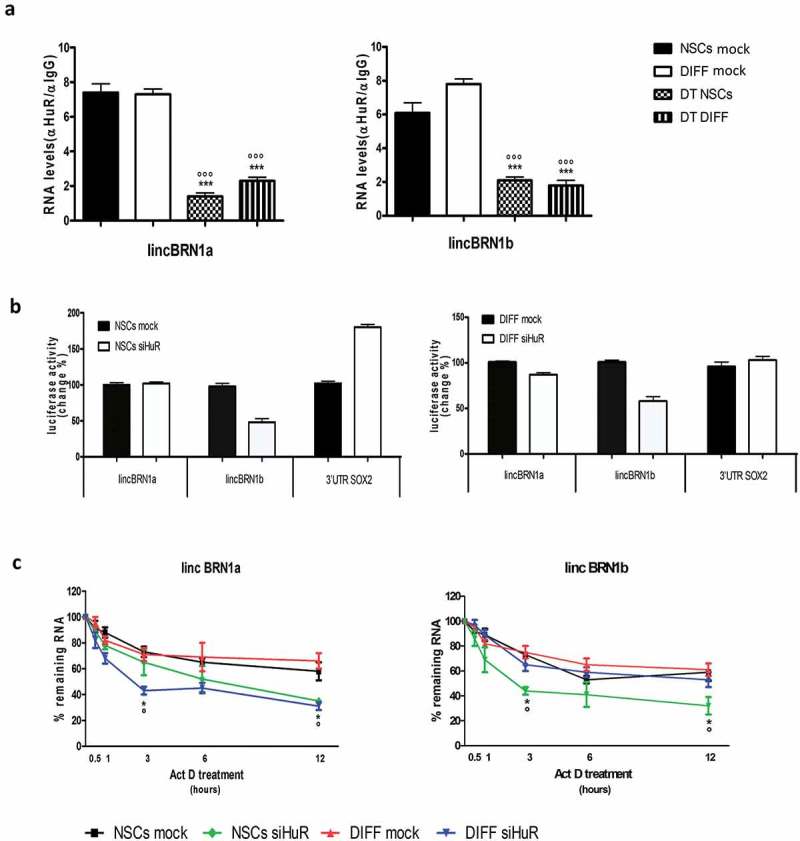
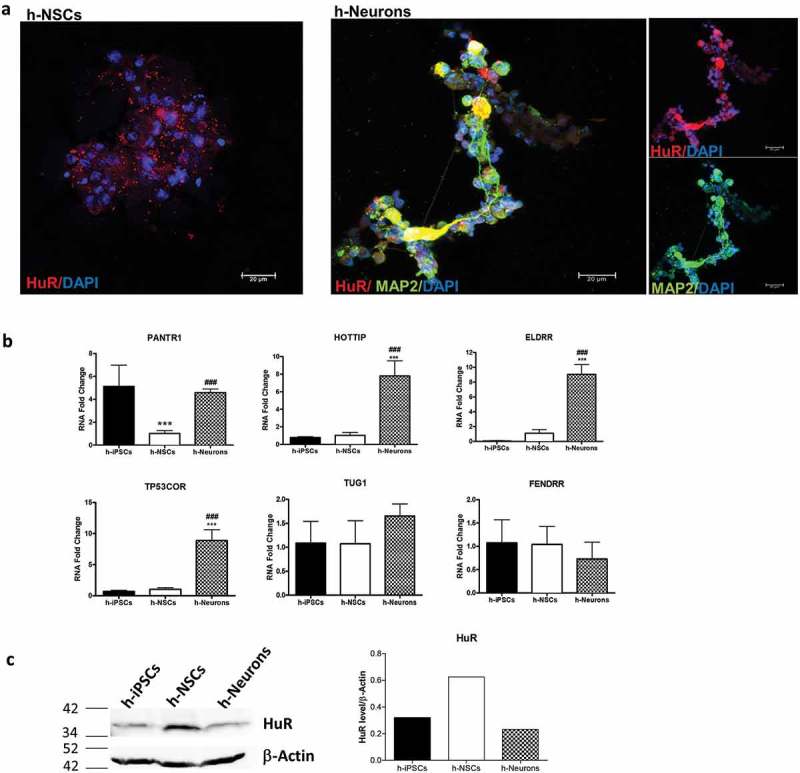
LncRNAs play crucial roles in cellular processes and their regulatory effects in the adult brain and neural stem cells (NSCs) remain to be entirely characterized. We report that 10 lncRNAs (LincENC1, FABL, lincp21, HAUNT, PERIL, lincBRN1a, lincBRN1b, HOTTIP, TUG1 and FENDRR) are expressed during murine NSCs differentiation and interact with the RNA-binding protein ELAVL1/HuR. Furthermore, we characterize the function of two of the deregulated lncRNAs, lincBRN1a and lincBRN1b, during NSCs' differentiation. Their inhibition leads to the induction of differentiation, with a concomitant decrease in stemness and an increase in neuronal markers, indicating that they exert key functions in neuronal cells differentiation. Furthermore, we describe here that HuR regulates their half-life, suggesting their synergic role in the differentiation process. We also identify six human homologs (PANTR1, TUG1, HOTTIP, TP53COR, ELDRR and FENDRR) of the mentioned 10 lncRNAs and we report their deregulation during human iPSCs differentiation into neurons. In conclusion, our results strongly indicate a key synergic role for lncRNAs and HuR in neuronal stem cells fate.

Keywords: HuR; Neural stem cell; differentiation; long-non-coding RNA.


Figures

Figure 1.
Figure 1.
Expression analysis of a pool of lncRNAs during mice NSCs differentiation. (a). LincENC1, FABL, lincp21, HAUNT and PERIL expression levels were analyzed in neurospheres (NSCs) and at different time points during the differentiation process (d1, d3, d8 DIFF). These lncRNAs decrease during the differentiation process. Quantification was performed by real time-PCR using GAPDH as housekeeping gene. Results are expressed as mean of three different experiments ± SD (*p < 0.05, **p < 0.01, ***p < 0.001 vs NSCs; °p < 0.05, °°°p < 0.001 vs d1).(b). LincBRN1A, lincBRN1B, TUG1 and FENDRR expression levels were analyzed in neurospheres (NSCs) and at different time points during the differentiation process (d1, d3, d8 DIFF). These lncRNAs increase during the differentiation process. Quantification was performed by Real Time-PCR using GAPDH as housekeeping gene. Results are expressed as the mean of three different experiments ± SD (*p < 0.05, ***p < 0.001 vs NSCs; °°°p < 0.001 vs d1; #p < 0.05 vs d3).(c). Hottip and Mdgt expression levels were analyzed in neurospheres (NSCs) and at different time points during the differentiation process (d1, d3, d8 DIFF). These lncRNAs stay stable during the differentiation process. Quantification was performed by real time-PCR using GAPDH as housekeeping gene. Results are expressed as the mean of three different experiments ± SD.
Figure 2.
Figure 2.
Silencing of lincBRN1a and lincBRN1b in NSCs. (a). In vivo direct light images (EVOS FL microscope, Euroclone) of neurospheres maintained in stem cells medium for 8 days in standard floating conditions (MOCK) or in the presence of silencing agents for lincBRN1a (siBRN1a.1 and siBRN1a.2) and lincBRN1b (siBRN1b.1 and siBRN1b.2). Scale bar 400 μm. Images are representative of what has been observed in three different experiments.(b). The histograms report the neurospheres’ number and dimensions, respectively, in standard conditions (MOCK), and in the presence of silencing agents for lincBRN1a (siBRN1a.1 and siBRN1a.2) and lincBRN1b (siBRN1b.1 and siBRN1b.2). The number of neurospheres was calculated as the number of spheroids formed by 104 seeded NSCs in the different conditions. The dimension was reported as volume measured by means of ImageJ software culture picture analysis. Pictures are representative of three different experiments. Quantifications were repeated in triplicate for each experiment and data is reported as mean ± SD (**p < 0.01, ***p < 0.001 vs MOCK; °°p < 0.01, °°°p < 0.001 vs siBRN1a.1; $p < 0.05, $ p < 0.001 vs siBRN1a.2; ###p < 0.001 vs siBRN1b.1).(c). The histograms report the mRNA expression levels of SOX2, Nanog and OCT4 in standard conditions (MOCK), and in the presence of silencing agents for lincBRN1a (siBRN1a.1 and siBRN1a.2) and lincBRN1b (siBRN1b.1 and siBRN1b.2). Quantification was performed using GAPDH as housekeeping gene. Results are expressed as mean ± SD of three independent experiments (*p < 0.05, ***p < 0.001 vs MOCK; $ p < 0.05, [Math Processing Error] p < 0.01 vs siBRN1a.1; °°°p < 0.001 vs siBRN1a.2).(d). Confocal images of neurospheres marked with Nestin (red), Map2 (green), βTubIII (red) and GFAP (green) in standard conditions (MOCK), and in the presence of silencing agents for lincBRN1a (siBRN1a.2) and lincBRN1b (siBRN1b.1). DAPI (blue) was used as counter-staining. Scale bar 50 μm. The graph reports the quantification of fluorescence intensity made by ImageJ picture analysis software. Pictures are representative of three different experiments performed with siBRN1a.2 and siBRN1b.1 but similar results were obtained with siBRN1a.1 and siBRN1b.2. Quantifications was repeated in triplicate for each experiment (3 fields/experiment) and data have been reported as mean ± SD (*p < 0.05; *** p < 0.001 vs MOCK).
Figure 3.
Figure 3.
Silencing of lincBRN1a and lincBRN1b in differentiated NSCs. (a). The histograms report the mRNA expression levels of Nestin, SOX2, Nanog and OCT4 in standard conditions (MOCK), and in the presence of silencing agents for lincBRN1a (siBRN1a.1 and siBRN1a.2) and lincBRN1b (siBRN1b.1 and siBRN1b.2). Quantification was performed using GAPDH as housekeeping gene. Results are expressed as mean ± SD of three independent experiments (***p < 0.001 vs MOCK).(b). Confocal images of differentiated NSCs marked with Nestin (red), Map2 (green), βTubIII (red) and GFAP (green) in standard control conditions (MOCK), and in the presence of silencing agents for lincBRN1a (siBRN1a.2) and lincBRN1b (siBRN1b.1). DAPI (blue) was used as counter-staining. Scale bar 50 μm. The graph reports the quantification of fluorescence intensity made by ImageJ picture analysis software. Pictures are representative of three different experiments. Quantifications were repeated in triplicate for each experiment and data have been reported as mean ± SD (** p < 0.01, *** p < 0.001 vs MOCK; # p < 0.05 vs siBRN1a.2). Pictures are representative of three different experiments performed with siBRN1a.2 and siBRN1b.1 but similar results were obtained with siBRN1a.1 and siBRN1b.2.
Figure 4.
Figure 4.
HuR’s expression in mouse brain stem cell niches and during mice NSCs differentiation in vitro. (a). Immunofluorescence analysis of HuR (red) in neurospheres (NSCs) maintained in stem cells medium. DAPI (blue) was used as counter-staining. Scale bar 50 µm.(b). Immunofluorescence analysis of HuR (red) at different time points during the neural differentiation process in vitro (days 1, 3 and 8). DAPI (blue) was used as counter-staining. Scale bar 50 µm. The expression ofMAP2 (green) was tested as differentiation quality control and DAPI (blue) was used as counterstaining. Scale bar 50 μm. (c). Western blot analysis of HuR’s expression in neurospheres (NSCs) and during the differentiation period (days 1, 3 and 8). ß-Actin was used as the loading control. The histogram shows the band intensity quantification, measured by means of ImageJ software picture analysis. Data correspond to the mean ± SD (*** p < 0.001 vs NSCs; #p < 0.01 vs day1).
Figure 5.
Figure 5.
LncRNAs and HuR interact and this interaction influences lncRNAs’ expression. (a). In silico identification of HuR Binding Sites. Three different in silico approaches were used: RNA-Protein Interaction Prediction (RPISeq, http://pridb.gdcb.iastate.edu/RPISeq/) where a score >0.5 was considered ‘positive’ for a possible interaction (YES); RBPmap database (http://rbpmap.technion.ac.il/1541972084/results.html) which reports a prediction of the possible interaction sites (obtained with a ‘high stringency’ filter); RNAbp database (RBPDB, http://rbpdb.ccbr.utoronto.ca/index.php) which identifies the potential RNAbp binding sites (default threshold score of 0.8). (b). RNA-immunoprecipitation assay (RIP) for HuR was performed in neurospheres grown for 8 days (NSCs) and at the end of the 8-day differentiation process (DIFF). Quantification was performed by real time PCR and results are expressed as ddCt fold enrichment relative to unrelated IgG, used as IP negative control and performed in triplicate. Results are expressed as mean of three different experiments ± SD (*p < 0.05, ** p< 0.01, ***p < 0.001 vs NSCs).
Figure 6.
Figure 6.
HuR’s inhibition and silencing in neurospheres and in differentiated NSCs. (a). Confocal images of neurospheres marked with Nestin (red), Map2 (red), βTubIII (green) and GFAP (green) in the presence (siHuR) or absence (MOCK) of siHuR. DAPI (blue) was used as counter-staining. Scale bar 20 μm. The graph reports the quantification of fluorescence intensity made by ImageJ picture analysis software. Pictures are representative of three different experiments. Quantifications were repeated in triplicate for each experiment (three fields/experiment). Data correspond to the mean ± SD (*p < 0.05, ** p < 0.01, *** p < 0.001 vs MOCK)(b). Immunofluorescence analysis of neural precursor marker Nestin (red) and neuronal markers Gal C (red), GFAP (red), Olig2 (red), ßTubIII (red) and MAP2 (green) at the end of differentiation process. NSCs were differentiated in standard conditions (MOCK) or in the presence of either siHuR (siHuR) or DT (DT). DAPI (blue) was used as counter-staining. Scale bar 50 µm. The quantification of the fluorescence intensity was made by ImageJ picture analysis software. Pictures are representative of three different experiments. Quantifications were repeated in triplicate for each experiment (three fields/experiment). Data correspond to the mean ± SD (** p < 0.01, *** p< 0.001vs NTC; ## p < 0.01, ### p < 0.001 vs siHuR).
Figure 7.
Figure 7.
Investigation of the interaction between HuR and lincBRN1a/lincBRN1b. (a). RNA immunoprecipitation assay (RIP) for HuR was performed in neurospheres (NSCs) and at the end of the 8-day differentiation process (DIFF). Cells were analyzed in the presence or absence of dihydrotanshinone (DT 1µM), an RNA-HuR interaction interfering agent. LncRNAs lincBRN1a and lincBRN1b show a strong affinity for the HuR antibody-coated beads and DT destroys this interaction, indicating a specific interaction between the RNA-binding protein and the lncRNAs. Quantification was performed by Real time PCR and quantification was expressed with reference to the input. Results are expressed as the mean of three different experiments ± SD (*** p < 0.001 vs NSCs; °°° p < 0.001 vs DIFF; with n = 3). (b). Luciferase reporter assay performed on NSCs and differentiated cells (DIFF) in the presence or absence of siHuR. The experiment was performed transfecting reporter plasmids carrying AU-rich regulatory regions of lincBRN1a and lincBRN1b, 3ʹUTR SOX2 reporter was used as positive control. Results are expressed as the mean of three different experiments ± SD. (c). RNA turnover assay. The lncRNAs expression levels (lincBRN1a and lincBRN1b) were monitored at 30 min, 1, 3, 6 and 12 h after the administration of Actinomycin D in presence or absence of HuR silencing (siHuR). Results are expressed as the mean of three different experiments ± SD (*p < 0.05 vs NSCs MOCK; ° p < 0.05 vs DIFF MOCK; with n = 3).
Figure 8.
Figure 8.
Expression of HuR and human homologues of lncRNAs during neuronal differentiation of h-iPSCs. (a). Immunofluorescence analysis of HuR (red) and MAP2 (green) in h-NSCs and h-Neurons. DAPI (blue) was used as counter-staining. Scale bar 20 µm. (b). Expression analysis of human homologues of lncRNAs PANTR1, HOTTIP, ELDRR TP53COR, TUG1 and FENDRR in iPSCs (h-iPSCs), NSCs (h-NSCs) and neurons (h-Neurons). Quantification was performed by means of Real Time-PCR using GAPDH as housekeeping gene. Results are reported as mean ± SD (***p < 0.001; vs h-iPSCs, ###p < 0.001 vs h-NSCs n = 3).(c). Western blot analysis of HuR’s expression in h-iPSCs, h-NSCs and h-Neurons (NSCs). ß-Actin was used as the loading control. The histogram shows the band intensity quantification, measured by means of ImageJ software picture analysis.

Similar articles

Cited by

References

    1. Vishwakarma SK, Bardia A, Tiwari SK, et al. Current concept in neural regeneration research: NSCs isolation, characterization and transplantation in various neurodegenerative diseases and stroke: A review. J Adv Res. 2014;5(3):277–294. - PMC - PubMed
    1. Temple S. Division and differentiation of isolated CNS blast cells in microculture. Nature. 1989;340(6233):471–473. - PubMed
    1. Rossi F, Cattaneo E. Opinion: neural stem cell therapy for neurological diseases: dreams and reality. Nat Rev Neurosci. 2002;3(5):401–409. - PubMed
    1. Decimo I, Bifari F, Krampera M, et al. Neural stem cell niches in health and diseases. Curr Pharm Des. 2012;18(13):1755–1783. - PMC - PubMed
    1. Carelli S, Giallongo T, Marfia G, et al. Exogenous adult postmortem neural precursors attenuate secondary degeneration and promote myelin sparing and functional recovery following experimental spinal cord injury. Cell Transplant. 2015;24(4):703–719. - PubMed

Publication types