Comparative Study
. 2019 Oct;76(4):469-478.
doi: 10.1016/j.eururo.2019.06.030. Epub 2019 Jul 22.

Prostate-specific Membrane Antigen Heterogeneity and DNA Repair Defects in Prostate Cancer

Affiliations
Comparative Study

Prostate-specific Membrane Antigen Heterogeneity and DNA Repair Defects in Prostate Cancer

Alec Paschalis et al. Eur Urol. 2019 Oct.

Abstract

Background: Prostate-specific membrane antigen (PSMA; folate hydrolase) prostate cancer (PC) expression has theranostic utility.

Objective: To elucidate PC PSMA expression and associate this with defective DNA damage repair (DDR).

Design, setting, and participants: Membranous PSMA (mPSMA) expression was scored immunohistochemically from metastatic castration-resistant PC (mCRPC) and matching, same-patient, diagnostic biopsies, and correlated with next-generation sequencing (NGS) and clinical outcome data.

Outcome measurements and statistical analysis: Expression of mPSMA was quantitated by modified H-score. Patient DNA was tested by NGS. Gene expression and activity scores were determined from mCRPC transcriptomes. Statistical correlations utilised Wilcoxon signed rank tests, survival was estimated by Kaplan-Meier test, and sample heterogeneity was quantified by Shannon's diversity index.

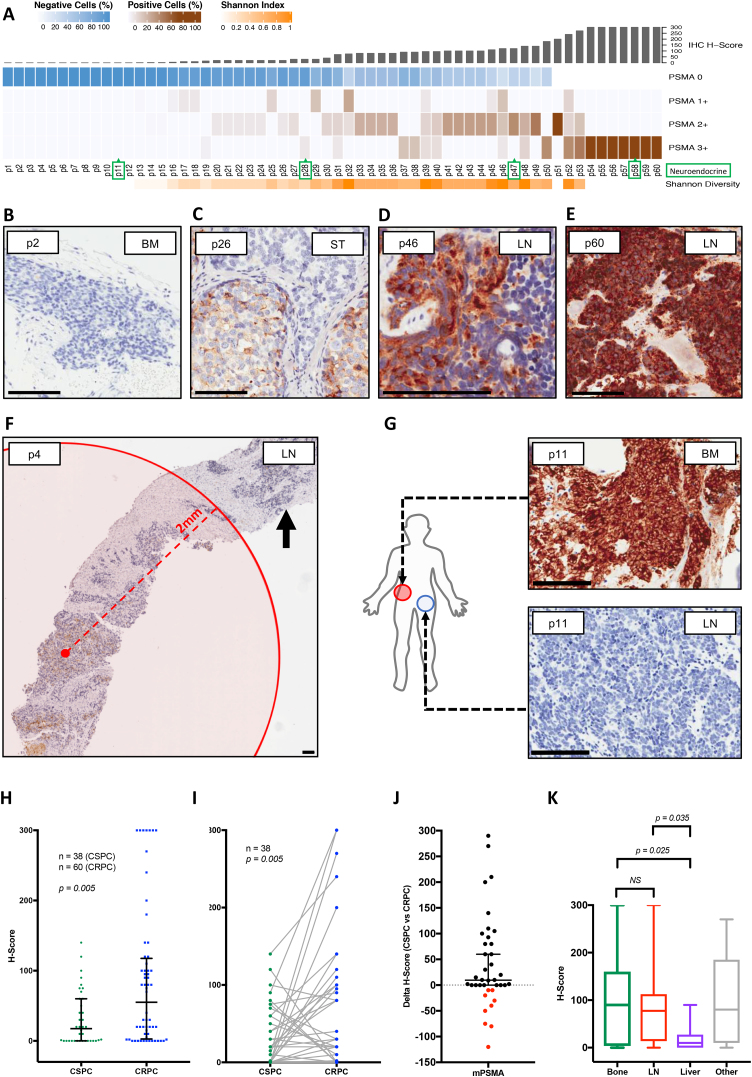
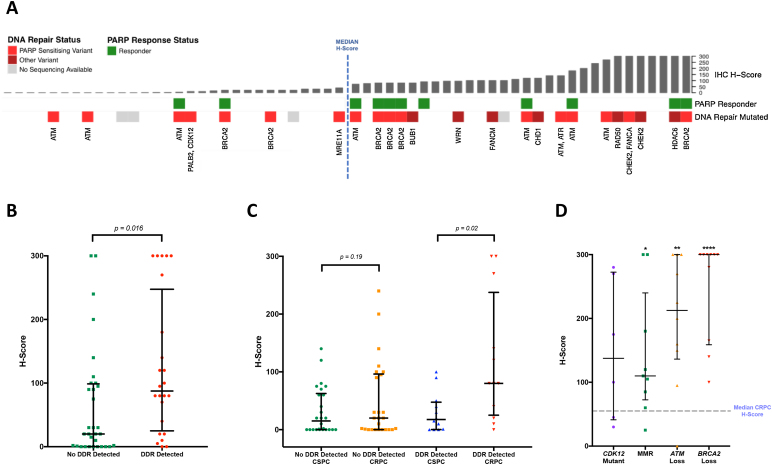
Results and limitations: Expression of mPSMA at diagnosis was associated with higher Gleason grade (p=0.04) and worse overall survival (p=0.006). Overall, mPSMA expression levels increased at mCRPC (median H-score [interquartile range]: castration-sensitive prostate cancer [CSPC] 17.5 [0.0-60.0] vs mCRPC 55.0 [2.8-117.5]). Surprisingly, 42% (n=16) of CSPC and 27% (n=16) of mCRPC tissues sampled had no detectable mPSMA (H-score <10). Marked intratumour heterogeneity of mPSMA expression, with foci containing no detectable PSMA, was observed in all mPSMA expressing CSPC (100%) and 37 (84%) mCRPC biopsies. Heterogeneous intrapatient mPSMA expression between metastases was also observed, with the lowest expression in liver metastases. Tumours with DDR had higher mPSMA expression (p=0.016; 87.5 [25.0-247.5] vs 20 [0.3-98.8]; difference in medians 60 [5.0-95.0]); validation cohort studies confirmed higher mPSMA expression in patients with deleterious aberrations in BRCA2 (p<0.001; median H-score: 300 [165-300]; difference in medians 195.0 [100.0-270.0]) and ATM (p=0.005; 212.5 [136.3-300]; difference in medians 140.0 [55.0-200]) than in molecularly unselected mCRPC biopsies (55.0 [2.75-117.5]). Validation studies using mCRPC transcriptomes corroborated these findings, also indicating that SOX2 high tumours have low PSMA expression.

Conclusions: Membranous PSMA expression is upregulated in some but not all PCs, with mPSMA expression demonstrating marked inter- and intrapatient heterogeneity. DDR aberrations are associated with higher mPSMA expression and merit further evaluation as predictive biomarkers of response for PSMA-targeted therapies in larger, prospective cohorts.

Patient summary: Through analysis of prostate cancer samples, we report that the presence of prostate-specific membrane antigen (PSMA) is extremely variable both within one patient and between different patients. This may limit the usefulness of PSMA scans and PSMA-targeted therapies. We show for the first time that prostate cancers with defective DNA repair produce more PSMA and so may respond better to PSMA-targeting treatments.

Keywords: BRCA2; Castration-resistant prostate cancer; Defective DNA repair; Prostate cancer; Prostate-specific membrane antigen; Theranostics; Treatment resistance; Tumour heterogeneity.


Figures

Fig. 1
Fig. 1
Membranous PSMA (mPSMA) protein expression at the time of prostate cancer (PC) diagnosis is heterogeneous and is associated with a worse overall survival. (A) Immunohistochemical (IHC) antibody validation performed using PC3 cell mouse xenograft, which does not express PSMA protein, and PSMA-expressing LnCaP cell mouse xenograft, demonstrating positive brown membranous and cytoplasmic staining. (B) Antibody signal specificity confirmed by detection of a single band in LnCaP whole-cell lysates by Western blot, with downregulation following treatment with pooled PSMA siRNA compared with nontargeting control siRNA. (C) Graphical representation of mPSMA protein expression in tissue samples obtained from patients with castration-sensitive prostate cancer (CSPC) obtained at diagnosis of PC. Expression of mPSMA protein quantified by H-score and presented in order of increasing H-score. Degree of heterogeneity in mPSMA protein expression observed within samples measured by Shannon's diversity index (SDI) and depicted as heat map ranging from low heterogeneity (white) to high heterogeneity (orange). Of the 38 CSPC tissue samples analysed (median H-score [interquartile range]: 17.5 [0.0–60.0]), 16 (42%; 95% CI [28–58%]) were found to be negative for mPSMA protein expression (H-score <10). Among the 26 remaining samples, as mPSMA protein expression increased, so too did the degree of intrasample heterogeneity, with all CSPC biopsies that expressed mPSMA (PSMA 1+, PSMA 2+, or PSMA 3+) also exhibiting areas of tumour with no detectable PSMA expression (PSMA 0). (D–G) Examples of microscopic appearance of PSMA IHC. All scale bars are set to 100 μm. (D) Prostatectomy demonstrating prostatic adenocarcinoma with no detectable PSMA expression. (E) Prostate biopsy containing prostate cancer cells with strong brown positive membranous and cytoplasmic staining for PSMA. (F) Prostatectomy and (G) prostate biopsy showing heterogeneity in PSMA expression with areas of strong PSMA expression (PSMA 2+ and PSMA 3+) interspersed amongst tumour cells with no detectable PSMA protein expression (PSMA 0). (H) High PSMA protein expression (H-score > median) at the time of prostate cancer diagnosis associated with significantly shorter median OS. Bx = biopsy; CI = confidence interval; HR = hazard ratio; OS = overall survival; PSMA = prostate-specific membrane antigen.
Fig. 2
Fig. 2
Expression of mPSMA protein is upregulated in mCRPC, but demonstrates marked intra- and interpatient heterogeneity. (A) Graphic representation of mPSMA protein expression in mCRPC tissue samples. Expression of mPSMA protein quantified by H-score and presented in order of increasing H-score. Intrasample heterogeneity of mPSMA protein expression quantified by SDI and depicted as a heat map ranging from low heterogeneity (white) to high heterogeneity (orange). Tumours with histopathological evidence of neuroendocrine differentiation, confirmed by detectable synaptophysin and/or chromogranin A by IHC, are highlighted by green boxes around patient identifiers. Overall mPSMA expression levels were higher in mCRPC (55.0 [2.8–117.5]; n = 60); however, as seen in CSPC tissue biopsies, 27% (n = 16; 95% CI [17–39%]) of mCRPC patient biopsies had no detectable expression of mPSMA (H-score <10). Interestingly, eight (50% [28–72%]) of these patients were also negative for mPSMA expression at the diagnosis of PC. Expression of mPSMA in mCRPC also demonstrated marked intra- and intertumour heterogeneity, with 84% ([71–92%]; n = 37) of mCRPC biopsies that expressed mPSMA (n = 44; PSMA 1+, PSMA 2+,or PSMA 3+) also exhibiting areas of tumour with no detectable PSMA expression (PSMA 0), and only 10 (23% [13–37%) mPSMA-positive mCRPC samples not containing regions of tumour cells with no mPSMA protein expression (PSMA 0). (B–E) Examples of microscopic appearance of PSMA IHC. All scale bars are set to 100 μm. (B) Bone marrow trephine demonstrating prostatic adenocarcinoma with no detectable PSMA expression. (C) Soft tissue metastasis showing adenocarcinoma cells with moderate (PSMA 2+) PSMA expression (brown) interspersed and juxtaposed alongside tumour cells with no detectable PSMA expression (PSMA 0). (D) Lymph node biopsy exhibiting strongly positive PSMA expressing cells (PSMA 2+ and PSMA 3+) intertwined within a region of PSMA-negative (PSMA 0) tumour cells. (E) Lymph node biopsy with strong positive membranous and cytoplasmic staining for PSMA (PSMA 3+) with no PSMA negative cells. (F) Lymph node biopsy highlighting the clinical significance of PSMA intratumour heterogeneity. Discrete nodule of tumour cells with no PSMA protein expression (arrow) segregated away from the region of PSMA-expressing cells (brown) and located beyond the maximal tissue penetrance of 177Lu (red circle). (G) Bone and lymph node mCRPC biopsies from the same patient demonstrating significant heterogeneity between metastases. (H) Expression levels of mPSMA significantly higher (p = 0.005) in mCRPC biopsies (55.0 [2.8–117.5]; n = 60) compared with CSPC biopsies (17.5 [0.0–60.0]; n = 38). (I) Comparison with matched, same-patient CSPC tissue samples (n = 38), however, revealed poor concordance in mPSMA expression levels between CSPC and mCRPC samples. (J) Expression of mPSMA increases in most patients on progression to mCRPC; however, nine patients had no change in expression levels (change in H-score <5), while nine (24% [13–39%]) had less mPSMA protein expression at mCRPC. Interestingly, eight (89% [57–99%]) of the patients with no change in mPSMA expression were negative for mPSMA expression at the diagnosis of PC (H-score <10), and remained so on progression to mCRPC. (K) Comparison of mPSMA expression levels relative to the type of tissue biopsied. No difference was observed between samples obtained from bone (n = 25) and lymphoid tissue (n = 22); however, significantly lower mPSMA expression was seen in liver metastases (n = 8), none of which demonstrating overt evidence of neuroendocrine differentiation. BM = bone marrow; CI = confidence interval; CSPC = castration-sensitive prostate cancer; HR = hazard ratio; LN = lymph node; mCRPC = metastatic castration-resistant PC; mPSMA = membranous PSMA; NS = not significant; PC = prostate cancer; PSMA = prostate-specific membrane antigen; SDI = Shannon's diversity index; ST = soft tissue.
Fig. 3
Fig. 3
Expression of mPSMA protein in mCRPC is significantly higher in patients with deleterious DNA repair genomic aberrations. (A) Bar graph representing mPSMA protein expression in mCRPC patient biopsies (n = 60) presented in order of increasing H-score. Median H-score (55.0 [2.8–117.5]) demarcated by blue dashed line. Deleterious DNA damage repair (DDR) aberrations, as detected by next-generation sequencing (NGS) of patient tissue samples, are indicated by red boxes with affected gene labelled below; PARP inhibitor sensitising aberrations are depicted as dark red boxes and genomic variants of currently unknown significance as light red boxes. Green boxes depict patients with documented response to PARP inhibitor therapy. Grey boxes depict patients for whom mCRPC NGS data were not available (n = 4). (B) Patients with deleterious DDR aberrations in genes involved in the DNA repair pathway have significantly higher (p = 0.016; Wilcoxon rank-sum analysis) levels of mPSMA expression than those without these (DDR 87.5 [25.0–247.5] vs no DDR 20 [0.3–98.8]; difference in medians 60 [5.0–95.0]). (C) Expression of mPSMA increases significantly (p = 0.02) in mCRPC, compared with CSPC, in patients with detected deleterious DDR aberrations (median CSPC H-score = 17.5 [0.3–47.5] vs median mCRPC H-score = 80 [25–237.5]), unlike patients without DDR aberrations (median CSPC H-score = 15 [0–62.5] vs median mCRPC H-score = 20 [0–96.3]; p = 0.19) (Coef = 35; 95% CI: 2–68; p = 0.04). (D) Association between mPSMA expression and deleterious DDR aberrations was validated in an independent cohort with known DDR aberrations. Tumours with DDR aberrations had significantly higher mPSMA expression (BRCA2 300 [165–300], difference in medians 195.0 [100.0–270.0], p = < 0.001; ATM 212.5 [136.3–300], difference in medians 140.0 [55.0–200.0], p = 0.005; CDK12 137.5 [41.3–272.5], difference in medians 45 [−20.0 to 175.0], p = 0.1; MMR 110.0 [72.5–240.0], difference in medians 60 [5.0–110.0], p = 0.032) than unselected mCRPC biopsies, as shown by the dashed line (55.0 [2.75–117.5]). All p values were calculated using Mann-Whitney test. * p < 0.05, ** p < 0.01, *** p < 0.001. CI = confidence interval; CSPC = castration-sensitive prostate cancer; mCRPC = metastatic castration-resistant prostate cancer; mPSMA = membranous prostate-specific membrane antigen.
Fig. 4
Fig. 4
PSMA mRNA expression is inversely correlated with BRCA2 mRNA expression and double-strand break repair. Analysis of RNA-sequencing data obtained from 163 mCRPC transcriptomes demonstrating an inverse correlation between PSMA mRNA expression, and (A) BRCA2 mRNA expression (p < 0.001) and (B) ATM mRNA expression (p = 0.059), associating PSMA expression with BRCA2 loss. (C) An inverse correlation was observed between PSMA mRNA expression and an mRNA signature of double-strand break repair activity (p < 0.001) calculated through cumulative measurement of 19 genes involved in homologous recombination DNA repair, as determined from the Molecular Signatures Database (M11429), indicating that as PSMA mRNA expression increases, DDR activity decreases. (D) PSMA expression was also found to be inversely correlated with SOX2 mRNA expression (p < 0.001), as well as with (E) SNAI1 (p < 0.001), (F) SNAI2 (p = 0.039), (G) NCAM1 (p < 0.001), and (H) ENO2 (p < 0.001) expression levels, suggesting a downregulation of PSMA expression with luminal to basal transition and the neuroendocrine-like phenotype. DDR = defective DNA repair; FPKM = Fragments Per Kilobase of transcript per Million mapped reads; mCRPC = metastatic castration-resistant prostate cancer; PSMA = prostate-specific membrane antigen.

Comment in

References

    1. Yao V., Berkman C.E., Choi J.K., O'Keefe D.S., Bacich D.J. Expression of prostate-specific membrane antigen (PSMA), increases cell folate uptake and proliferation and suggests a novel role for PSMA in the uptake of the non-polyglutamated folate, folic acid. Prostate. 2010;70:305–316. - PubMed
    1. Tisman G. Modulation of one-carbon metabolism by B vitamins: implications for transformation and progression of prostate cancer. In: Spiess P.E., editor. Prostate cancer—from bench to bedside. IntechOpen; 2011.
    1. Caromile L.A., Dorthe K., Rahman M.M. PSMA redirects cell survival signaling from the MAPK to the PI3K-AKT pathways to promote the progression of prostate cancer. Sci Signal. 2017;10(470) - PMC - PubMed
    1. Silver D.A., Pellicer I., Fair W.R., Heston W.D., Cordon-Cardo C. Prostate-specific membrane antigen expression in normal and malignant human tissues. Clin Cancer Res. 1997;3:81–85. - PubMed
    1. Bostwick D.G., Pacelli A., Blute M., Roche P., Murphy G.P. Prostate specific membrane antigen expression in prostatic intraepithelial neoplasia and adenocarcinoma: a study of 184 cases. Cancer. 1998;82:2256–2261. - PubMed

Publication types

MeSH terms