Clinical Trial
. 2019 Oct 7;216(10):2331-2347.
doi: 10.1084/jem.20190164. Epub 2019 Jul 25.

Detection and activation of HIV broadly neutralizing antibody precursor B cells using anti-idiotypes

Affiliations
Clinical Trial

Detection and activation of HIV broadly neutralizing antibody precursor B cells using anti-idiotypes

Tara Bancroft et al. J Exp Med. .

Abstract

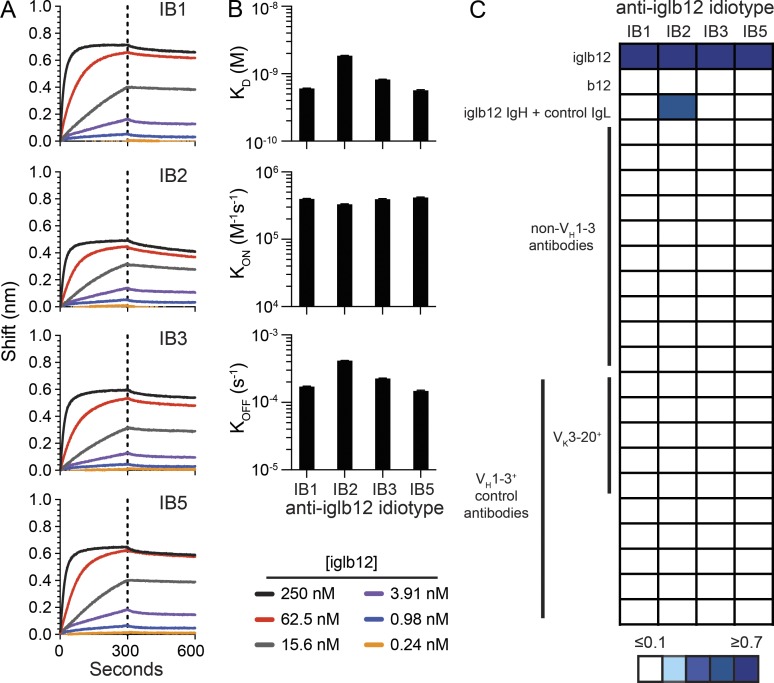
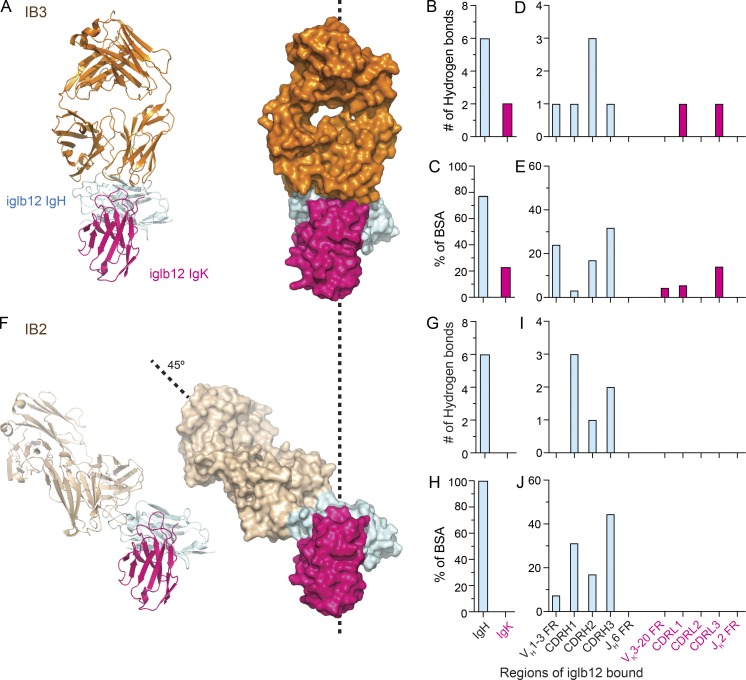
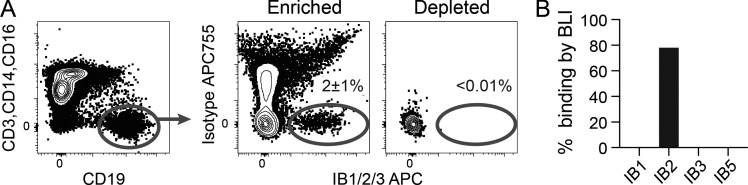
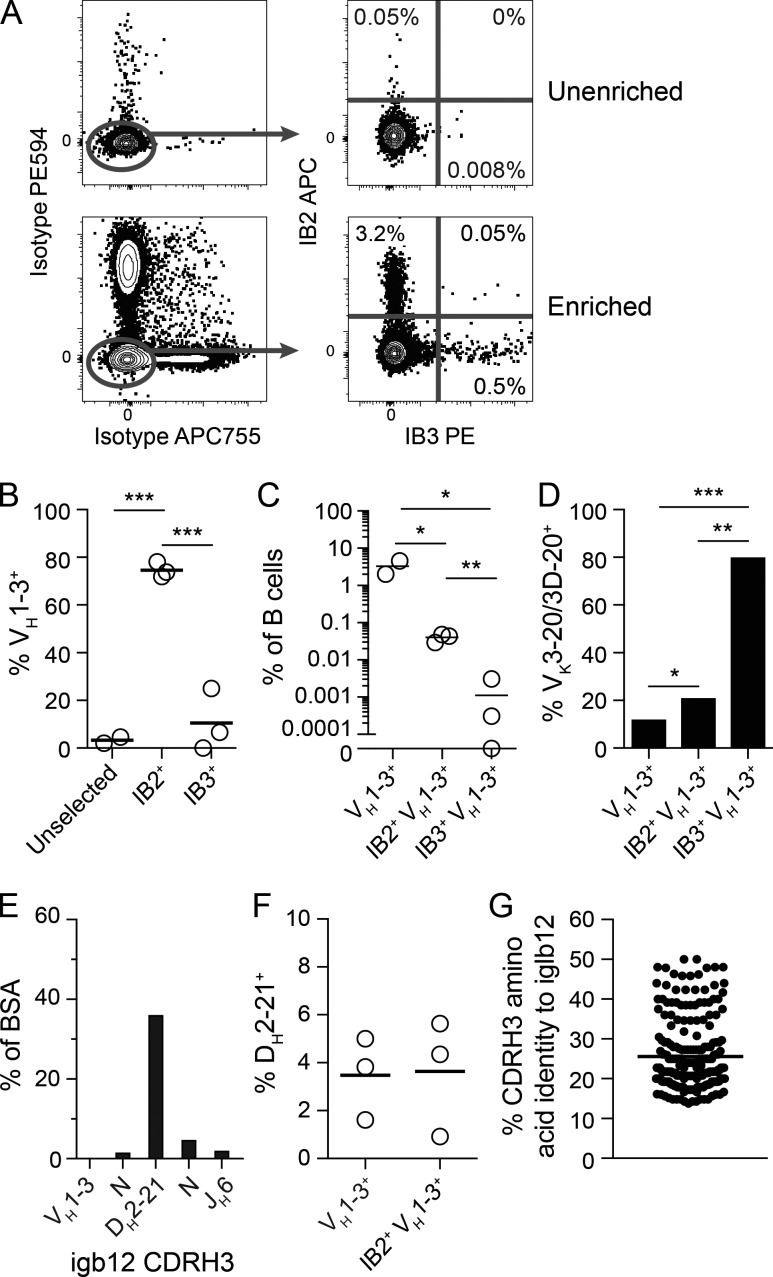
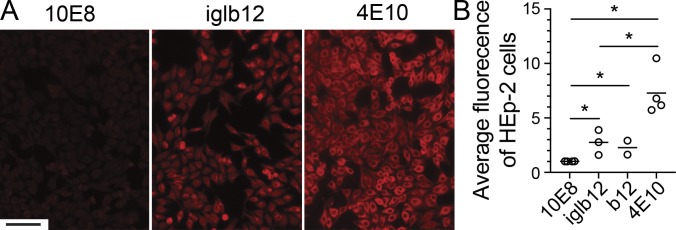
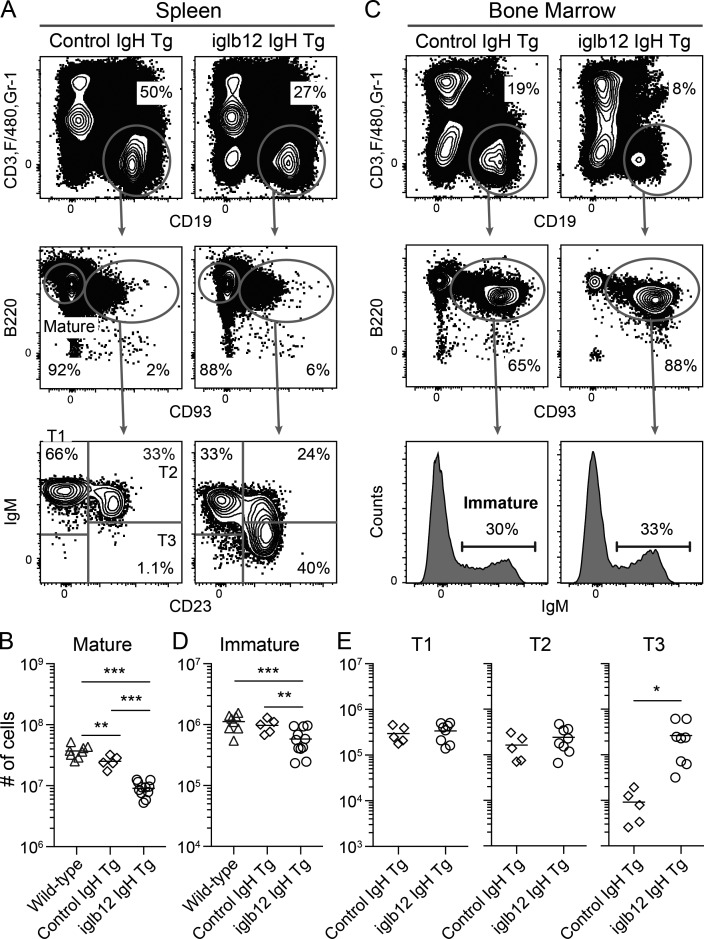
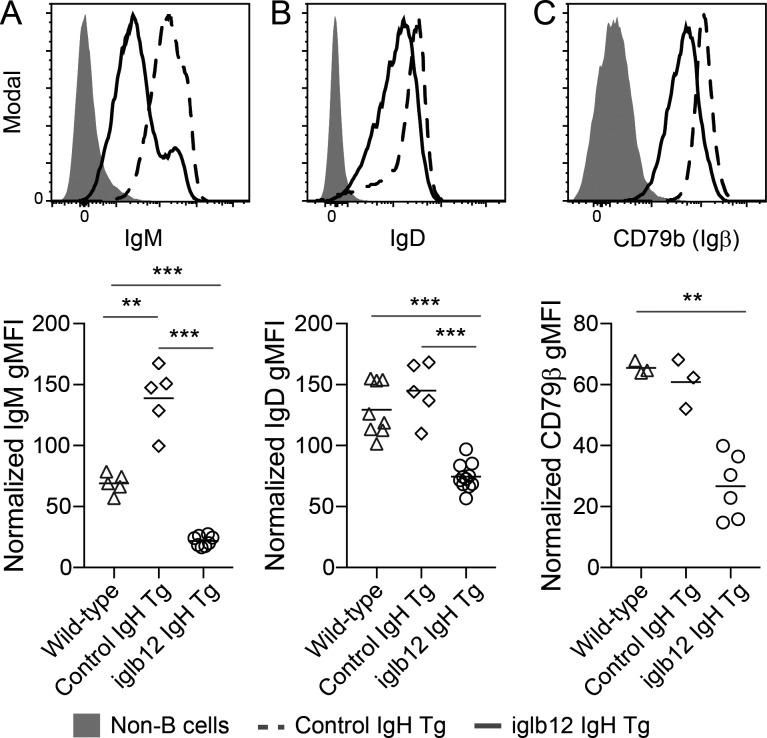
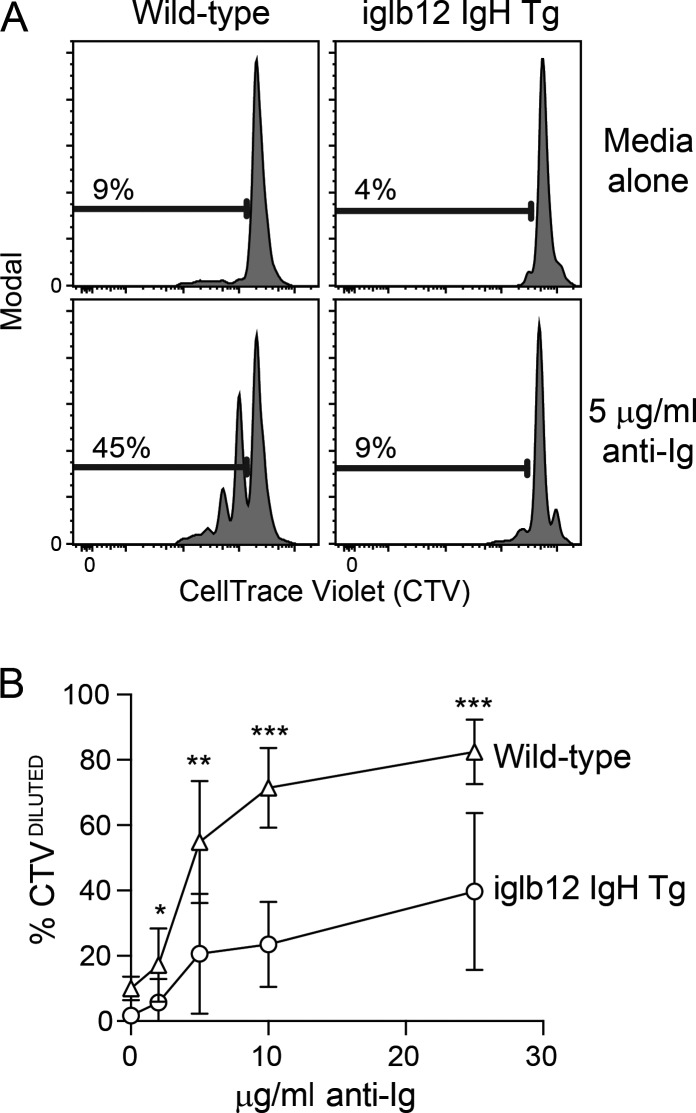
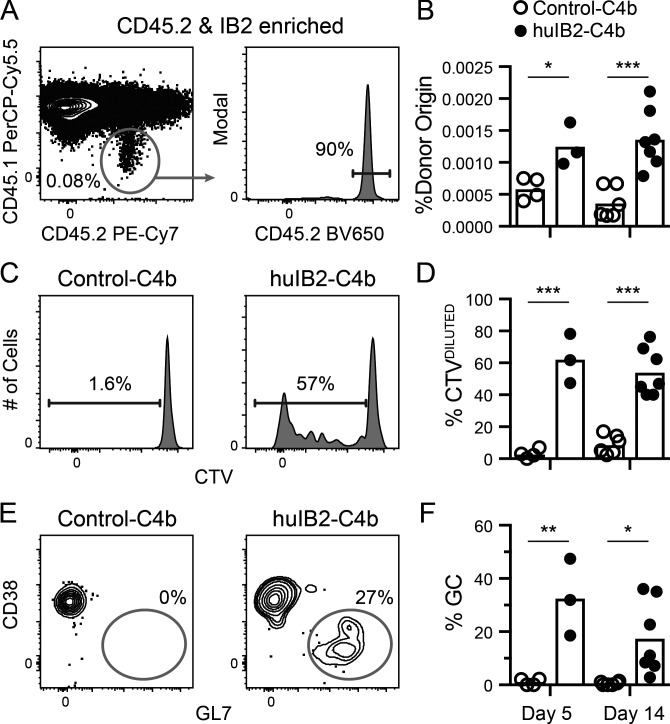
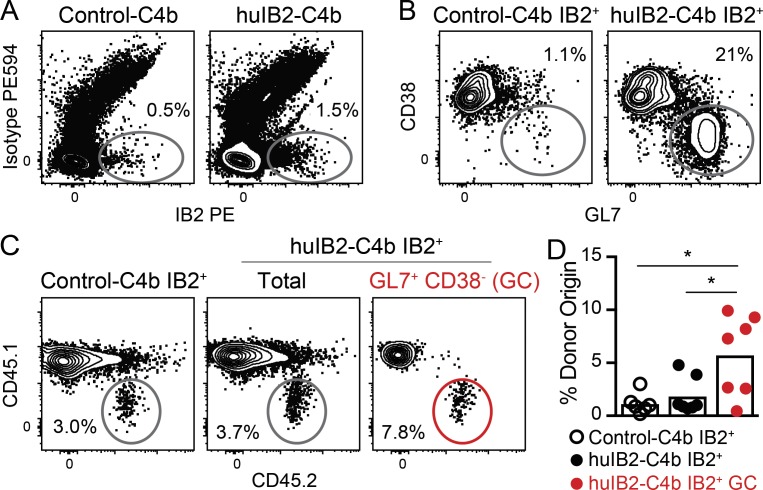
Many tested vaccines fail to provide protection against disease despite the induction of antibodies that bind the pathogen of interest. In light of this, there is much interest in rationally designed subunit vaccines that direct the antibody response to protective epitopes. Here, we produced a panel of anti-idiotype antibodies able to specifically recognize the inferred germline version of the human immunodeficiency virus 1 (HIV-1) broadly neutralizing antibody b12 (iglb12). We determined the crystal structure of two anti-idiotypes in complex with iglb12 and used these anti-idiotypes to identify rare naive human B cells expressing B cell receptors with similarity to iglb12. Immunization with a multimerized version of this anti-idiotype induced the proliferation of transgenic murine B cells expressing the iglb12 heavy chain in vivo, despite the presence of deletion and anergy within this population. Together, our data indicate that anti-idiotypes are a valuable tool for the study and induction of potentially protective antibodies.


Figures

Figure 1.
Figure 1.
Identification and characterization of anti-iglb12 idiotypes. (A) BLI analysis of the purified products of four hybridomas named IB1, IB2, IB3, and IB5 binding to different concentrations of iglb12. (B) The affinity (KD) of the anti-idiotype for iglb12 was calculated based upon the on rate (KON) and off rate (KOFF) determined by BLI. (C) The heat map displays the maximum shift (nm) measured by BLI when IB1, IB2, IB3, or IB5 were incubated with the listed antibodies and antibody groups. Detailed information on sequences of the non–VH1-3 and VH1-3+ control antibodies can be found in Table S1. Data are representative of two to three similar experiments.
Figure 2.
Figure 2.
Crystal structure analysis of anti-idiotypes bound to iglb12. (A and F) Ribbon diagrams and surface representation of Fab fragments of anti-iglb12 idiotypes IB3 bound to a Fab fragment of iglb12 (A) and IB2 bound to an iglb12 c/scFv (F) at a resolution of 3.0 Å and 2.6 Å, respectively. (B–E and G–J) Quantitation of the number of hydrogen bonds and the percentage of total BSA within the listed regions of iglb12 bound by IB3 (B–E) and IB2 (G–J), as determined from the crystal structures.
Figure 3.
Figure 3.
Identification of human B cells able to bind anti-iglb12 idiotypes. (A) Detection of live CD19+ CD3 CD14 CD16 B cells from human PBMCs that bound a cocktail containing IB1-APC, IB2-APC, and IB3-APC tetramers in fractions enriched or depleted of APC+ cells using anti-APC microbeads before flow cytometry. APC755 tetramers containing isotype control antibodies were included in these experiments to exclude B cells specific for the APC, streptavidin, and conserved portions of the anti-idiotypes. The displayed plots were derived from ∼100,000 APC-depleted or ∼400,000 APC-enriched cells derived from 100 million PBMCs and representative of three similar experiments. The mean percentage ± SD of IB1/2/3-APC+ APC755 B cells in the enriched and depleted fractions from three individuals is shown on the plots. (B) The frequency of ten antibodies cloned from IB1/IB2/IB3-APC+ APC755 B cells from an individual were assayed for binding to IB1, IB2, IB3, or IB5 by BLI. Each antibody was assessed for binding in two to three independent experiments.
Figure 4.
Figure 4.
Identification and analysis of human B cells able to bind anti-iglb12 idiotypes. (A) Detection of live CD19+ CD3 CD14 CD16 B cells from human PBMCs that bound IB2-PE and IB3-APC tetramers with or without enrichment using anti-PE and anti-APC microbeads before flow cytometry. PE594 and APC755 tetramers containing isotype control antibodies were included in these experiments to exclude B cells specific for the PE, APC, streptavidin, and conserved portions of the anti-idiotypes. The displayed plots were derived from ∼400,000 unfractionated PBMCs or ∼400,000 PE- and APC-enriched cells derived from 200 million PBMCs and representative of three individuals in three independent experiments. The percentages of single and double positive B cells in the enriched and unenriched fractions from one individual are shown on the plots. (B) The frequency of heavy chains using VH1-3 within the population of IB2+ B cells, IB3+ B cells, and a population of control B cells that was not selected based upon antigen binding are displayed for three individuals. (C) The frequency of total VH1-3+, IB2+ VH1-3+, and IB3+ VH1-3+ within the entire B cell repertoire is displayed for three individuals. (D) The frequency of VK3-20/VK3D-20 usage among 120 IB2+ VH1-3+ BCRs and 10 IB3+ VH1-3+ BCRs using kappa light chains pooled from three individuals are compared with 259 VH1-3+ BCRs using kappa light chains from a control dataset derived from naive B cells (DeKosky et al., 2016). (E) Quantitation of the percent BSA between IB2 and the segments derived from VH1-3, DH2-21, JH6, and N nucleotide additions within iglb12 heavy chain CDRH3 from the crystal structures displayed in Fig. 2. (F) DH2-21 usage among 228 IB2+ VH1-3+ BCRs pooled from three individuals are compared with 467 VH1-3+ BCRs from a control dataset derived from naive B cells (DeKosky et al., 2016). (G) Comparison of CDRH3 similarity from 228 IB2+ VH1-3+ BCRs compared with the CDRH3 of iglb12 using pairwise alignment. The P values (*, P < 0.05; **, P < 0.01; ***, P < 0.001) in B and C were determined using an unpaired two-tailed Student’s t test, and the P values in D were determined by Fisher’s exact test.
Figure 5.
Figure 5.
Assessment of iglb12 autoreactivity. (A and B) Representative immunofluorescence images (A; scale bar, 100 µm) and quantitation of iglb12 and the mature form of b12 bound to human HEp-2 cells compared with a positive control antibody shown previously to bind HEp-2 cells, 4E10, and a negative control antibody, 10E8 (B). Data points in B were combined from four independent experiments and represent the average Alexa Fluor 594 fluorescence per HEp-2 cell. The P values (*, P < 0.04) were determined using an unpaired two-tailed Student’s t test, and the bar indicates the mean (n = 2–4).
Figure 6.
Figure 6.
Analysis of the development and subset distribution of transgenic B cells expressing the iglb12 heavy chain. (A and C) Representative flow cytometric gating of B cell (CD19+ CD3 Gr-1 F4/80) subsets in the (A) spleen and (C) bone marrow of transgenic mice expressing the heavy chain from iglb12 (iglb12 IgH transgenic [Tg]) or a control population expressing the inferred germline heavy chain of VRC01 (control IgH transgenic). The percentages of cells within each gate are from representative animals. (B, D, and E) Combined data from four experiments showing the total number of (B) mature B cells in the spleen, (D) immature B cells in the bone marrow, and (E) the transitional T1, T2, and T3 B cell subsets in the spleen of individual transgenic mice (n = 5–11). The bar indicates the mean, and the P values (*, P < 0.04; **, P < 0.01; ***, P < 0.001) were determined using an unpaired two-tailed Student’s t test.
Figure 7.
Figure 7.
Reduced BCR expression by mature transgenic B cells expressing the iglb12 heavy chain. (A–C) Representative flow cytometric analysis and quantitation of (A) IgM, (B) IgD, and (C) CD79β expression by mature CD93 B220+ CD19+ CD3 Gr-1 F4/80 B cells in the spleen of iglb12 heavy chain transgenic (Tg), control heavy chain transgenic, and WT mice. Data are pooled from four independent experiments, which were normalized to account for experiment-to-experiment variability by displaying the data as a geometric mean fluorescence intensity (gMFI) fold increase over background fluorescence in CD19 B220 non-B cells. The bar indicates the mean, and P values (**, P < 0.001; ***, P < 0.001) were determined using an unpaired two-tailed Student’s t test (n = 3–11).
Figure 8.
Figure 8.
In vitro response of transgenic B cells expressing the iglb12 heavy chain. (A and B) Representative flow cytometric analysis (A) and quantitation of the percentage of CTVDILUTED B cells (B) from individual iglb12 heavy chain transgenic (Tg) or WT control mice were labeled with CTV following in vitro culture in the presence of 2, 5, 10, or 25 µg/ml polyclonal goat anti-mouse Ig or media alone for 72 h. The percentages of B cells in the gates are shown in A. (B) Mean percentage ± SD of CTVDILUTED cells found in samples from seven individual mice from three independent experiments. The P values (*, P < 0.05; **, P < 0.01; ***, P < 0.001) were determined using an unpaired two-tailed Student’s t test.
Figure 9.
Figure 9.
In vivo response of transgenic B cells expressing the iglb12 heavy chain following the injection of a multimerized anti-iglb12 idiotype. Data from three experiments in which 4 × 10⁵ purified B cells from CD45.2+ iglb12 heavy chain transgenic mice were labeled with CTV and adoptively transferred retro-orbitally into WT CD45.1+ recipients 1 d before intraperitoneal immunization with 20 µg huIB2-C4b or control-C4b and 25 µg of Sigma Adjuvant System. 5 or 14 d later, spleen and lymph nodes from individual mice were pooled and enriched for CD45.2-biotin+ iglb12 heavy chain transgenic donor cells using anti-biotin microbeads before analysis by flow cytometry. (A and B) Representative gating (A) and quantitation (B) of CD45.2+ CD45.1 CD19+ CD3 Gr-1 F4/80 donor iglb12 heavy chain transgenic B cells from the CD45.2-enriched fractions from individual recipient mice. The percentage on the plot in A represents the frequency of donor cells among only the B cells in the enriched fraction, while the percentages in B represent the frequency of donor B cells when B cells from the depleted fraction are included in the calculation. (C and D) Representative gating (C) and quantitation (D) of donor iglb12 heavy chain transgenic B cells with diluted CTV. The percentages of cells within gates in C are from representative animals. (E and F) Representative gating (E) and quantitation (F) of donor GL7+ CD38 iglb12 heavy chain transgenic germinal center (GC) B cells. The percentages of cells within gates in E are from representative animals. The bars in B, D, and F plot the mean from individual recipient mice, and P values (*, P < 0.05; **, P < 0.01; ***, P < 0.001) were determined using an unpaired two-tailed Student’s t test (n = 3–7).
Figure 10.
Figure 10.
Transgenic B cells expressing the iglb12 heavy chain enter germinal centers despite competition from WT cells. Data from two experiments in which 4 × 10⁵ purified B cells from CD45.2+ iglb12 heavy chain transgenic mice were labeled with CTV and adoptively transferred retro-orbitally into WT CD45.1+ recipients 1 d before intraperitoneal immunization with 20 µg huIB2-C4b or control-C4b and 25 µg Sigma Adjuvant System. 14 d later, spleen and lymph nodes from individual mice were pooled and enriched for IB2-PE+ and CD45.2-biotin+ iglb12 heavy chain transgenic donor cells using anti-PE and anti-biotin microbeads before analysis by flow cytometry. (A) Representative flow cytometric analysis of live CD19+ CD3 Gr-1 F4/80 B cells binding IB2-PE tetramers, but not isotype control PE594 tetramers. (B) Representative gating of GL7+ CD38 germinal center B cells in the IB2+ population described in A. (C and D) Representative gating (C) and quantitation(D) of the frequency of CD45.2+ CD45.1 donor B cells within the total IB2+ and IB2+ GL7+ CD38 germinal center populations described in A and B. The percentages of cells within gates in A–C are from representative animals. The bars in D represent the mean from individual recipient mice (n = 6–7), and P values (*, P < 0.05) were determined using an unpaired two-tailed Student’s t test.

References

    1. Abbott R.K., Lee J.H., Menis S., Skog P., Rossi M., Ota T., Kulp D.W., Bhullar D., Kalyuzhniy O., Havenar-Daughton C., et al. . 2018. Precursor Frequency and Affinity Determine B Cell Competitive Fitness in Germinal Centers, Tested with Germline-Targeting HIV Vaccine Immunogens. Immunity. 48:133–146.e6. 10.1016/j.immuni.2017.11.023 - DOI - PMC - PubMed
    1. Adams P.D., Afonine P.V., Bunkóczi G., Chen V.B., Davis I.W., Echols N., Headd J.J., Hung L.W., Kapral G.J., Grosse-Kunstleve R.W., et al. . 2010. PHENIX: a comprehensive Python-based system for macromolecular structure solution. Acta Crystallogr. D Biol. Crystallogr. 66:213–221. 10.1107/S0907444909052925 - DOI - PMC - PubMed
    1. Agrawal A.S., Ying T., Tao X., Garron T., Algaissi A., Wang Y., Wang L., Peng B.H., Jiang S., Dimitrov D.S., and Tseng C.T.. 2016. Passive Transfer of A Germline-like Neutralizing Human Monoclonal Antibody Protects Transgenic Mice Against Lethal Middle East Respiratory Syndrome Coronavirus Infection. Sci. Rep. 6:31629 10.1038/srep31629 - DOI - PMC - PubMed
    1. Agrawal S., Smith S.A., Tangye S.G., and Sewell W.A.. 2013. Transitional B cell subsets in human bone marrow. Clin. Exp. Immunol. 174:53–59. 10.1111/cei.12149 - DOI - PMC - PubMed
    1. Allen C.D., Okada T., and Cyster J.G.. 2007. Germinal-center organization and cellular dynamics. Immunity. 27:190–202. 10.1016/j.immuni.2007.07.009 - DOI - PMC - PubMed

Publication types