. 2019 Oct 7;216(10):2316-2330.
doi: 10.1084/jem.20190446. Epub 2019 Jul 25.

Anti-idiotypic antibodies elicit anti-HIV-1-specific B cell responses

Affiliations

Anti-idiotypic antibodies elicit anti-HIV-1-specific B cell responses

Pia Dosenovic et al. J Exp Med. .

Abstract

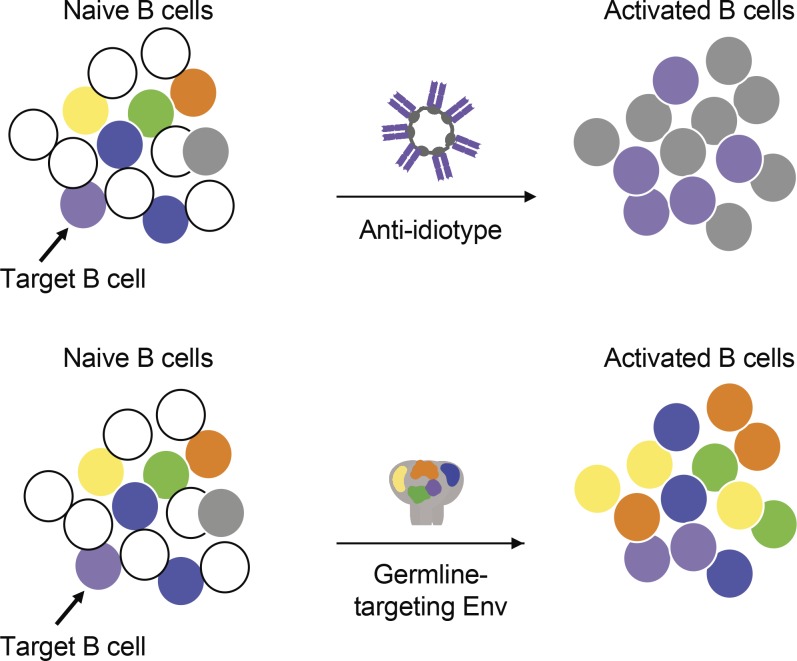
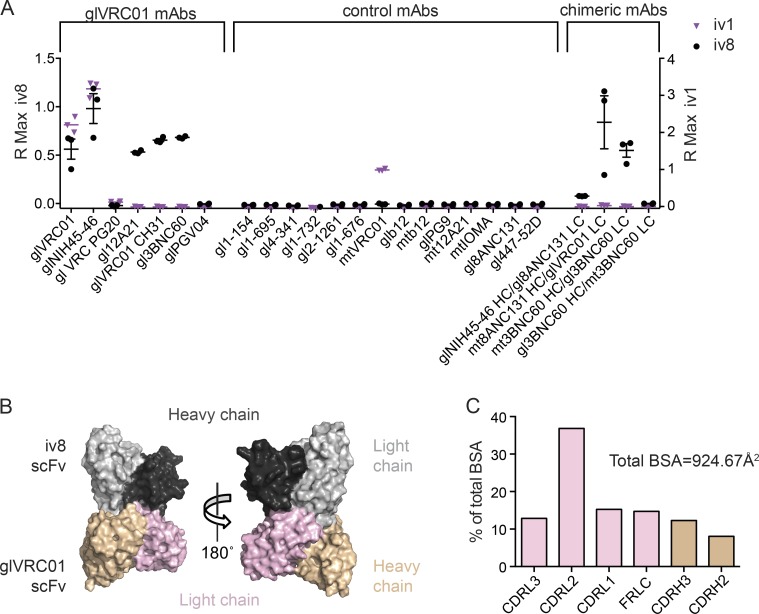
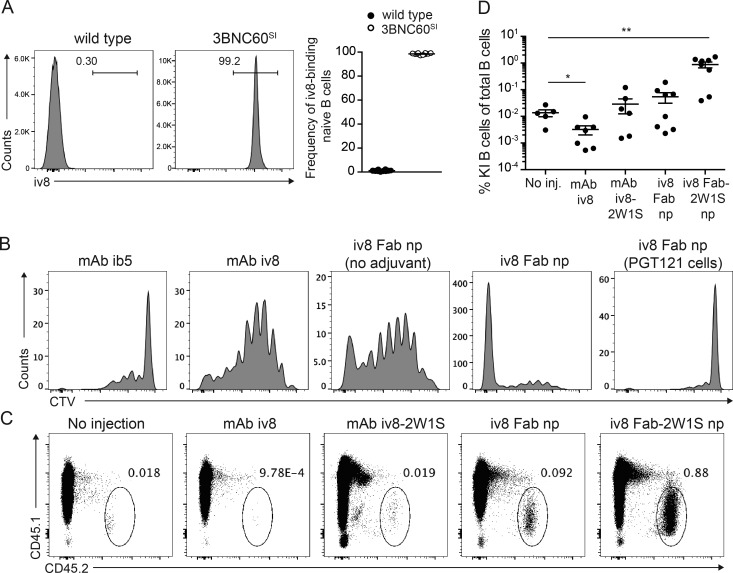
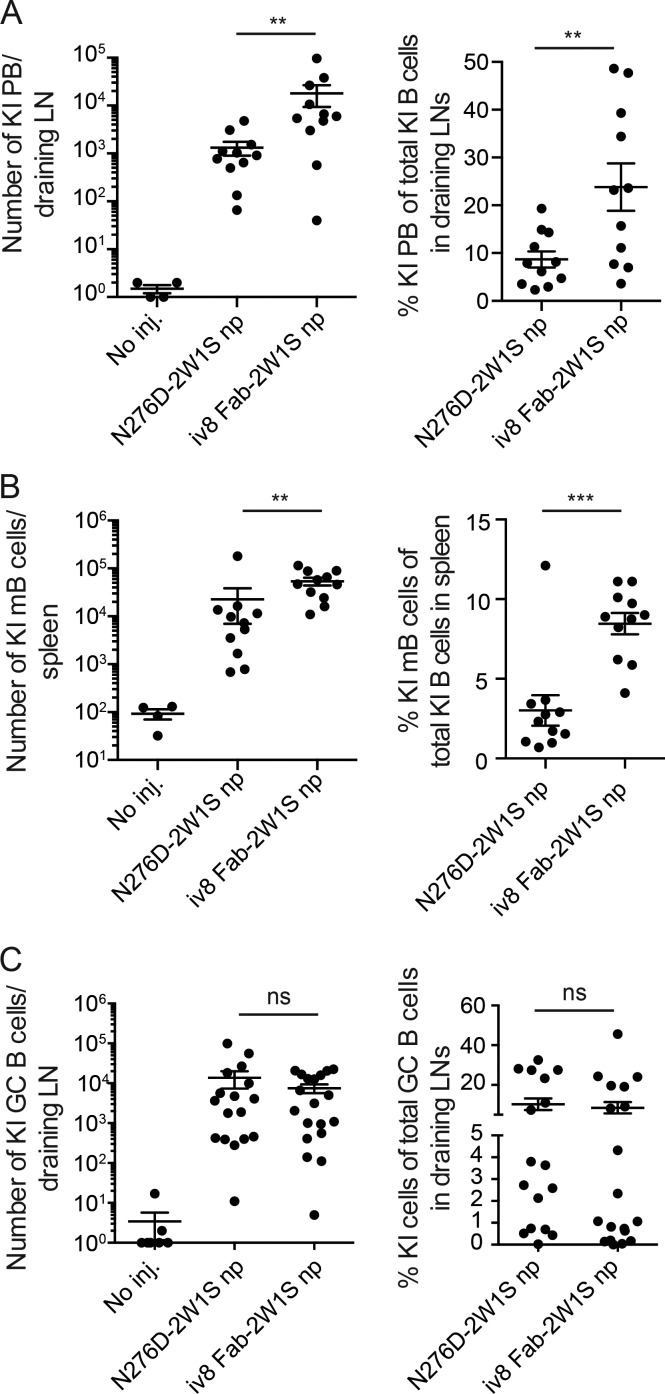
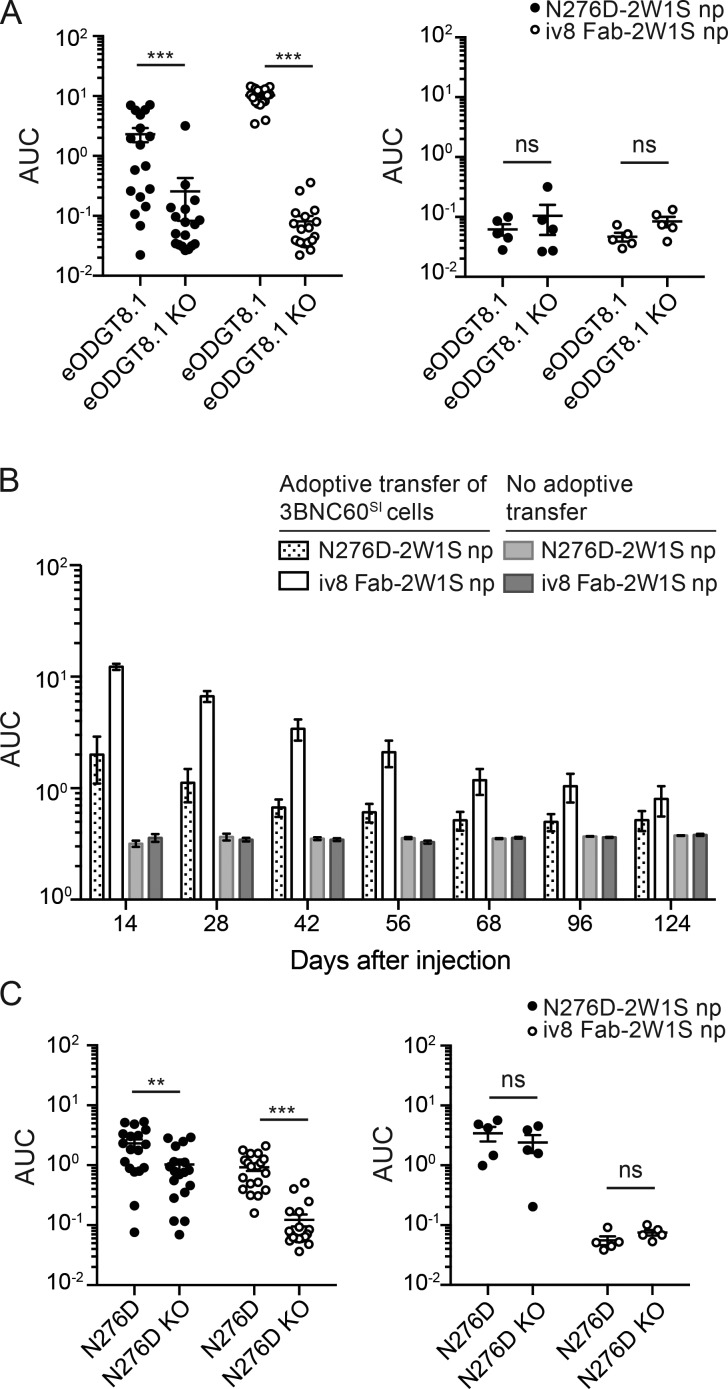
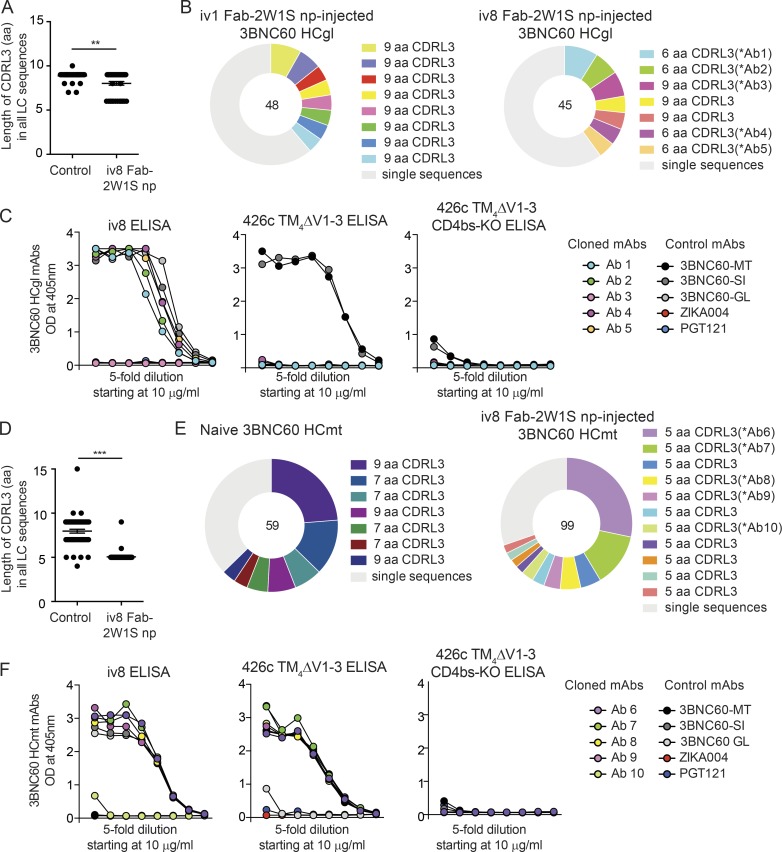
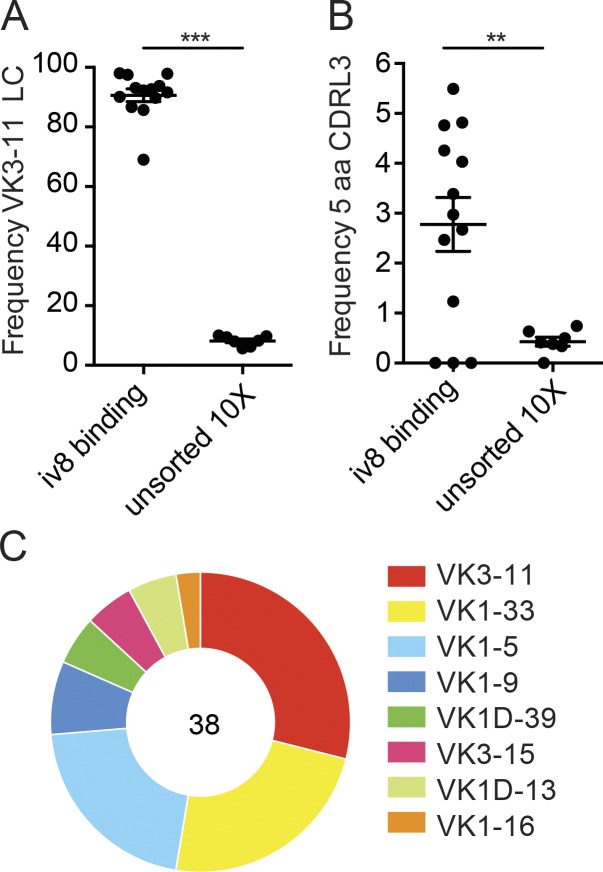
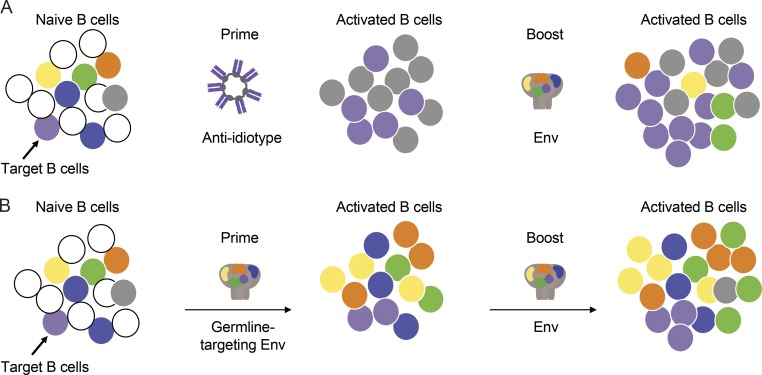
Human anti-HIV-1 broadly neutralizing antibodies (bNAbs) protect against infection in animal models. However, bNAbs have not been elicited by vaccination in diverse wild-type animals or humans, in part because B cells expressing the precursors of these antibodies do not recognize most HIV-1 envelopes (Envs). Immunogens have been designed that activate these B cell precursors in vivo, but they also activate competing off-target responses. Here we report on a complementary approach to expand specific B cells using an anti-idiotypic antibody, iv8, that selects for naive human B cells expressing immunoglobulin light chains with 5-amino acid complementarity determining region 3s, a key feature of anti-CD4 binding site (CD4bs)-specific VRC01-class antibodies. In mice, iv8 induced target cells to expand and mature in the context of a polyclonal immune system and produced serologic responses targeting the CD4bs on Env. In summary, the results demonstrate that an anti-idiotypic antibody can specifically recognize and expand rare B cells that express VRC01-class antibodies against HIV-1.


Figures

None
Graphical abstract
Figure 1.
Figure 1.
iv8 binding to inferred germline VRC01-class BCRs. (A) iv8 (black circles) and iv1 (purple triangles) binding to the indicated recombinant inferred-germline (gl), mutated (mt), or chimeric human monoclonal antibodies using BLI. Data points depict the maximum binding response (R Max) of the mAb following a 500-s association step. Each point represents the R Max of an independent replicate (n = 3). Lines indicate arithmetic means; error bars indicate SEM; HC and LC indicate IgHs and IgLs, respectively. (B) Structure of iv8 scFv bound to germline VRC01 scFv. The iv8 IgH and IgLs are shown in dark and light gray, respectively. Germline VRC01 IgH and IgLs are shown in beige and pink, respectively. (C) Distribution of BSA on glVRC01 upon iv8 binding. BSA on light-chain regions is shown in pink; BSA on heavy-chain regions is shown in beige.
Figure 2.
Figure 2.
Expansion of VRC01-class B cells in vivo. (A) Representative flow cytometric plots of iv8-binding naive B cells from one wild-type mouse and one 3BNC60SI mouse of 10 analyzed (left panels). Arithmetic mean frequency of iv8-binding naive B cells from 10 mice per group. Error bars indicate SEM (right). One representative experiment of three is shown. (B) Representative flow cytometry plots showing proliferation of adoptively transferred 3BNC60SI cells as indicated by CTV dilution at 5 d after injection of (from left to right) control mAb (ib5, binds glb12 but not gl3BNC60) with Ribi, mAb iv8 with Ribi, iv8 Fab nanoparticles (np) without Ribi, iv8 Fab nanoparticles with Ribi, and CTV-labeled control PGT121 knock-in B cells in response to iv8 Fab nanoparticles with Ribi. One representative animal of four per group is shown from one experiment of three. (C) Flow cytometry plots pregated on total B cells (lymphocytes, singlets, dump, live, B220+) indicating frequency of 3BNC60SI knock-in cells of total B cells at 14 d after injection of the indicated constructs in Ribi adjuvant conjugated to 2W1S peptide or not. One representative animal of two to five per group in one experiment of three. (D) Frequency of 3BNC60SI knock-in cells in mice injected as in C. Lines indicate arithmetic mean values of individual mice per group, with error bars indicating SEM of two replicate experiments with two to five mice per group per experiment. Statistics were calculated using the Mann–Whitney U test. *, P ≤ 0.05; **, P ≤ 0.01.
Figure 3.
Figure 3.
B cell fates in response to iv8 Fab-2W1S or N276D-2W1S nanoparticles. (A) Number of 3BNC60SI knock-in (KI) plasmablasts (PB; CD138+B220lowEnvhigh; left) or frequency of 3BNC60SI plasmablasts of total 3BNC60SI cells (right) per draining LN in 2W1S-primed adoptively transferred wild-type mice 5 d after injection (inj.) with iv8 Fab-2W1S or N276D-2W1S nanoparticles (np) compared with noninjected controls. Lines indicate arithmetic means, and error bars indicate SEM. Each data point represents the average from two draining lymph nodes collected from a single animal (n = 4 uninjected, n = 11 N276D-2W1S np injected, n = 11 iv8 Fab-2W1S np injected). Merged data from two independent experiments are shown. (B) As in A, but measuring number of 3BNC60SI early memory B cells (mB; B220+CTVlowGL7CD38+; left) or frequency of 3BNC60SI early memory B cells of total 3BNC60SI (right) in spleen at 5 d after injection. Lines indicate arithmetic means, with error bars indicating SEM. Each data point represents the analysis in spleen of one animal (n = 4 uninjected, n = 11 N276D-2W1S np injected, n = 11 iv8 Fab-2W1S np injected). Merged data from two independent experiments. (C) As in A, but measuring 3BNC60SI GC B cells (B220+CD95+CD38; left) and frequency of 3BNC60SI cells of total GCs (right) 14 d after injection. Lines indicate arithmetic means, and error bars indicate SEM. Merged data from three independent experiments are shown. Each data point represents the average number from two draining lymph nodes collected from a single animal (n = 7 uninjected, n = 17 N276D-2W1S np injected, n = 19 iv8 Fab-2W1S np injected). Statistics in A–C were calculated using the Mann–Whitney U test. **, P ≤ 0.01; ***, P ≤ 0.001; ns, nonsignificant.
Figure 4.
Figure 4.
Serum antibody titers. (A) Serum antibody titers against eOD-GT8 and eOD-GT8-KO in 2W1S-primed wild-type mice at 14 d after injection with Env N276D-2W1S or iv8 Fab-2W1S nanoparticles (np) in the presence (left panel) or absence (right panel) of adoptively transferred 3BNC60SI cells. Merged data from three independent experiments is shown with five to nine mice per group (left panel; n = 18 N276D-2W1S np injected, n = 20 iv8 Fab-2W1S np injected, right panel; n = 5 N276D-2W1S np injected, n = 5 iv8 Fab-2W1S np injected). Lines indicate arithmetic means. Error bars indicate SEM. (B) Serum antibody titers against eOD-GT8 from mice injected as in A at time points between 14 and 124 d after injection. Merged data from two independent experiments. Bars indicate arithmetic mean, and error bars indicate SEM. Merged data from two independent experiments are shown with two to five mice per group in each experiment (n = 10 N276D-2W1S np injected, n = 10 iv8 Fab-2W1S np injected). (C) ELISA using serum from same animals in A, to measure responses to Env N276D (N276D) and Env N276D KO (N276D KO). Statistics in A and C were calculated using the Mann–Whitney U test. **, P ≤ 0.01; ***, P ≤ 0.001; ns, nonsignificant. AUC, area under the curve.
Figure 5.
Figure 5.
Selection for VRC01-class IgLs by iv8 in heavy-chain knock-in mice. (A) CDRL3 lengths in amino acids of BCRs from single-cell sorted IgG1+ GC B cells (B220+CD95+CD38IgG1+) from two control-injected (iv1 Fab-2W1S nanoparticles [np], which bind glVRC01 and glNIH45-46 but not gl3BNC60) and two iv8 Fab-2W1S np-injected 2W1S-primed 3BNC60 HCgl mice obtained 14 d after injection. Lines indicate arithmetic means; error bars indicate SEM. (B) Pie charts indicate B cell clones from sequences obtained in A. Each color represents a clone. Light gray indicates single sequences obtained from nonclonal B cells. Numbers in the middle of the pie chart indicate the total number of sequences analyzed. (C) Representative monoclonal antibodies corresponding to the BCR sequences determined in B (Ab1–Ab5) were tested in ELISA against iv8 (left), 426cTM4ΔV1-3 (middle), or 426cTM4ΔV1-3 CD4bs-KO (right). Graphs are representative of two independent experiments. (D) Graph indicating CDRL3 lengths in amino acids of BCRs from single-cell sorted naive and memory B cells purified on the basis of 426c TM4ΔV1–3 antigen binding. Memory cells (B220+IgMCD38+IgG1+) were obtained from 2W1S-primed 3BNC60 HCmt mice injected with iv8 Fab-2W1S nanoparticles 42 d after injection. Lines indicate arithmetic means, and error bars indicate SEM. (E) Pie charts (visualized as in B) indicate sequenced B cell clones obtained in D. (F) Representative monoclonal antibodies corresponding to the BCR sequences determined in E (Ab6–Ab10), were tested by ELISA for binding to iv8 (left), 426cTM4ΔV1-3 (middle), or 426cTM4ΔV1-3 CD4bs-KO (right). Graphs are representative of two independent experiments. 3BNC60-MT, 3BNC60-SI, and 3BNC60-GL mAbs are included as controls, and ZIKA004 and PGT121 are included as negative mAb controls in C and F. Statistics were calculated using the Mann–Whitney U test in A and D. **, P ≤ 0.01; ***, P ≤ 0.001. LC, light chain.
Figure 6.
Figure 6.
iv8-binding to human peripheral blood cells. Single naive human B cells were purified by cell sorting with fluorescently labeled iv8, and the IgL kappa transcripts were recovered by RT-PCR and sequenced or subjected to paired BCR sequencing using the chromium platform from 10X Genomics. As a control, naive human B cells were enriched using magnetic beads, and paired BCR sequencing was performed using the chromium platform. (A) Frequency of IgL kappa transcripts derived from VK3-11 in iv8+ or total B cells. Each dot represents one iv8+ sort (n = 13) or paired chromium sequencing run of magnetic bead–enriched (total naive) B cells (n = 7). (B) Frequency sequenced IgL kappa transcripts with a 5-aa CDLR3 in iv8+ or total B cells. Each dot represents one iv8+ sort (n = 13) or chromium sequencing run of magnetic bead–enriched (total naive) B cells (n = 7). Lines in A and B indicate arithmetic means, and error bars indicate SEM. (C) IgVK gene usage for of iv8+ B cells with 5-aa CDRL3s identified in B. Number in the middle of the pie chart indicates the total number of IgL kappa sequences analyzed. Statistics were calculated using two-tailed unpaired Student’s t tests in A and B. **, P ≤ 0.01; ***, P ≤ 0.001. LC, light chain.
Figure 7.
Figure 7.
Model for an anti-idiotype-prime/Env-boost regimen. (A) An initial pool of B cells including off-target Env-specific B cells (yellow, green, orange, and blue), on-target Env-specific bNAb precursor B cells (purple), off-target anti-idiotypic antibody-specific B cells directed against the multimerization domain and constant regions (gray), and irrelevant B cells (white; left). Activated B cell responses to immunization with an anti-idiotype prime that expands bNAb precursor B cells and B cells that recognize the constant region and multimerization domains of the anti-idiotype (middle). A boost with an Env-derived immunogen specifically expands the bNAb precursor B cells that were preexpanded by the anti-idiotype-prime as well as some off-target Env specific cells (right). (B) The same initial pool of B cells (left) responds to immunization with Env by producing expanded clones of Env-reactive B cells including bNAb precursors and off-target B cells (middle). Boosting with another Env-derived immunogen amplifies both target and off-target B cells (right).

Similar articles

Cited by

References

    1. Abbott R.K., Lee J.H., Menis S., Skog P., Rossi M., Ota T., Kulp D.W., Bhullar D., Kalyuzhniy O., Havenar-Daughton C., et al. . 2018. Precursor Frequency and Affinity Determine B Cell Competitive Fitness in Germinal Centers, Tested with Germline-Targeting HIV Vaccine Immunogens. Immunity. 48:133–146.e6. 10.1016/j.immuni.2017.11.023 - DOI - PMC - PubMed
    1. Adams P.D., Afonine P.V., Bunkóczi G., Chen V.B., Davis I.W., Echols N., Headd J.J., Hung L.W., Kapral G.J., Grosse-Kunstleve R.W., et al. . 2010. PHENIX: a comprehensive Python-based system for macromolecular structure solution. Acta Crystallogr. D Biol. Crystallogr. 66:213–221. 10.1107/S0907444909052925 - DOI - PMC - PubMed
    1. Alam S.M., Aussedat B., Vohra Y., Meyerhoff R.R., Cale E.M., Walkowicz W.E., Radakovich N.A., Anasti K., Armand L., Parks R., et al. . 2017. Mimicry of an HIV broadly neutralizing antibody epitope with a synthetic glycopeptide. Sci. Transl. Med. 9:eaai7521 10.1126/scitranslmed.aai7521 - DOI - PMC - PubMed
    1. Andrabi R., Voss J.E., Liang C.H., Briney B., McCoy L.E., Wu C.Y., Wong C.H., Poignard P., and Burton D.R.. 2015. Identification of Common Features in Prototype Broadly Neutralizing Antibodies to HIV Envelope V2 Apex to Facilitate Vaccine Design. Immunity. 43:959–973. 10.1016/j.immuni.2015.10.014 - DOI - PMC - PubMed
    1. Azoitei M.L., Correia B.E., Ban Y.E., Carrico C., Kalyuzhniy O., Chen L., Schroeter A., Huang P.S., McLellan J.S., Kwong P.D., et al. . 2011. Computation-guided backbone grafting of a discontinuous motif onto a protein scaffold. Science. 334:373–376. 10.1126/science.1209368 - DOI - PubMed

Publication types