. 2019 Jul 25;10(1):3328.
doi: 10.1038/s41467-019-11112-0.

Analysis of polygenic risk score usage and performance in diverse human populations

Affiliations

Analysis of polygenic risk score usage and performance in diverse human populations

L Duncan et al. Nat Commun. .

Abstract

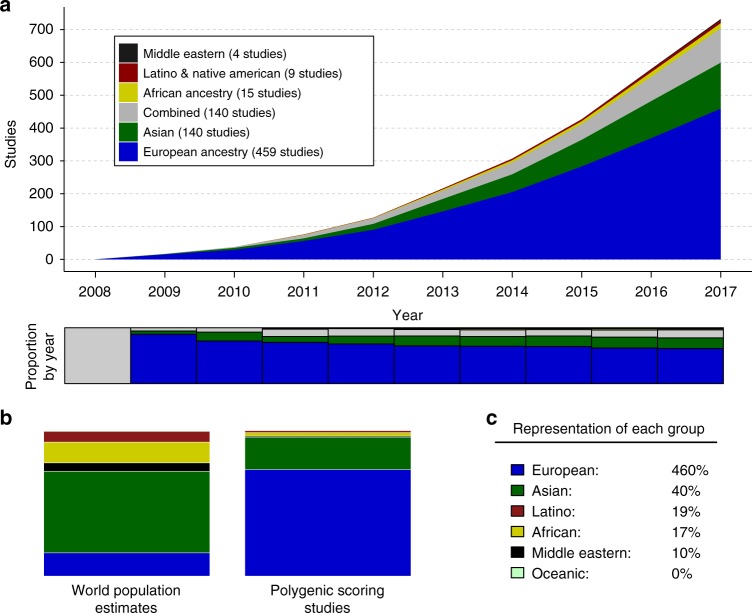
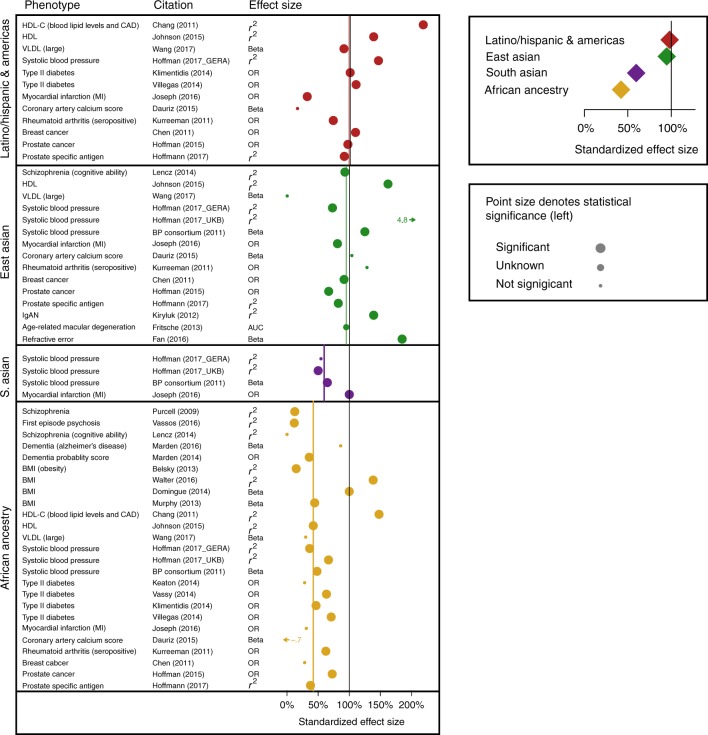
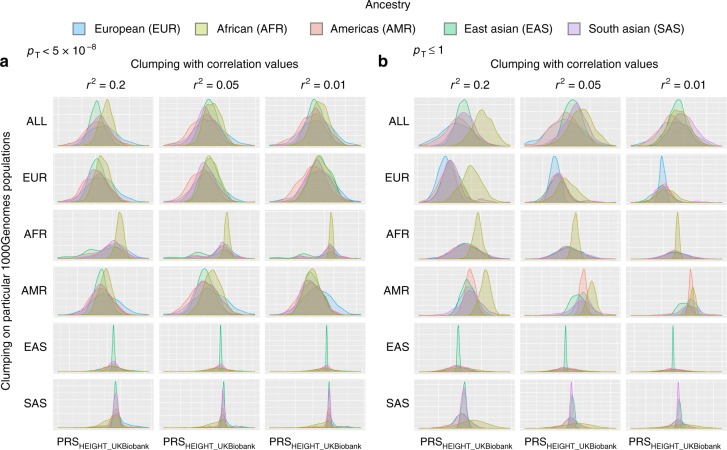
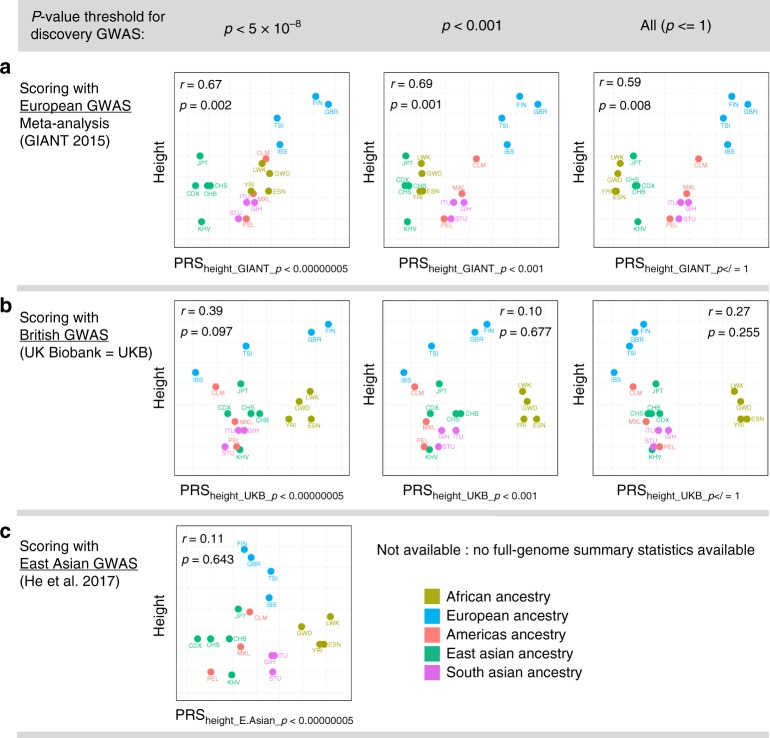
A historical tendency to use European ancestry samples hinders medical genetics research, including the use of polygenic scores, which are individual-level metrics of genetic risk. We analyze the first decade of polygenic scoring studies (2008-2017, inclusive), and find that 67% of studies included exclusively European ancestry participants and another 19% included only East Asian ancestry participants. Only 3.8% of studies were among cohorts of African, Hispanic, or Indigenous peoples. We find that predictive performance of European ancestry-derived polygenic scores is lower in non-European ancestry samples (e.g. African ancestry samples: t = -5.97, df = 24, p = 3.7 × 10⁻⁶), and we demonstrate the effects of methodological choices in polygenic score distributions for worldwide populations. These findings highlight the need for improved treatment of linkage disequilibrium and variant frequencies when applying polygenic scoring to cohorts of non-European ancestry, and bolster the rationale for large-scale GWAS in diverse human populations.


Conflict of interest statement

The authors declare no competing interests.

Figures

Fig. 1
Fig. 1
Ancestry representation in the first decade of polygenic scoring studies (2008–2017; N = 733 studies). a Cumulative numbers of studies by year are denoted by color. The stacked bar graph below the cumulative distribution plot shows proportional ancestry by year. b Stacked bar charts depict world ancestry representation (left) and polygenic scoring study representation (right). c The percentage representation for each ancestry group is given, such that 100% would indicate equal representation in the world and in polygenic scoring studies. For example, European ancestry samples are over-represented (460%) whereas African ancestry samples are under-represented (17%)
Fig. 2
Fig. 2
Forest plot of performance shows variation in polygenic score performance by ancestry (26 studies). Each row in the forest plot (left) represents one pair of polygenic analyses (i.e., in a non-European ancestry sample and a matched European ancestry sample from the same study. Phenotypes, citation information, and available effect sizes are given for each comparison. The vertical black line at 100% corresponds to equal performance in the non-European ancestry and the European ancestry samples. Vertical colored lines denote median standardized effect sizes, for each of the major ancestry groups. On the top right, median values for standardized effect sizes, for each major ancestry group, are given. Standard errors are not provided because many studies lacked sufficient information; however, statistical significance of each non-European ancestry analyses is denoted by point size. HDL-C high density lipoprotein cholesterol, VLDL very low-density lipoprotein, GERA Genetic Epidemiology Research on Aging, OR odds ratio, UKB UK Biobank, IgAN immunoglobulin A nephropathy, AUC area under the curve, BP blood pressure, BMI body mass index
Fig. 3
Fig. 3
Polygenic score distributions vary by ancestry and methodical choices. For polygenic score construction, clumping is often used, and investigator-driven choices can produce large differences in score distributions for global populations. Polygenic score distributions for the five major 1000Genomes populations are plotted, showing how investigator-driven choices impact score distributions. For all plots, weights were derived from the UK biobank height GWAS. Both r2 values used in clumping (r2= .2, .05, .01; see columns) and 1000Genomes populations used for clumping were varied (ALL, EUR, AFR, AMR, EAS, SAS; see rows). a, b correspond to the p-value threshold (pT) applied to the height summary statistics. a pT = genome-wide significant variants (p < 5 × 10−8); b pT = full genome variants (p < 1). PRS=polygenic risk score. ALL union of five 1000Genomes populations
Fig. 4
Fig. 4
Scatterplots of height polygenic scores (x-axis) and phenotypic height (y-axis). Plots demonstrate that correlations between polygenic scores for height and height are not consistent across discovery GWAS. The y-values for height are the same for each plot and reflect average height of individuals in the country of origin for each population included. Average heights (y-axis) are from a different height GWAS used to construct polygenic scores (x-axis). Three different GWAS of height were used (i.e., three rows) with three different p-value thresholds (i.e., three columns) for the construction of polygenic scores. a GIANT-based polygenic scores for height. b UK Biobank-based polygenic scores for height. c East Asian based polygenic scores for height. The last two plots are missing because only genome-wide significant variants were available for the East Asian GWAS of height. p and r values for each plot are for correlation tests between polygenic scores for height (x-axis) and height (y-axis). GWAS=genome-wide association study, GIANT=Genetic Investigation of ANthropometric Trait, PRS=polygenic risk score, population abbreviations within scatterplots are those used by the 1000Genomes Consortium and are available in Supplementary Table 3

Similar articles

Cited by

References

    1. Bustamante CD, Burchard EG, De la Vega FM. Genomics for the world. Nature. 2011;475:163–165. doi: 10.1038/475163a. - DOI - PMC - PubMed
    1. Petrovski S, Goldstein DB. Unequal representation of genetic variation across ancestry groups creates healthcare inequality in the application of precision medicine. Genome Biol. 2016;17:157. doi: 10.1186/s13059-016-1016-y. - DOI - PMC - PubMed
    1. Popejoy AB, Fullerton SM. Genomics is failing on diversity. Nature. 2016;538:161–164. doi: 10.1038/538161a. - DOI - PMC - PubMed
    1. Duncan LE, Pollastri AR, Smoller JW. Mind the gap: why many geneticists and psychological scientists have discrepant views about gene-environment interaction (G×E) research. Am. Psychol. 2014;69:249–268. doi: 10.1037/a0036320. - DOI - PMC - PubMed
    1. Dalvie S, et al. Large scale genetic research on neuropsychiatric disorders in African populations is needed. EBioMedicine. 2015;2:1259–1261. doi: 10.1016/j.ebiom.2015.10.002. - DOI - PMC - PubMed

Publication types