. 2019 Jul 25;10(1):3323.
doi: 10.1038/s41467-019-11275-w.

KLF-1 orchestrates a xenobiotic detoxification program essential for longevity of mitochondrial mutants

Affiliations

KLF-1 orchestrates a xenobiotic detoxification program essential for longevity of mitochondrial mutants

Marija Herholz et al. Nat Commun. .

Abstract

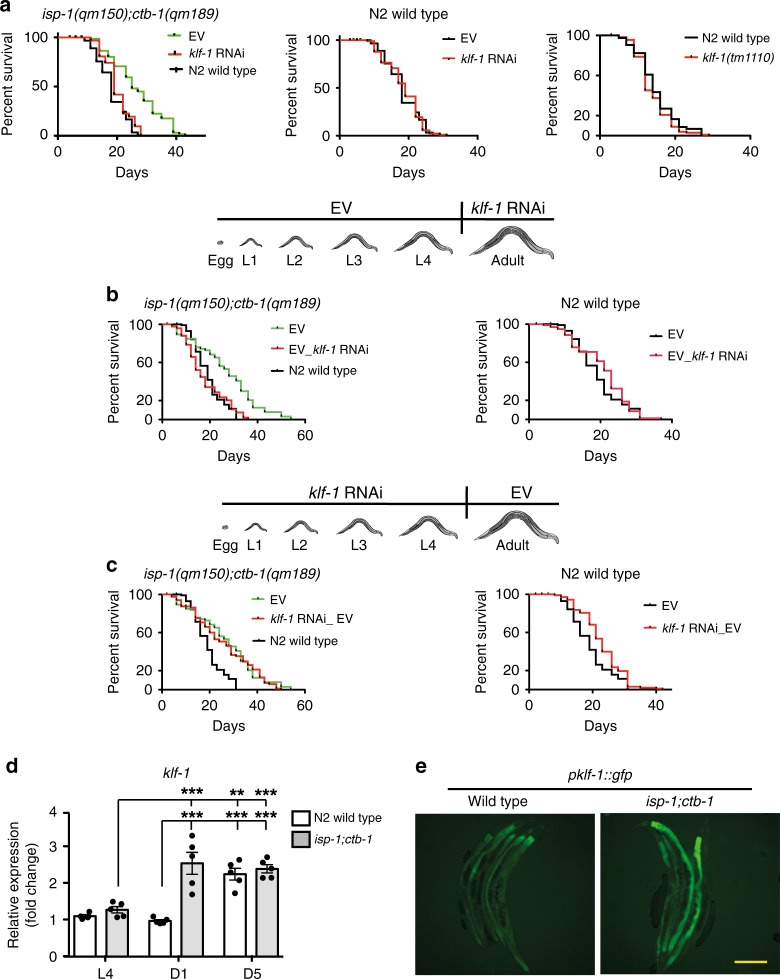
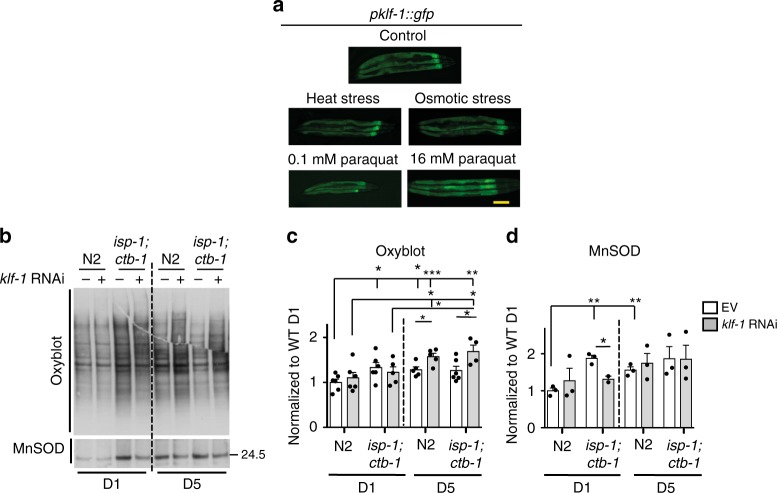
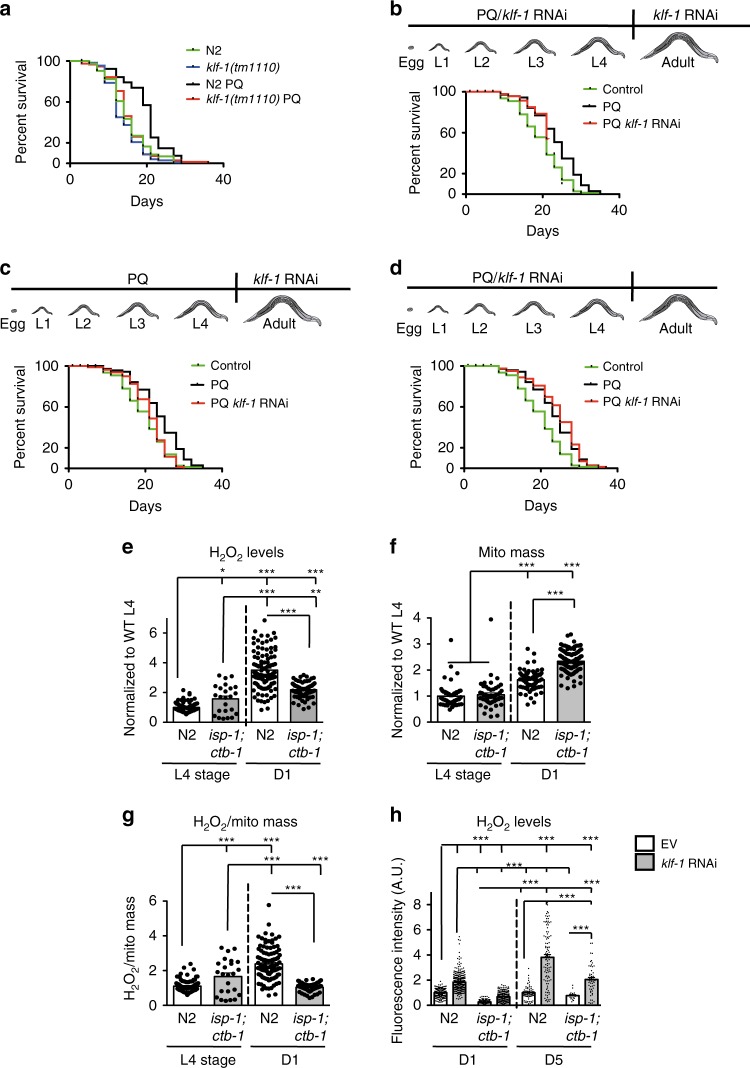
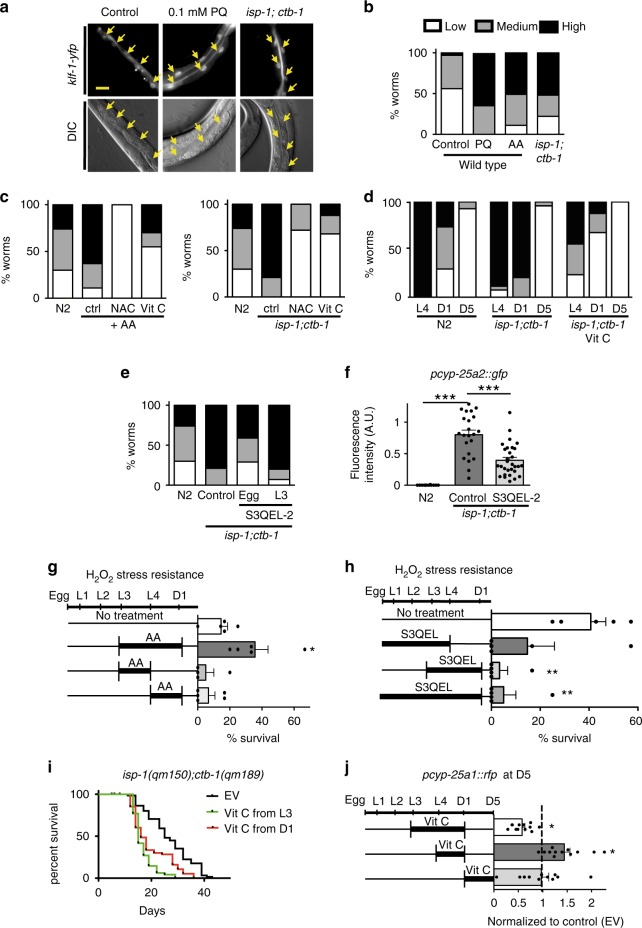
Most manipulations that extend lifespan also increase resistance to various stress factors and environmental cues in a range of animals from yeast to mammals. However, the underlying molecular mechanisms regulating stress resistance during aging are still largely unknown. Here we identify Krüppel-like factor 1 (KLF-1) as a mediator of a cytoprotective response that dictates longevity induced by reduced mitochondrial function. A redox-regulated KLF-1 activation and transfer to the nucleus coincides with the peak of somatic mitochondrial biogenesis that occurs around a transition from larval stage L3 to D1. We further show that KLF-1 activates genes involved in the xenobiotic detoxification programme and identified cytochrome P450 oxidases, the KLF-1 main effectors, as longevity-assurance factors of mitochondrial mutants. Collectively, these findings underline the importance of the xenobiotic detoxification in the mitohormetic, longevity assurance pathway and identify KLF-1 as a central factor in orchestrating this response.


Conflict of interest statement

The authors declare no competing interests.

Figures

Fig. 1
Fig. 1
KLF-1 mediates the longevity of mitochondrial isp-1;ctb-1 mutant. a Lifespan curves of isp-1(qm150);ctb-1(qm189) mutant (left) and wild-type animals (middle) grown on control (empty vector, EV) or klf-1 RNAi plates. Right panel shows lifespan curve of klf-1(tm1110) mutant animals. b isp-1(qm150);ctb-1(qm189) mutants (left) and wild type animals (right) were grown on control (EV) RNAi plates until L4 developmental stage and then transferred to klf-1 RNAi. c Lifespan curve of isp-1(qm150);ctb-1(qm189) mutant (left) and wild-type animals (right) grown on klf-1 RNAi plates until L4 developmental stage and then transferred to control (EV) RNAi. d klf-1 expression level was assessed by qPCR at the L4 larval stage, the first (D1) and the fifth day (D5) of adulthood, in the wild-type and isp-1(qm150);ctb-1(qm189) mutants. Data are presented as mean ± SEM. **p < 0.01, ***p < 0.001, one-way ANOVA with Tukey post hoc test. n = 5 samples per condition. e Fluorescent images of gfp expression under klf-1 promoter in wild type and isp-1(qm150);ctb-1(qm189) at the first day of adulthood. Scale bar 100 µm
Fig. 2
Fig. 2
KLF-1 mildly affects the mitochondrial UPR and does not directly affect the HIF-1 pathway. a Mitochondrial UPR was assayed by activation of gfp expression under the control of hsp-6 promoter. Confocal images (left) were taken at the first (D1) and the fifth (D5) day of adulthood in wild type and isp-1(qm150);ctb-1(qm189) mutant grown on control (EV) or klf-1 RNAi. Scale bar 100 µm. Quantification is shown on the right. Data are presented as mean ± SEM. *p < 0.05, ***p < 0.001, one-way ANOVA with Tukey post hoc test. n = 5 animals per condition. b Western blots showing levels of HSP-6, HSP-60 and GFP in proteins isolated from phsp-6::gfp transgenic strain, in N2 wild-type and isp-1(qm150);ctb-1(qm189) genetic background at D1 and D5 of adulthood. Tubulin was used as a loading control. c Targets of the HIF-1 transcription factor, nhr-57 and egl-9 were assayed for their mRNA expression on D1 and D5 of adulthood in N2 wild-type and isp-1(qm150);ctb-1(qm189) mutant. Data are presented as mean ± SEM. *p < 0.05, **p < 0.01, ***p < 0.001, one-way ANOVA with Tukey post hoc test. n = 4 independent samples per condition
Fig. 3
Fig. 3
klf-1 expression increases specifically upon oxidative stress, but not other types of stresses. a Fluorescent images of a strain expressing gfp under the klf-1 promoter. Young adults were exposed to osmotic and heat stress or 16 mM paraquat. For 0.1 mM paraquat, animals were treated with the drug during the larval development and imaged at the first day of adulthood. Scale bar 100 µm. b Oxyblot was performed on proteins isolated from the first (D1) or the fifth (D5) day old N2 wild-type and isp-1(qm150);ctb-1(qm189) animals. The bottom panel shows the same oxyblot membrane probed against SOD-2/MnSOD antibody. c Quantification of the oxyblot membranes of D1 and D5 old animals. Data are normalized to N2 D1 levels. Ponceau staining was used as loading control. Data are presented as mean ± SEM. *p < 0.05, **p < 0.01, ***p < 0.01, one-way ANOVA with Tukey post hoc test. n = 5 independent samples per condition. d Quantification of SOD-2/MnSOD levels of D1 and D5 old animals. Data are normalized to N2 D1 levels. Ponceau staining was used as loading control. Data are presented as mean ± SEM. *p < 0.05, **p < 0.01, one-way ANOVA with Tukey post hoc test. n = 3 independent samples per condition
Fig. 4
Fig. 4
KLF-1 mediates expression of cytochrome P450 oxidases. a log2 fold-change in gene expression in isp-1(qm150);ctb-1(qm189) mutant animals compared with N2 wild type, grown either on control (EV) or klf-1 RNAi from L4 larval stage. Microarray analysis was performed at the fifth day of adulthood. b The expression of cytochrome P450 oxidases from (a) was confirmed by qPCR. n = 4 independent samples per condition. Animals were analysed at the first (D1) or the fifth (D5) day of adulthood and grown on control (EV) and klf-1 RNAi whole life. c CHIP-qPCR analysis of WT and isp-1;ctb-1 for cyp-13a11 promoter region. n = 2 independent replicates. d Levels of Cyp2C70 and Cyp3A13 were assayed with qPCR in Hepa1-6 cells with or without antimycin A (AA) treatment as indicated. Cells were exposed to either Klf4, Klf5 or control siRNA. Data are presented as mean ± SEM. *p < 0.05, **p < 0.01, ***p < 0.001, one-way ANOVA with Tukey post hoc test. n = 4 independent samples per condition
Fig. 5
Fig. 5
KLF-1 regulates phase I, but not phase II detoxification pathway. a L1 larvae of N2 wild type, klf-1(tm1110), isp-1(qm150);ctb-1(qm189), isp-1(qm150);ctb-1(qm189);klf-1(tm1110) and phb-2(ad2154) were grown in liquid with and without 100 µM vinblastin. When all animals without treatment reached adulthood, the animals in the wells containing vinblastin were assayed for developmental stages. n = 5 wells per condition per experiment. Data presented are average of three separate experiments. b N2 wild-type and isp-1(qm150);ctb-1(qm189) animals were transferred at the fourth day of adulthood on plates containing 1 mM levamisole and assayed every 15 min for movement. Worms that failed to move upon gentle touch with silver wire were considered paralysed. n = 4 plates with 25 worms for each condition. c N2 wild type and isp-1(qm150);ctb-1(qm189) animals on control (EV), klf-1 and combined cyp-25a1 and cyp-13a11 RNAi (cyps) animals were treated with 20 mM H2O2 at the first (D1) day of adulthood and assayed for survival 4 h later. **p < 0.01, ***p < 0.001, one-way ANOVA with Tukey post hoc test. n = 100 animals per condition. d Survival curve of N2 wild type and isp-1(qm150);ctb-1(qm189) animals on control (EV) plates and combined cyp-25a1 and cyp-13a11 RNAi (cyps). Animals were exposed to RNAi from L4 larval stage. e Quantification of gfp expression under cyp-25a2 promoter in N2 wild type and isp-1(qm150);ctb-1(qm189) mutant background upon klf-1 and skn-1 RNAi at D1 and the fifth (D5) day of adulthood. Data are presented as mean ± SEM. *p < 0.05, **p < 0.01, ***p < 0.001, one-way ANOVA with Tukey post hoc test. n = 10 animals per condition. f Left panel shows representative confocal images of gfp expressed under gst-4 promoter in wild type animals. Animals were treated with acrylamide upon klf-1 and skn-1 RNAi at D1. Scale bar 100 µm. Right panel is the quantification of n = 5 animals per condition. Data are presented as mean ± SEM. *p < 0.05, ***p < 0.001, one-way ANOVA with Tukey post hoc test. g SKN-1 transcriptional targets gst-4 (left) and F56A4.4 (right) expression levels were quantified by qPCR in isp-1(qm150);ctb-1(qm189) animals upon klf-1 RNAi or combined cyp-25a1 and cyp-13a11 RNAi (cyps). Data are presented as mean ± SEM. *p < 0.05, **p < 0.01, Student’s T-test. n = 4 independent samples per condition
Fig. 6
Fig. 6
KLF-1 mediates a mitohormetic response in isp-1(qm150);ctb-1(qm189) mutants. a Lifespan curves of N2 wild-type and klf-1(tm1110) animals grown on 0.1 mM paraquat (PQ) their whole life. bd Worms were grown on 0.1 mM paraquat (PQ) until L4 larval stage and then transferred to paraquat-free plates. Worms were exposed to klf-1 RNAi either whole life (b), in adulthood (c) or during development (d). eg N2 wild-type and isp-1(qm150);ctb-1(qm189) animals were stained with Mitotracker Red CM-H2XRos (e) or Deep Red (f) to assay mitochondrial ROS levels and mitochondrial (mito) mass, respectively. Animals were assayed at larval L4 stage or D1 and the fluorescence was measured via Biosorter. A ratio between Mitotracker Red CM-H2XRos and Deep Red fluorescence measurements is shown in (g). h Mitotracker Red CM-H2XRos staining of N2 wild type and isp-1(qm150);ctb-1(qm189) animals grown on control (EV) or klf-1 RNAi plates and assayed at the D1 or D5 of adulthood. Data are presented as mean ± SEM. ***p < 0.001, one-way ANOVA with Tukey post hoc test. n = 60 animals per condition
Fig. 7
Fig. 7
KLF-1 activation is mediated by redox signalling. a Representative images of KLF-1-YFP, expressed under gut specific vha-6 promoter. Arrows indicate gut nuclei. Scale bar is 200 µm. be Animals were assayed based on KLF-1 nuclear localization as follows: “low” as less than 2 nuclei, “medium” 3–10 nuclei, and “high” where all nuclei were stained. Animals were imaged at D1, unless otherwise stated. n = 20 animals per condition. b WT animals were grown on control or plates containing 0.1 mM paraquat (PQ), or 1 µM Antimycin A (AA). c N2 animals were grown on control or plates containing 1 µM antymicin A or antimycin A in combination with 10 mM NAC or 10 mM vitamin C (left). Right, isp-1(qm150);ctb-1(qm189) were grown on 10 mM NAC or 10 mM vitamin C. As control, KLF-1-YFP nuclear localization in WT was used. d KLF-1-YFP expressing animals in N2 or isp-1(qm150);ctb-1(qm189) were assayed at L4 stage, D1 or D5, with or without vitamin C treatment. e isp-1(qm150);ctb-1(qm189) were grown on 100 µM S3QEL-2 either from egg stage or L3 stage and assayed for KLF-1 nuclear localization at D1. f Quantification of rfp expression under the cyp-25a2 promoter in N2 and isp-1(qm150);ctb-1(qm189) upon treatment with 100 µM S3QEL-2 during whole development at the second day of adulthood. Data are presented as mean ± SEM. ***p < 0.001, one-way ANOVA with Tukey post hoc test. n = 10 animals per condition. g N2 animals were treated with 20 mM H2O2 at D1 and survival was assayed 4 h later. Animals were treated with 2 µM antimycin at designated developmental stages. Data are presented as mean ± SEM. *p < 0.05, Student’s T-test. n = 100 animals per condition. h isp-1(qm150);ctb-1(qm189) were treated with S3QEL-2 at designated developmental stages and the animals were assayed for H2O2 resistance at D1. Data are presented as mean ± SEM. **p < 0.01, Student’s T-test. n = 100 animals per condition. i Lifespan curve of isp-1(qm150);ctb-1(qm189) grown on control (EV) or treated with 10 mM vitamin C from either L3 stage or D1. j Fluorescence quantification from pcyp-25a2::rfp reporter strain. isp-1(qm150);ctb-1(qm189) were assayed at D5, upon the designated treatments with 10 mM vitamin C. Data are normalized to control animals (presented as dashed line). *p < 0.05, Student’s T-test. n = 10 animals per condition

References

    1. Shore DE, Ruvkun G. A cytoprotective perspective on longevity regulation. Trends Cell Biol. 2013;23:409–420. doi: 10.1016/j.tcb.2013.04.007. - DOI - PMC - PubMed
    1. Epel ES, Lithgow GJ. Stress biology and aging mechanisms: toward understanding the deep connection between adaptation to stress and longevity. J. Gerontol. A Biol. Sci. Med Sci. 2014;69(Suppl 1):S10–S16. doi: 10.1093/gerona/glu055. - DOI - PMC - PubMed
    1. Iyanagi T. Molecular mechanism of phase I and phase II drug-metabolizing enzymes: implications for detoxification. Int Rev. Cytol. 2007;260:35–112. doi: 10.1016/S0074-7696(06)60002-8. - DOI - PubMed
    1. Swindell WR. Gene expression profiling of long-lived dwarf mice: longevity-associated genes and relationships with diet, gender and aging. BMC Genom. 2007;8:353. doi: 10.1186/1471-2164-8-353. - DOI - PMC - PubMed
    1. Steinbaugh MJ, Sun LY, Bartke A, Miller RA. Activation of genes involved in xenobiotic metabolism is a shared signature of mouse models with extended lifespan. Am. J. Physiol. Endocrinol. Metab. 2012;303:E488–E495. doi: 10.1152/ajpendo.00110.2012. - DOI - PMC - PubMed

Publication types

MeSH terms

Substances