. 2019 Jul 25;10(1):3320.
doi: 10.1038/s41467-019-11147-3.

IFN-γ selectively suppresses a subset of TLR4-activated genes and enhancers to potentiate macrophage activation

Affiliations

IFN-γ selectively suppresses a subset of TLR4-activated genes and enhancers to potentiate macrophage activation

Kyuho Kang et al. Nat Commun. .

Abstract

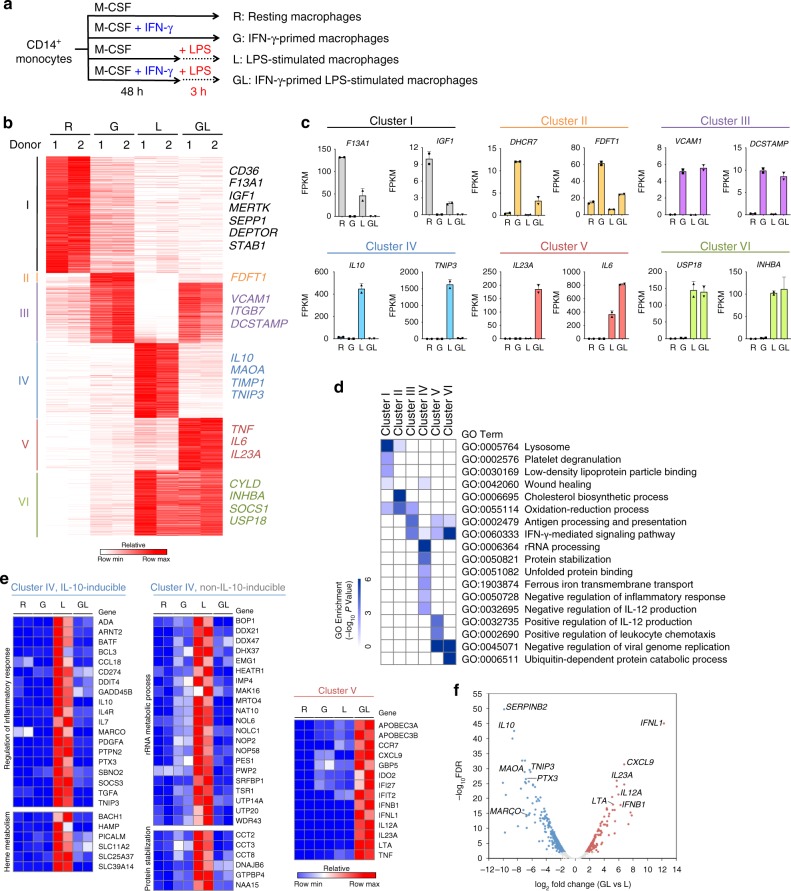
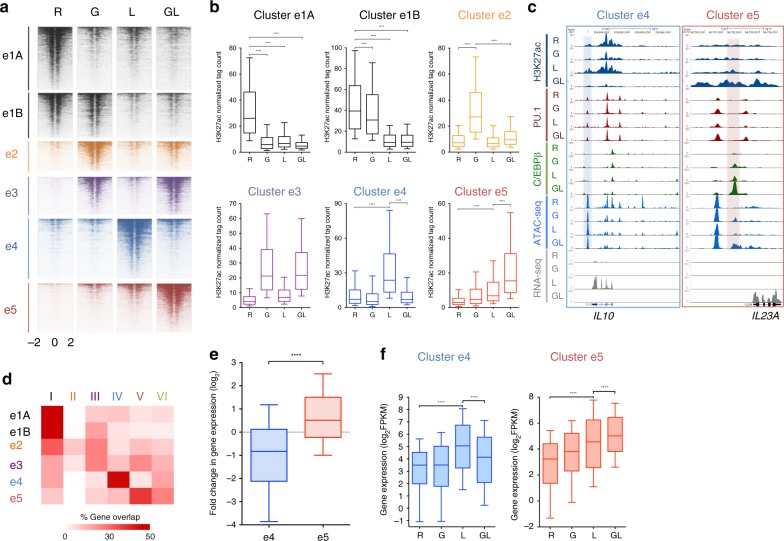
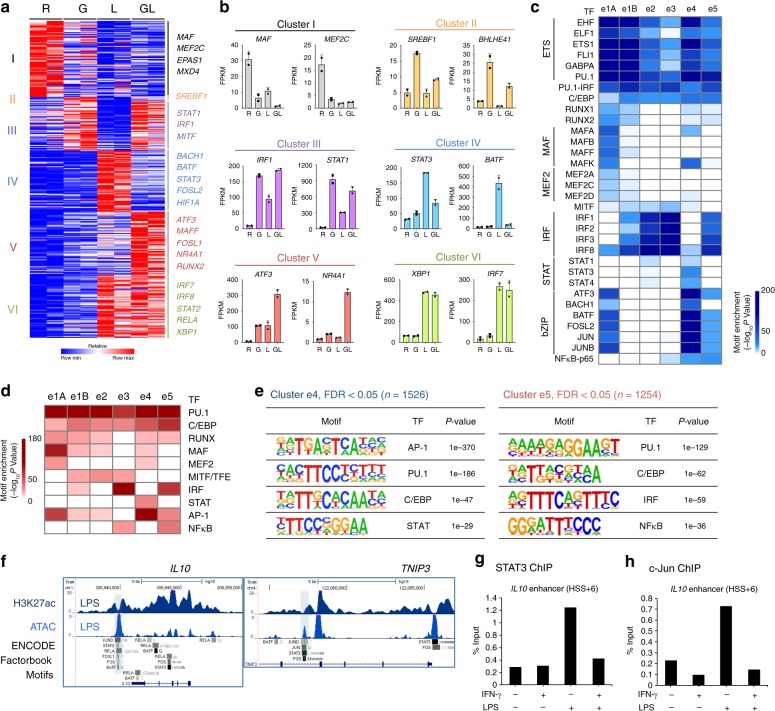
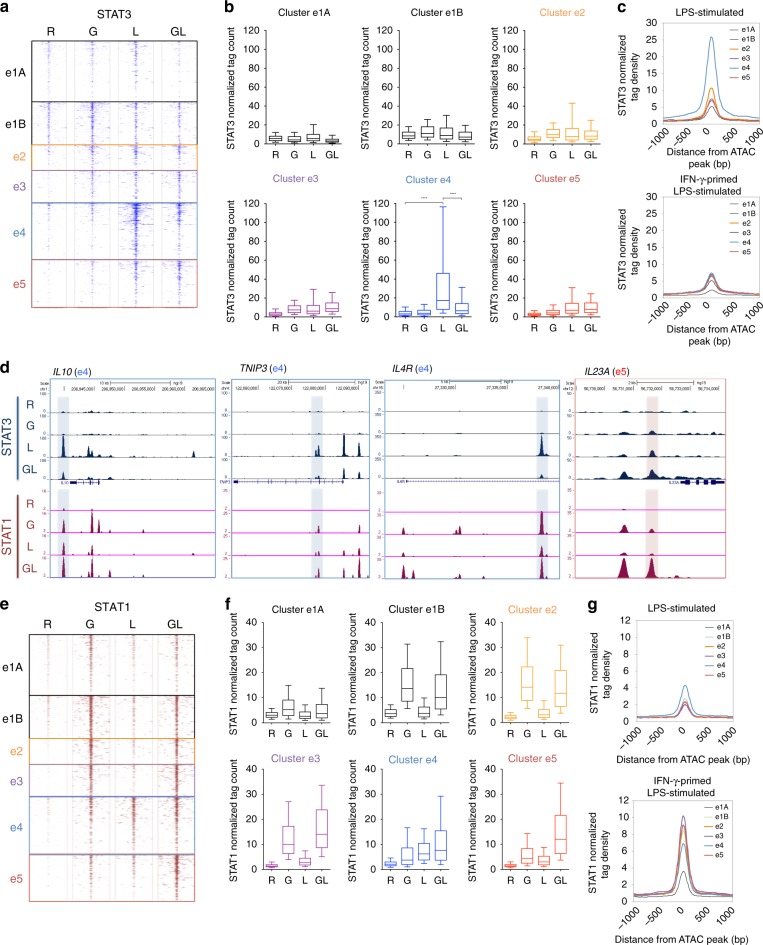
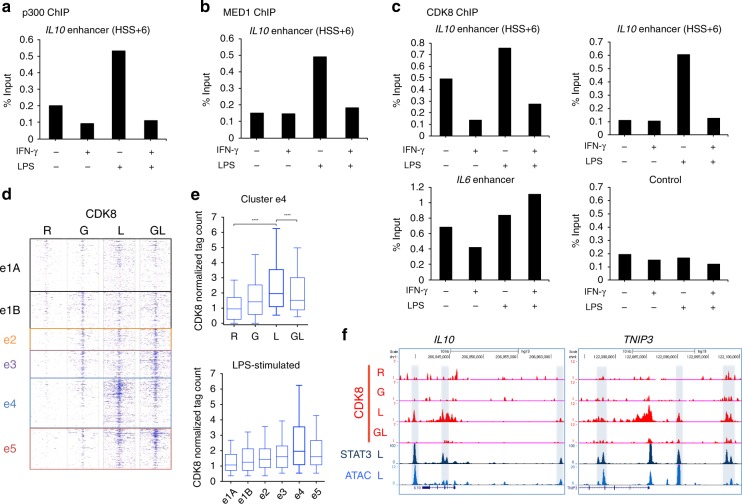
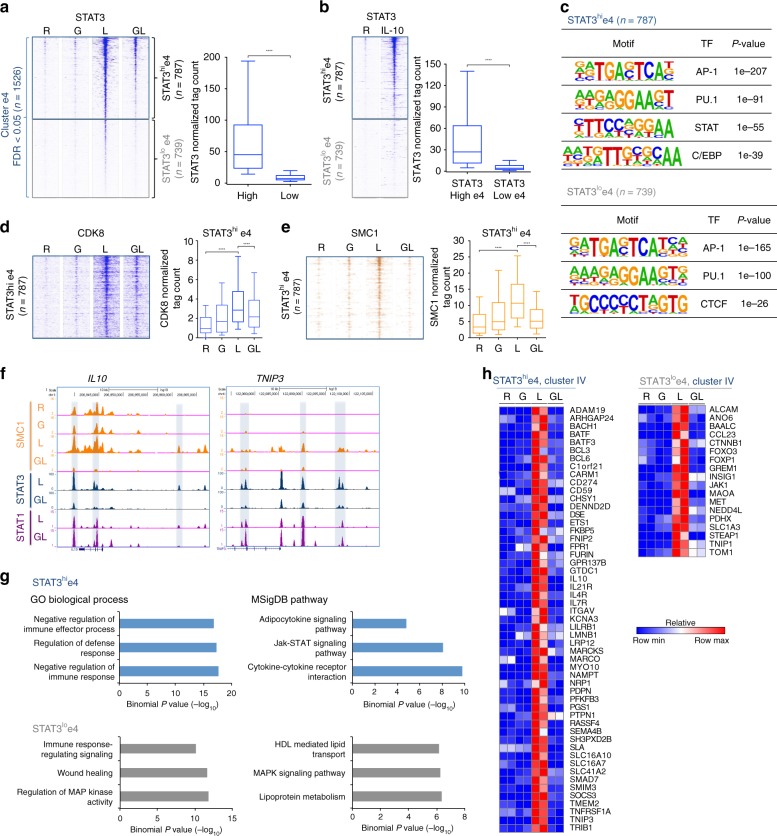
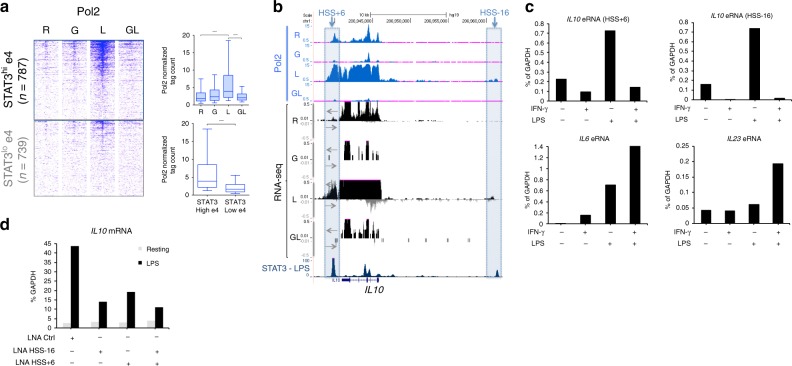
Activation of macrophage proinflammatory and antimicrobial phenotypes is regulated by IFN-γ and LPS via synergistic induction of canonical, inflammatory NF-κB target genes. However, whether IFN-γ negatively regulates components of the LPS response, and how this may affect macrophage activation, is still unclear. Here we use combined transcriptomic and epigenomic approaches to find that IFN-γ selectively abrogates LPS-induced feedback and alters macrophage metabolic pathways by suppressing TLR4-mediated gene activation. In contrast to superinduction of inflammatory genes via enhancers that bind IRF1 and STAT1, IFN-γ represses target enhancers that bind STAT3. TLR4-activated but IFN-γ-suppressed enhancers comprise two subsets discernable by differential regulation of histone acetylation and recruitment of STAT3, CDK8 and cohesin. Our findings thus show that IFN-γ suppresses feedback inhibitory and metabolic components of TLR responses to enhance macrophage activation; they also provide insights for IFN-γ-mediated selective inhibition of TLR4-induced transcription. Such inhibition can contribute to severe and sustained inflammatory responses.


Conflict of interest statement

The authors declare no competing interests.

Figures

Fig. 1
Fig. 1
IFN-γ-mediated reprogramming of TLR4-induced transcriptome in human macrophages. a Experimental design: human CD14+ monocyte-derived macrophages underwent one of four different combinations of priming for 48 h with IFN-γ before stimulation with LPS (or not) for 3 h: without priming or stimulation (R); primed with IFN-γ without LPS stimulation (G); LPS stimulation only with no priming (L); or primed with IFN-γ and stimulated with LPS (GL). b K-means (K = 6) clustering of 3,909 differentially expressed genes in any pairwise comparison among four conditions. Clusters are indicated on the left. c Examples of expression of select genes from the six clusters identified in a. Each dot in the bar plot represents one donor and error bars represent standard deviation. d Heatmap showing the P-value significance of GO term enrichment for genes in each cluster. e Heatmap showing the relative expression of representative cluster IV genes that are inducible by IL-10 (left), cluster IV genes that are not inducible by IL-10 (middle), and cluster V genes. Distinct biological functions are indicated on the left. IL-10-inducible genes were obtained from GSE43700. f Volcano plot of transcriptomic changes between LPS (L) and IFN-γ-primed LPS-stimulated (GL) macrophages; colored dots correspond to genes with significant (FDR < 0.01) and greater than two-fold expression changes. Data from two independent experiments with different donors are depicted
Fig. 2
Fig. 2
Selective regulation of LPS-activated enhancer landscapes by IFN-γ. a K-means clustering (K = 5) of enhancers as shown in Supplementary Fig. 2a further filtered (FDR < 0.05, > 2-fold changes) and subdivided into six enhancer clusters. Heatmaps showing H3K27ac ChIP-seq signals at each enhancer cluster. b The boxplots indicate normalized tag counts at each enhancer cluster. ****p < 0.0001, paired-samples Wilcoxon signed-rank test. Boxes encompass the twenty-fifth to seventy-fifth percentile changes. Whiskers extend to the tenth and nintieth percentiles. The central horizontal bar indicates the median. Data are representative of two independent experiments. c Representative UCSC Genome Browser tracks displaying normalized tag-density profiles at enhancers of IL10 and IL23A in four conditions. Shaded boxes enclose a cluster e4 enhancer (left) and cluster e5 enhancer (right). d Heatmap presentation of the percentage of genes in each cluster (Fig. 1a) that overlap with genes associated with the differentially regulated enhancer clusters identified in panel a. e Boxplots showing the change in gene expression between LPS and IFN-γ-primed and LPS-stimulated macrophages for the differentially expressed genes nearest (within 100 kb) to cluster e4 or e5 enhancers. ****p < 0.0001 by Welch’s t-test. f Boxplots showing gene expression in the four indicated conditions for e4- or e5-associated genes. ****p < 0.0001 by paired-samples Wilcoxon signed-rank test. Boxes encompass the twenty-fifth to seventy-fifth percentile changes. Whiskers extend to the tenth and nintieth percentiles. The central horizontal bar indicates the median. Data are representative of two independent experiments
Fig. 3
Fig. 3
TF expression and binding motif enrichment in distinct enhancer subsets. a Heatmap of gene expression of 91 transcription factors in the clusters defined in Fig. 1a. b Examples of TF gene expression from the six identified clusters identified in a. c Heatmap showing the P-value significance of known motif enrichment in each cluster (defined as in Fig. 2a) and grouped according to TF families (left). d Heatmap showing the P-value significance of de novo motif enrichment in six enhancer clusters. e The most significantly enriched transcription factor (TF) motifs identified by de novo motif analysis using HOMER in cluster e4 (left) and cluster e5 (right) enhancers. f UCSC Genome Browser tracks showing normalized tag density of H3K27ac ChIP-seq and ATAC-seq in LPS-stimulated macrophages. Cumulative TF binding at each e4 enhancer from ENCODE project (Factorbook) is shown below the gene tracks. Boxes enclose representative e4 enhancers at IL10 (left) and TNIP3 (right) locus. g ChIP-qPCR of STAT3 at the e4 enhancer (HSS + 6) of IL10. h ChIP-qPCR of c-Jun at the e4 enhancer (HSS + 6) of IL10. Data depict experiments with two different donors (a) or are representative of two (bf) or three (g, h) independent experiments
Fig. 4
Fig. 4
Differential occupancy of STAT3 and STAT1 at e4 and e5 enhancers. a Heatmaps showing STAT3 ChIP-seq signals at each enhancer cluster defined in Fig. 2a. b Boxplots depicting normalized tag counts at each enhancer cluster. ****p < 0.0001, paired-samples Wilcoxon signed-rank test. c Distribution of the average signal of STAT3 ChIP-seq at each enhancer cluster in LPS-stimulated (top) and IFN-γ-primed LPS-stimulated macrophages (bottom). d Representative UCSC Genome Browser tracks displaying normalized tag-density profiles at enhancers of IL10, TNIP3, IL4R, and IL23A in the four indicated conditions. Boxes enclose cluster e4 enhancer (blue) and cluster e5 enhancer (red). e Heatmaps showing STAT1 ChIP-seq signals at each enhancer cluster. f The boxplots indicate normalized tag counts at each enhancer cluster. g Distribution of the average signal of STAT1 ChIP-seq at each enhancer cluster in LPS-stimulated (top) and IFN-γ-primed LPS-stimulated macrophages (bottom). Data are representative of two independent experiments each of which included at least two independent donors (ad) or are from GSE43036 (eg). Boxes encompass the twenty-fifth to seventy-fifth percentile changes. Whiskers extend to the tenth and ninetieth percentiles. The central horizontal bar indicates the median
Fig. 5
Fig. 5
IFN-γ suppresses coactivator and CDK8 recruitment to e4 enhancers. a ChIP-qPCR analysis of p300 occupancy at the e4 enhancer (HSS + 6) of IL10. b ChIP-qPCR analysis of MED1 occupancy at the e4 enhancer (HSS + 6) of IL10. c ChIP-qPCR analysis of CDK8 occupancy at e4 enhancers (HSS + 6 and HSS-16) of IL10 and e5 enhancer of IL6. d Heatmap showing CDK8 ChIP-seq signals at each enhancer cluster defined in Fig. 2a. e The boxplot (top) indicates normalized tag counts at e4 enhancer in the four indicated conditions. ****p < 0.0001, paired-samples Wilcoxon signed-rank test. The boxplot (bottom) indicates normalized tag counts at each enhancer cluster in LPS-stimulated macrophages. Boxes encompass the twenty-fifth to seventy-fifth percentile changes. Whiskers extend to the tenth and ninetieth percentiles. The central horizontal bar indicates the median. f Representative UCSC Genome Browser tracks displaying normalized tag-density profiles at e4 enhancers of IL10 and TNIP3 in the four indicated conditions (CDK8) and the LPS-stimulated condition (STAT3 ChIP-seq and ATAC-seq). Data are representative of three independent experiments (ac), or depict one ChIP experiment using pooled samples from independent experiments using four different donors (d, e)
Fig. 6
Fig. 6
The strength of STAT3 binding divides e4 enhancers into two subgroups. a Heatmaps of STAT3 ChIP-seq signals at cluster e4 enhancers in the four indicated conditions. Enhancers were separated into two subsets: STAT3hie4 (n = 787) and STAT3loe4 (n = 739) based upon a cutoff of log2 normalized tag counts = 3). The boxplot (right) depicts normalized tag counts at STAT3hie4 and STAT3loe4 enhancers. b Heatmaps of STAT3 ChIP-seq signals at two subsets of e4 enhancers (defined in a) in resting and IL-10-stimulated macrophages. The boxplot (right) indicates normalized tag counts at STAT3hie4 and STAT3loe4 enhancers. c The most significantly enriched transcription factor (TF) motifs identified by de novo motif analysis using HOMER at STAT3hie4 (top) and STAT3loe4 (bottom) enhancers. d Heatmaps of CDK8 ChIP-seq signals at STAT3hie4 enhancers in the four indicated conditions. The boxplot (right) indicates normalized tag counts at STAT3hie4 enhancers. e Heatmaps of SMC1 ChIP-seq signals at STAT3hie4 enhancers in the four indicated conditions. The boxplot (right) indicates normalized tag counts at STAT3hie4 enhancers in four conditions. ****p < 0.0001, paired-samples Wilcoxon signed-rank test. f Representative UCSC Genome Browser tracks displaying normalized tag-density profiles at e4 enhancers of IL10 and TNIP3 in the indicated conditions. g Enriched Gene Ontology (GO) and MSigDB pathway categories of genes assigned to STAT3hie4 enhancers (upper panel) or STAT3loe4 enhancers (lower panel). h Heatmaps of IL-10-inducible cluster IV genes that correspond to STAT3hie4-associated genes (left panel) or non-IL-10-inducible cluster IV genes that correspond to STAT3loe4-associated genes (right panel). Data are representative of two independent experiments each of which included at least two independent donors (a, c, g, h) or depict one ChIP experiment using pooled samples from independent experiments using two (b) or four different donors (d, e). Boxes encompass the twenty-fifth to seventy-fifth percentile changes. Whiskers extend to the tenth and ninetieth percentiles. The central horizontal bar indicates the median
Fig. 7
Fig. 7
IFN-γ-mediated functional deactivation of STAT3-bound e4 enhancers. a Heatmaps of Pol II ChIP-seq signals at STAT3hie4 and STAT3loe4 enhancers (defined in Fig. 6a). The boxplots indicate normalized tag counts at STAT3hie4 enhancers in the four indicated conditions (top) and at STAT3hie4 and STAT3loe4 enhancers in LPS-stimulated macrophages (bottom). ****p < 0.0001, paired-samples Wilcoxon signed-rank test. Boxes encompass the twenty-fifth to seventy-fifth percentile changes. Whiskers extend to the tenth and ninetieth percentiles. The central horizontal bar indicates the median. b Representative Genome Browser tracks showing RNA polymerase II (Pol II) occupancy, strand-specific RNA transcripts, and STAT3 occupancy (LPS condition) at enhancers of IL10. Boxes enclose HSS + 6 (left) and HSS-16 (right). c RT-qPCR analysis of enhancer RNA (eRNA) expression at two e4 enhancers (top, IL10-HSS + 6 and IL-10-HSS-16) and two e5 enhancers (bottom, IL6 and IL23A). Data are representative of three independent experiments. d RT–qPCR analysis of IL10 mRNA in resting and LPS-stimulated macrophages transfected with the indicated LNAs (IL10-HSS-16 eRNA and and IL10-HSS + 6 eRNA). Data are representative of two independent experiments

References

    1. Ginhoux F, Schultze JL, Murray PJ, Ochando J, Biswas SK. New insights into the multidimensional concept of macrophage ontogeny, activation and function. Nat. Immunol. 2016;17:34–40. doi: 10.1038/ni.3324. - DOI - PubMed
    1. Amit I, Winter DR, Jung S. The role of the local environment and epigenetics in shaping macrophage identity and their effect on tissue homeostasis. Nat. Immunol. 2016;17:18–25. doi: 10.1038/ni.3325. - DOI - PubMed
    1. Monticelli S, Natoli G. Transcriptional determination and functional specificity of myeloid cells: making sense of diversity. Nat. Rev. Immunol. 2017;17:595. doi: 10.1038/nri.2017.51. - DOI - PubMed
    1. Lawrence T, Natoli G. Transcriptional regulation of macrophage polarization: enabling diversity with identity. Nat. Rev. Immunol. 2011;11:750–761. doi: 10.1038/nri3088. - DOI - PubMed
    1. Murray, P. J. Macrophage activation and polarization: nomenclature and experimental guidelines. Immunity41, 14–20 (2014). - PMC - PubMed

Publication types

MeSH terms