. 2019 Jul 25;10(1):3325.
doi: 10.1038/s41467-019-11129-5.

Glycine, serine and threonine metabolism confounds efficacy of complement-mediated killing

Affiliations

Glycine, serine and threonine metabolism confounds efficacy of complement-mediated killing

Zhi-Xue Cheng et al. Nat Commun. .

Abstract

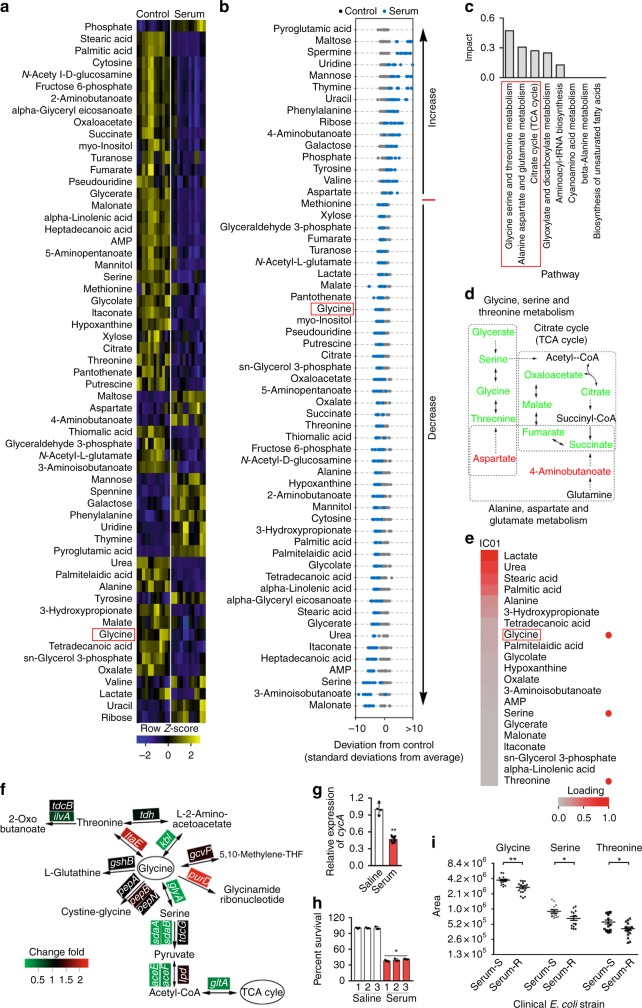
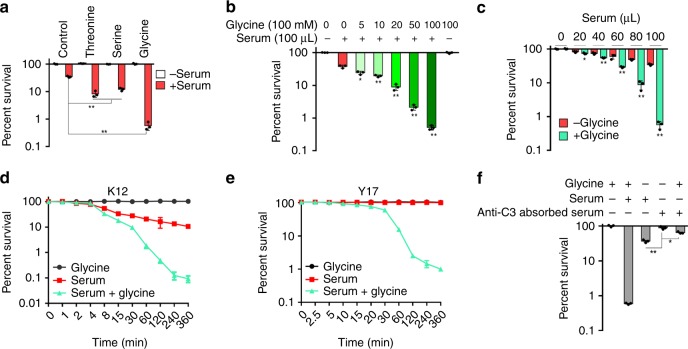
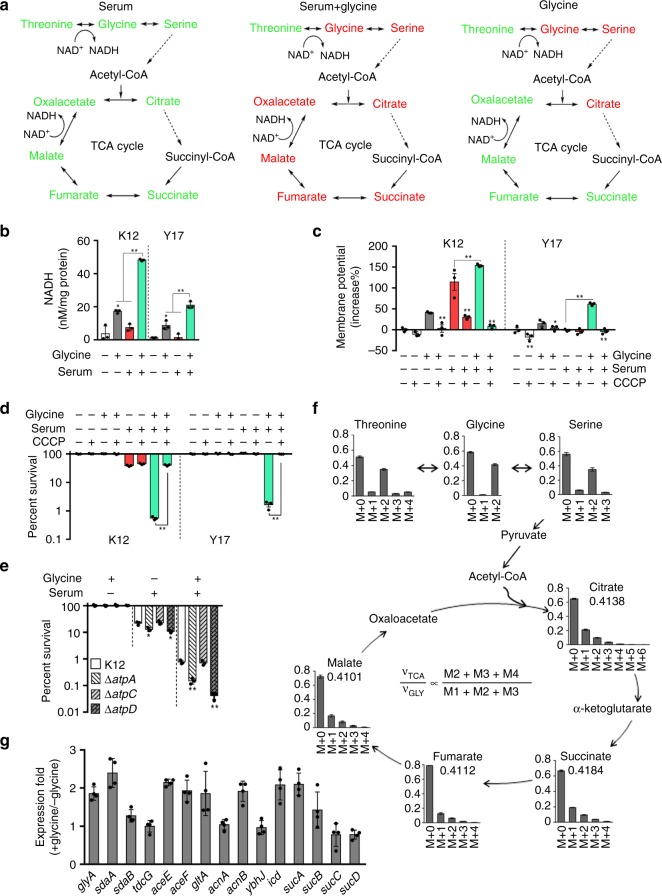
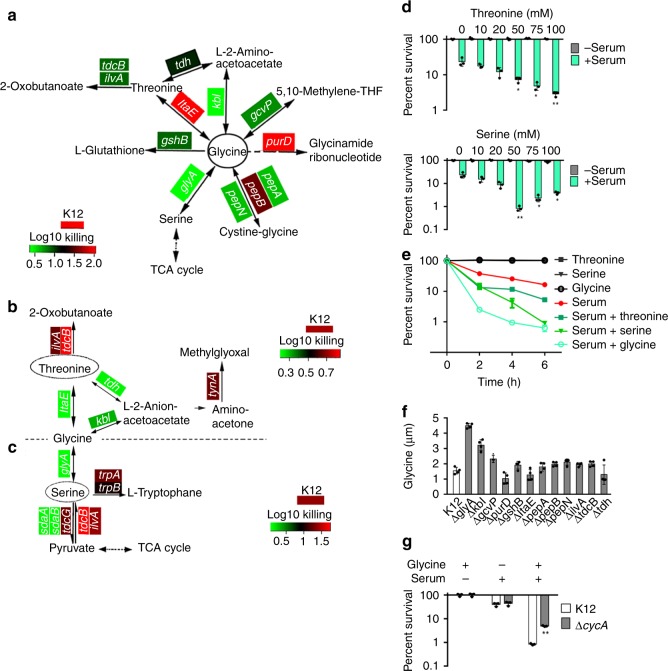
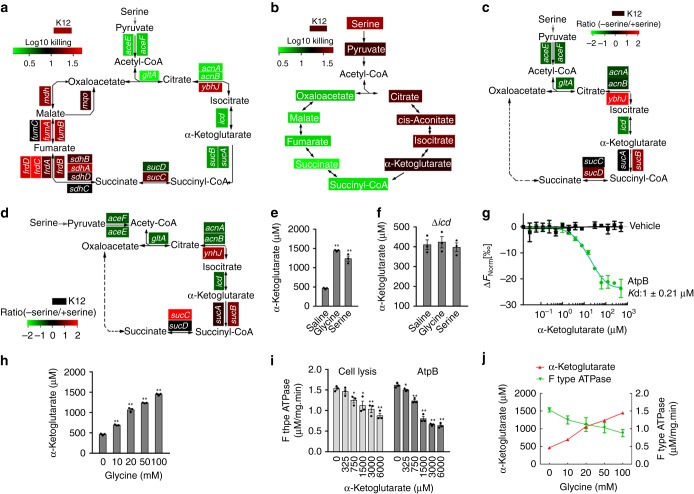
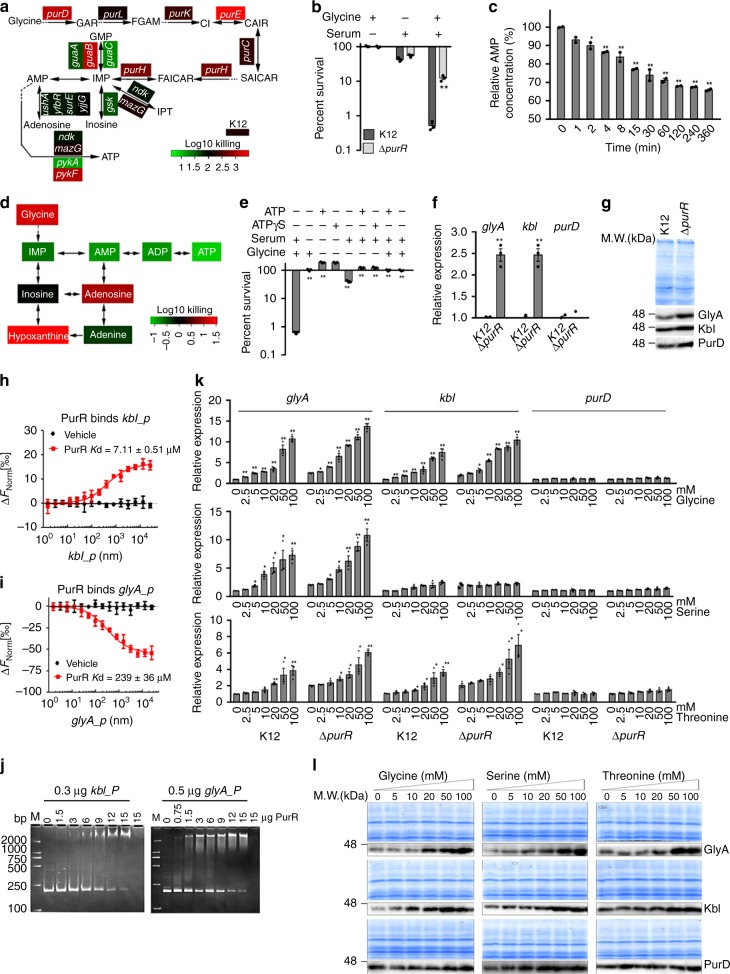
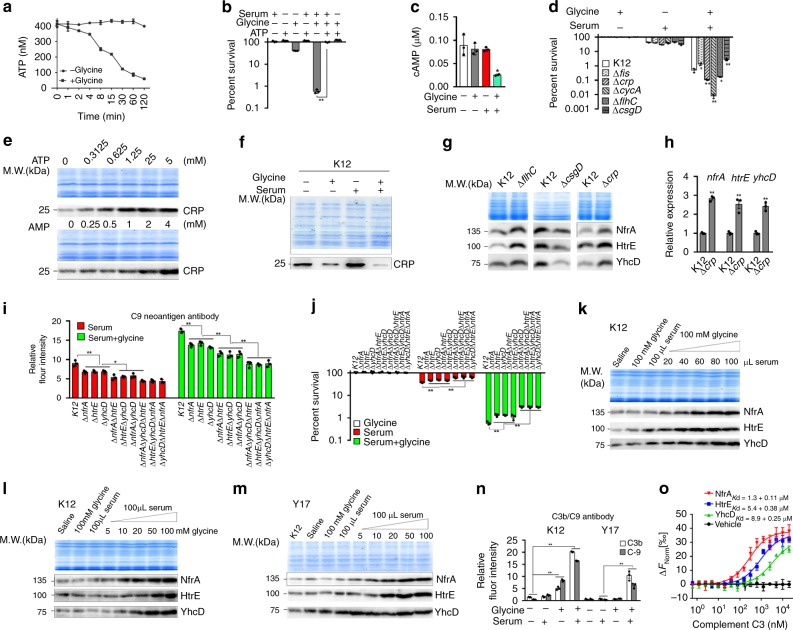
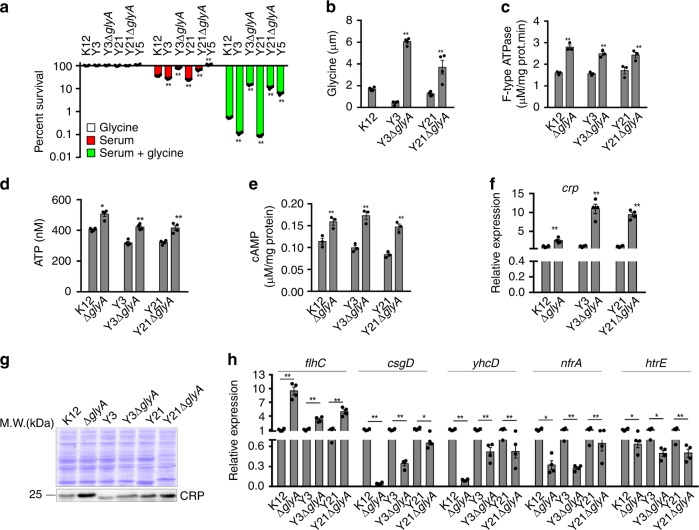
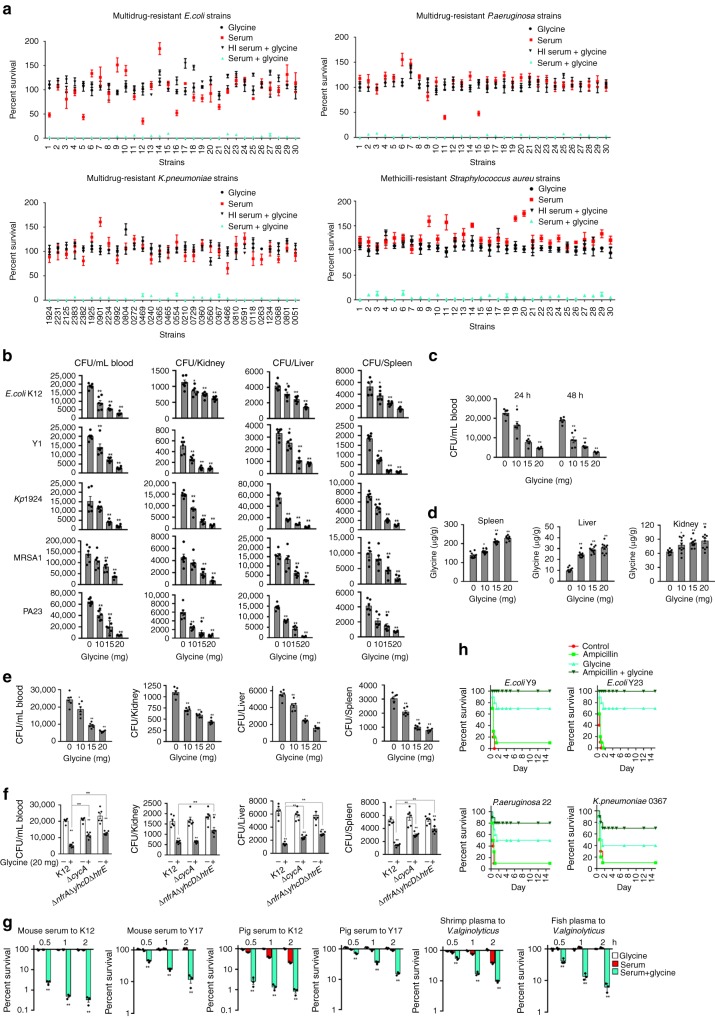
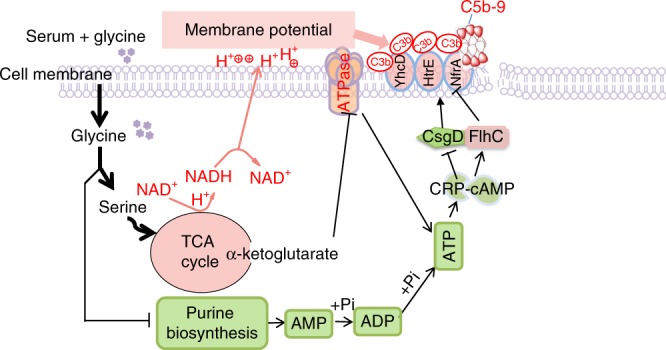
Serum resistance is a poorly understood but common trait of some difficult-to-treat pathogenic strains of bacteria. Here, we report that glycine, serine and threonine catabolic pathway is down-regulated in serum-resistant Escherichia coli, whereas exogenous glycine reverts the serum resistance and effectively potentiates serum to eliminate clinically-relevant bacterial pathogens in vitro and in vivo. We find that exogenous glycine increases the formation of membrane attack complex on bacterial membrane through two previously unrecognized regulations: 1) glycine negatively and positively regulates metabolic flux to purine biosynthesis and Krebs cycle, respectively. 2) α-Ketoglutarate inhibits adenosine triphosphate synthase, which in together promote the formation of cAMP/CRP regulon to increase the expression of complement-binding proteins HtrE, NfrA, and YhcD. The results could lead to effective strategies for managing the infection with serum-resistant bacteria, an especially valuable approach for treating individuals with weak acquired immunity but a normal complement system.


Conflict of interest statement

The authors declare no competing interests.

Figures

Fig. 1
Fig. 1
Serum-sensitive and -resistant bacteria have distinct metabolism. a Heat map showing relative abundance of 59 significantly differential metabolites in E. coli K12 in the absence (control) or presence (serum) of serum, as indicated. Heat map scale (blue to yellow, low to high abundance) is shown below data (n = 6). b Z-scores (standard deviation from average) corresponding to data in (a). c Pathway enrichment of significantly differential metabolites. Red box highlights the first three of most impacted pathways. d, Pathway interconnections of the first three most impacted pathways. The change of metabolite abundance is indicated as follows: black, no change; red, upregulation; green, downregulation; gray, not detected. e Hierarchical clustering of the decreased abundance of metabolites in serum-treated samples. Heat map scale (gray to red; low to high loading) is shown below data. Red box highlights glycine and red dot highlights glycine, serine and threonine metabolism. f, g qRT-PCR for the expression of glycine catabolism genes (f) and glycine transporter, cycA (g) in the presence or absence of 100 μL serum (n = 3). h Effect of repeated killing by serum on percent survival of E. coli K12. E. coli K12 was treated with serum (1) for selection of survivors, which was treated by the other two round of serum treatments (2 and 3). Percent of survival was calculated (n = 3). i Scatter plots showing a normalized abundance of glycine, serine, and threonine in eight serum-susceptible (Serum-S) and eight serum-resistant (Serum-R) clinical E. coli strains (n = 8). Results (gi) are displayed as mean ± SEM, and significant difference is identified (*p < 0.05; **p < 0.01) as determined by two-tailed Student’s t test. See also Supplementary Figs. 1–4
Fig. 2
Fig. 2
Glycine increases the susceptibility of E. coli to serum. a Percent survival of E. coli K12 incubated with 100 μL serum in the presence or absence of 100 mM glycine, serine, or threonine (n = 3). b Synergetic effects of 100 μL serum and glycine on viability of E. coli K12 were measured in a glycine dose-dependent manner (0–100 mM) (n = 3). c Percent survival of E. coli K12 incubated with 100 mM glycine plus serum (0–100 μL) or without glycine (n = 3). d, e Percent survival of E. coli K12 (d) and Y17 (e) in the presence of 100 mM glycine or/and 100 μL serum for the indicated length of time (n = 3). f Percent survival of E. coli K12 in the presence of 100 mM glycine or/and 100 μL serum or anti-C3 absorbed serum for 2 h (n = 3). Results are displayed as mean ± SEM (af), and significant differences are identified (*p < 0.05, **p < 0.01) as determined by two-tailed Student’s t test (ac, f). See also Supplementary Fig. 5
Fig. 3
Fig. 3
TCA cycle-triggered membrane depolarization. a Summary of metabolic flux through the TCA cycle in the presence of serum, serum plus glycine, or glycine. Change in metabolite abundance is indicated as follows: red, upregulation; green, down-regulation; gray, not detected. NAD+, nicotinamide adenine dinucleotide; NADH, reduced nicotinamide adenine dinucleotide (n = 6). b NADH concentration in E. coli K12 and Y17 in the presence of 100 μL serum, 100 mM glycine or both for 2 h (n = 3). c, d Membrane potential (c) and percent survival (d) of E. coli K12 and Y17 treated with 100 µL serum for 2 h in presence or absence of 100 mM glycine or/and CCCP (n = 3). For membrane potential, 50,000 cells were recorded with forwarding versus side scatter and were gated before data acquisition. e Percent survival of E. coli, ΔatpA, ΔatpC, and ΔatpD in the presence of 100 mM glycine, 100 µL serum, or both for 2 h (n = 3). f Mass isotopomer distributions for 13C labeled glycine detected in a nontargeted manner in the presence of 100 mM glycine. The relative flux for that metabolite in the TCA cycle (υTCAGLY) is defined (M2 + M3 + M4)/(M1 + M2 + M3) ratio, where υTCA refers to the turnover of a particular metabolite pool and υGLY refers to the flux of glycine carbon atoms to the TCA cycle. g qRT-PCR for relative expression of genes contributed to the flux from serine to the upper TCA cycle in the presence or absence of 100 mM glycine (n = 3). Results are displayed as mean ± SEM (bg), and significant differences are identified (*p < 0.05, **p < 0.01) as determined by two-tailed Student’s t test (ae, g)
Fig. 4
Fig. 4
Glycine flux to the TCA cycle regulates bacterial serum susceptibility. ac Survival of the E. coli mutants in the presence or absence of 100 µL serum plus 100 mM glycine (a), threonine (b) or serine (c). Heat map scale (blue to red) represents low to high killing without the indicated gene (n = 3). d Percent survival of E. coli K12 incubated with or without 100 μL serum plus different concentrations of serine (0–100 mM) or threonine (0–100 mM) (n = 3). e Percent survival of E. coli K12 incubated with 100 μL serum plus 50 mM glycine, serine, or threonine for different time points (n = 3). f Glycine level of the E. coli mutants as the same as (a) (n = 4). g Percent survival of E. coli K12 and ΔcycA in the presence of 100 μL serum, 100 mM glycine or both (n = 3). Results are displayed as mean ± SEM (dg), and significant differences are identified (*p < 0.05, **p < 0.01) as determined by two-tailed Student’s t test (d, f, g). See also Supplementary Fig. 9
Fig. 5
Fig. 5
The TCA cycle regulates bacterial serum susceptibility. a Summary of relative survival of the indicated mutant strains of E. coli K12 in the presence or absence of 50 mM serine plus 100 µL serum for 2 h (n = 3). b Summary of relative survival of E. coli K12 in the presence or absence of the indicated metabolites of the TCA cycle plus 100 µL serum for 2 h (n = 3). c, d Summary of relative ATP synthase activity (c) and ATP content (d) of the indicated mutant strains of E. coli K12 for 2 h in the presence and absence of 50 mM serine plus 100 μL serum. Heat map scale (ad) (green to red) represents low to high killing (a, b) or ratio (c, d) without the indicated genes (a, c and d) or with the indicated metabolites (b) (n = 3). e, f Intracellular α-Ketoglutarate concentration in the presence or absence of 100 mM glycine or serine (e), and the effect of loss of icd (f) (n = 3). g AtpB and α-Ketoglutarate interaction assay by MST (n = 3). h Effect of exogenous glycine (0–100 mM) on the intracellular α-Ketoglutarate level (n = 3). i Measurement of intracellular ATP synthase activity using E. coli K12 cell lysis (cell lysis) or purified recombinant AtpB plus the indicated concentration of α-Ketoglutarate (n = 3). j The interrelation between α-Ketoglutarate level and intracellular ATP synthase activity from data (h, i) (n = 3). Results (ej) are displayed as mean ± SEM, and significant differences are identified (*p < 0.05, **p < 0.01) as determined by two-tailed Student’s t test (e, h, i). See also Supplementary Fig. 9
Fig. 6
Fig. 6
Regulation of glycine, serine, and threonine to GlyA. a Percent survival of E. coli mutants lacking the indicated genes of purine metabolism in the presence or absence of 100 mM glycine plus 100 µL serum. Heat map scale (green to red) represents low to high killing without the indicated genes (n = 3). b Percent survival of Δ purR in the presence of 100 mM glycine, 100 µL serum or both (n = 3). c Relative AMP abundance of E. coli K12 in the presence of 100 mM glycine for the indicated length of time (n = 2). d Percent survival of E. coli K12 in the presence of the indicated purine metabolites (100 mM glycine, 2 mM IMP, 4 mM AMP, 2.5 mM ADP, 5 mM ATP, 10 mM inosine, 10 mM adenosine, 10 mM hypoxanthine, 10 mM adenine) plus 100 µL serum. Heat map scale (green to red) represents low to high killing with the indicated metabolites (n = 3). e Percent survival of E. coli K12 in the presence or absence of the indicated metabolites with or without serum. ATPγS, a nonhydrolyzable ATP analog (n = 3). f qRT-PCR for relative expression of glyA, kbl, and purD in the presence or absence of purR (n = 3). g Western blot for GlyA, Kbl and PurD expression in the presence or absence of purR. h, i MST assay for investigation of PurR-kbl promoter (h) and PurR-glyA promoter interaction (i) (n = 3). j Electrophoretic mobility shift assay (EMSA) for investigation of PurR-kbl promoter and PurR-glyA promoter interaction. k qRT-PCR for relative expression of glyA, kbl, and purD in the presence or absence of purR and in the indicated concentrations of glycine, serine or threonine (n = 3). l Western blot for GlyA, Kbl and PurD expression in the indicated concentrations of glycine, serine, or threonine. Results in (b, c, e, f, k) are displayed as mean ± SEM, and significant differences are identified (*p < 0.05, **p < 0.01) as determined by two-tailed Student’s t test (b, c, e, f, k). See also Supplementary Fig. 9
Fig. 7
Fig. 7
Glycine-dependent mechanism for HtrE, NfrA, YhcD expression. a Relative ATP abundance of E. coli K12 in the presence or absence of 100 mM glycine for the indicated length of time (n = 3). b Percent survival of E. coli K12 in the presence or absence of 5 mM ATP, 100 mM glycine or/and 100 µL serum (n = 3). c Relative cAMP abundance of E. coli K12 in the presence or absence of 100 mM glycine or/and 100 µL serum (n = 3). d Percent survival of the indicated mutants in the presence of 100 mM glycine, 100 µL serum or both (n = 3). e Western blot of CRP in E. coli K12 exposed to 0–5 mM ATP or 0–4 mM AMP. f Effect of 100 mM glycine, 100 µL serum or both on CRP expression. g Western blot of HtrE, NfrA, YhcD in these mutants. h qRT-PCR of htrE, nfrA, yhcD in these mutants (n = 3). i Flow cytometry quantification of anti-C9 neoantigen on outer membrane surface of the indicated mutants (n = 3). j Percent survival of the indicated mutants in the presence of 100 mM glycine, 100 µL serum or both (n = 3). k Western blot of HtrE, NfrA, YhcD of E. coli K12 in the presence of 100 mM glycine and the indicated amount of serum. l, m Western blot of HtrE, NfrA, YhcD of E. coli K12 (l) and Y17 (m) in the presence of 100 µL serum and the indicated concentrations of glycine. n Flow cytometry quantification of anti-C3b and anti-C9 neoantigen on E. coli K12 and Y17 in the presence or absence of 100 µL serum or 100 mM glycine or both. o, MST for the interaction of complement C3 with HtrE, NfrA, YhcD (n = 3). i, n 50,000 cells were record with forwarding versus side scatter and were gated before data acquisition. Results in (ad, hj, n, o) are displayed as mean ± SEM, and significant differences are identified (*p < 0.05, **p < 0.01) as determined by two-tailed Student’s t test. See also Supplementary Figs. 10–15
Fig. 8
Fig. 8
Effect of glyA deletion on glycine-cAMP/CRP-YhcD/NfrA/HtrE pathway. a, b Percent survival (a) and intracellular glycine (b) of E. coli Y3 and Y21 and their glyA-deleted mutants Y3△glyA and Y21△glyA, respectively. E. coli K12 and serum-resistant Y15 were used as negative and positive controls, respectively (n = 4). ce ATP synthase activity (c), ATP level (d), and cAMP level (e) in the indicated strains (c, e, n = 3; d, n = 4). f crp expression in the absence of glyA (n = 4). g CRP expression in the absence of glyA. h qRT-PCR for expression of flhC, csgD, yhcD, nfrA, and htrE in the absence of glyA (n = 3). Results are displayed as mean ± SEM (af, g), and significant differences are identified (*p < 0.05, **p < 0.01) as determined by two-tailed Student’s t test (af, g)
Fig. 9
Fig. 9
Glycine increases the susceptibility of clinical bacteria to killing by serum. a Percent survival of multidrug-resistant E. coli, P. aeruginosa, K. pneumoniae, and MRSA in the presence of 100 mM glycine, 100 µL serum, or both, or 100 µL HI serum plus 100 mM glycine. Differences were found at p < 0.01 between the group with glycine + serum and the three other groups in all samples (n = 3). b, c BALB/c mice were infected with the indicated bacteria by i.p. injection (see methods) and treated with glycine as described (see text). Bacterial load was measured in blood, kidney, spleen, and liver (b) and with time in the blood (c) (n = 6). d Glycine concentrations in the spleen, liver, and kidney were measured at 48 h after the i.p. injection of the indicated glycine concentration (n = 10). e, f Rag1−/− (e) and BALB/c (f) mice were infected with the indicated bacteria by i.p. injection (see methods) and treated with glycine as described (see text). Bacterial load was measured in blood, kidney, liver, and spleen (n = 6). g Glycine-enabled killing of the indicated bacteria by 100 μL other sources of serum with or without 100 mM glycine for the indicated length of time (n = 3). h Percent survival of mice infected the indicated bacterial pathogens and then treatment by saline (control), ampicillin (320 mg kg−1), glycine (800 mg kg−1) or both as described (see text for details) (n = 6). Results are displayed as mean ± SEM, and significant differences are identified (*p < 0.05, **p < 0.01) as determined by two-tailed Student’s t test. See also Supplementary Figs. 19–20
Fig. 10
Fig. 10
Proposed mechanism of glycine-promoted complement-dependent killing. First, exogenous glycine passes into the cytoplasm, where it is converted to serine and threonine by GlyA and Kbl, respectively; second, serine fluxes to the TCA cycle and promotes α-Ketoglutarate generation, which inhibits ATP synthase, while elevated glycine, serine and threonine catabolic pathway does not favor fluxing purine metabolism due to stronger substrate activation to GlyA, thereby decreasing AMP and ADP biosynthesis. These lead to ATP reduction and the decrease of ATP affects cAMP and cAMP-CRP complex; third, glycine in conjunction with serum elevates expression and membrane deposition of HtrE, NfrA, and YhcD by FlhC and CsgD in a manner of cAMP-CRP complex; and fourth, these outer membrane proteins promote binding of complement, formation of MAC and subsequent cell death. On the catabolic side, glycine enters the TCA cycle and stimulates synthesis of NADH and increases membrane potential, which facilitates the binding of complement to the outer membrane. It is clear that metabolites dominate the novel demonstrated metabolic regulation pathways. Colors: pink, upregulation; grass green, down-regulation

References

    1. Serruto D, Rappuoli R, Scarselli M, Gros P, van Strijp JA. Molecular mechanisms of complement evasion: learning from staphylococci and meningococci. Nat. Rev. Microbiol. 2010;8:393–399. doi: 10.1038/nrmicro2366. - DOI - PubMed
    1. Nakamura S, et al. Molecular basis of increased serum resistance among pulmonary isolates of non-typeable Haemophilus influenzae. PLoS Pathog. 2011;7:e1001247. doi: 10.1371/journal.ppat.1001247. - DOI - PMC - PubMed
    1. Schindler MK, et al. Yersinia enterocolitica YadA mediates complement evasion by recruitment and inactivation of C3 products. J. Immunol. 2012;189:4900–4908. doi: 10.4049/jimmunol.1201383. - DOI - PubMed
    1. Koenigs A, et al. CipA of Acinetobacter baumannii is a novel plasminogen binding and complement inhibitory protein. J. Infect. Dis. 2016;213:1388–1399. doi: 10.1093/infdis/jiv601. - DOI - PubMed
    1. Maruvada R, Prasadarao NV, Rubens CE. Acquisition of factor H by a novel surface protein on group B Streptococcus promotes complement degradation. FASEB J. 2009;23:3967–3977. doi: 10.1096/fj.09-138149. - DOI - PMC - PubMed

Publication types

MeSH terms